Experiments in thin rotating containers partially lled with coloured particles ... mixing from which to add complexities, such as ba es, cohesion, and particle ...
New Zealand Chemical Engineering Conference Sydney, Sep 30{Oct 2 1996
Experiments on Mixing and Segregating Granular Materials Guy Metcalfe CSIRO, Highett Vic 3190 Australia SUMMARY
When our intuition is based on liquid behaviour, granular solids ow and mix in ways both novel and unexpected. We describe 2- and 3-dimensional experiments in tumbling containers tracking mixing and segregation of granular solids. The unique aspect of these experiments is that they are designed to view the grain motion. Experiments in thin rotating containers partially lled with coloured particles motivate a model which separates the dynamics and geometry of the ow and which quantitatively accounts for the measured mixing rates. These kinds of experiments should be considered testbeds of granular mixing from which to add complexities, such as ba�es, cohesion, and particle property di�erences, in a controlled manner. Model limitations and a computational challenge based on further experiments are also discussed. Non-invasive magnetic resonance imaging shows us the transport of granular solids in a slowly rotating tube with and without segregation e�ects.
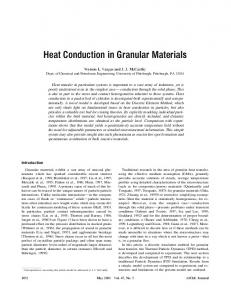
1 INTRODUCTION A better understanding of the properties of particle-laden ows would bring substantial technological bene ts from improved ow and handling, mixing, classifying, separation, etc [1]. The di�culties lie mainly in unravelling the consequences of simultaneous, fully coupled uid- uid, uid-particle, and particle-particle interactions. Figure 1 shows a simpli ed diagram of the space of general mixtures of particle-laden ows. In the lower left corner purely uids mixing is well understood [2]. The large gray area where strong uid-particle interactions dominate is poorly understood [1]. The subject of this paper is the relatively recent emergence of better understanding in the upper right corner of the diagram where particle-particle interactions dominate the motion, in particular with the mixing and segregation of dry granular solids. Solids mixing applications in diverse industries ranging from pharmaceuticals and food to ceramics and mining are distinct from the more general concerns implied in gure 1. Despite much work in powder mixing over the decades [3, 4, 5] and a recent explosion of interest in granular mechanics [6, 7, 8], a fully predictive understanding of even the simplest case of granular mixing|two indentical powders in a slowly rotating container|does not exist [9, 10]. In these circumstances we believe it is desirable to look at 2-d experiments where the mixing behavior can be explicitly viewed, quanti ed and substantially modeled. Such experiments become testbeds where complexities, such as the e�ects of ba�es, cohesion, or particle property di�erences, can be added individually and examined in a controlled manner. These experiments and a novel model are described in x2. Section 3 describes non-invasive magnetic resonance imaging (MRI) of 3-d granular mixing ows [11]. 100% solids mixing
GENERAL MIXTURES paste SOLID
slurry emulsion fluids mixing
0% 100%
FLUID
0%
Figure 1: A mixing ow in general has an arbitrary fraction of uid and solids content. The scienti c understanding of purely uids mixing is well developed [2]; that of purely granular solids mixing is beginning to be understood. Flow with fully coupled uid-particle interactions (the main gray area of the diagram) is the least understood area, but technologically very important [1].
Figure 2: (a) Experimental centroid position projected onto the material's centerline at f = 0:30. The centroids' positions are taken relative to that of the whole material and normalized to one initially. When the material is perfectly mixed, the color centroids coincide at the origin. Dots are salt data; solid lines are a t to exp( t) cos(2�t=T ). Exponential envelopes are emphasized by dashed lines. (b) The mixing rate versus ll level f . Open symbols are from ts to simulated data from the model of [9]; lled symbols are experiments. For f > 1=2 the core is removed from the calculation of . The inset shows � � V (f ) the volume mixed per characteristic time versus f . The calculated (experimental) optimum is f = 0:25 (f = 0:23). (Adapted from [9]).
2 A VIEW OF 2-D TUMBLERS A tumbler is a hollow vessel partially lled with granular material and rotated. Tumblers are common solids processing devices, e.g. drum mixers, V-blenders, or rotary kilns. With increasing rotation speed, the ow in tumblers changes through a varitey of regiemes. Here we con ne ourselves to slow ow in the avalanching regieme. Quasi-2-dimensional experiments, such as a disk ( gure 3) partially lled with colored passive particles and rotating about its axis, allow us to focus on aspects of radial mixing. For slow rotation the material's surface remains stationary until its angle with the horizontal exceeds a critical value �f where the surface fails and ows, creating an avalanche that returns the surface to its angle of repose �r ; �r < �f . We de ne slow rotation to be that which allows one avalanche to nish before the next starts. Mixing and segregation occurs through the iterative action of successive avalanches. Material below the surface layer, which for many materials in slow ow is only 6 particle diameters deep, rotates as a solid body with the container.
2.1 Mixing separated into geometry and dynamics
The following observation motivates a very simple, yet powerful, model for tumbling mixers. The angle j�f ? �r j de nes a wedge of material. See [9, 10] for details on the geometrical construction of these wedges. An avalanche then has two actions: the rst moves all the material in the wedge at the upper surface to the wedge on the lower portion of the surface; the second action mixes the material within the avalanching wedge. Mixing within wedges is accomplished by the speci c dynamics of the avalanche ow. Thus, the problem of avalanche mixing divides into two distinct parts: transport of wedges and transport within wedges. We therefore analyze mixing due to wedge transport geometrically and represent the dynamics of mixing within the wedges by rearranging the particles in the wedge according to a prescribed rule. Although the detailed dynamics of an avalanche are not well understood, the simple geometrical division yields valuable insights. Most surprising, however, is that quantitative predictions do not require detailed knowledge of the correct dynamics. In fact the rule we choose is a random rearrangement. By decomposing the problem in this way, it is possible to study the implications of the geometry and dynamics separately and to add complexities in a controlled fashion. Mixing between wedges occurs because wedges overlap for almost all ll levels f ; the size of this overlap is mostly responsible for the mixing behavior. As wedge overlap increases with decreasing f , we can imme-
(a)
(b)
(c)
(d)
Figure 3: Mixing cohesive and non-cohesive materials. The containers are about 1/3 full and slowly rotated. (a) and (c) are initial conditions with the material on the right being cohesive and the material on the left being non-cohesive. (b) and (d) show the results after 2 container revolutions. Streaks of material appear in both cases but the streaking is more pronounced with the cohesive component. In the cohesive case these streaks seem to act as \lubricating" layers and the mixing rate for (d) is about 5% higher than (b). diately deduce that mixing is fastest for lower f . Wedge intersections disappear at f = 1=2, so the mixing rate attains a minimum. Above half-full a non-mixing \core" region emerges which avalanches never enter. Material initially in the core does not participate in mixing; however, the material around the core mixes faster as f increases because wedge intersections re-emerge above core onset. For quantitative comparisons we track the positions of the colored particles' centroids normalized to the centroid of the whole material. Figure 2.1a shows data as a function of time for one centroid's orbit. Disk rotation casues the orbits to oscillate, whereas the iterative avalanche causes the orbits to decay exponentially. The decay time-constant , shown in gure 2.1b as a function of f , de nes a mixing rate. The experiments and simulations well con rm the geometric predictions. With a mixing rate, we may also measure a mixing e�ciency and nd the optimum operating point. The volume of material mixed is V (f ), where V is the volume of the disk; and, we take V (f = 1) = 1. The optimum maximizes � � V (f ) the volume mixed per characteristic time ( gure 2.1b). For less symmetric containers the argument relating f to core onset is more complicated and depends on both f and the container's center of mass [10, 12]. Mixing e�ciency also increases for less symmetric containers, e.g. the maximum e�ciency in a triangle is almost 10% higher than that for the circle. The triangle mixes more e�ciently than the standard circle found in industry. For all containers with similar particles geometrical e�ects dominate the mixing behavior.
2.2 Added complexity: ba�es, cohesion, and segregation
The experimental and modeling ease of 2-d tumbling devices make them useful testbeds for adding realistic complications in a controlled way. In this section we brie y outline some e�ects from the inclusion of ba�es, cohesive forces between the particles, and segregation due to particle size and density di�erences. Ba�es are often installed in solids tumblers. In slowly rotating containers an even number of uniformly spaced outwardly or inwardly protruding ba�es have no e�ect on the core. However, an odd number of uniformly spaced, outwardly protruding ba�es|or any number of non-uniformly spaced ba�es|mix the
(a)
(b)
(c)
Figure 4: Pattern precession outside the core during tumbling with segregating materials: (a) after 3 container revolutions; (b) after 4; (c) after 5. The layered pattern precesses ahead about 60� /container revolution. Aside from the precession this pattern is statistically stationary. core with the rest of the material. This happens by secondary avalanches in the ba�es. Secondary avalanches occur when the ba�e creates a void in the ow. Typically this void is sustained by arching. As the mixer rotates, the arch eventually collapses, causing a downward shift of material. A part of the core about equal to the volume of the void is pushed into the mixing zone and is sheared o�. Containers with uniformly spaced, even numbers of ba�es do not erode cores because each shift by a secondary avalanche in one direction is paired with a shift in the opposite direction: the core is smaller than without ba�es but remains intact [10]. Figure 3 shows initial conditions and one e�ect of mixing with a cohesive component. The top row shows the results after 2 revolutions for both non-cohesive particles di�ering only in color. In the bottom row the particles on the left are non-cohesive while the particles on the right are cohesive; particles are identical otherwise. One di�erence of cohesion is that the material surface is no longer at during the initial stages of mixing. Also, streaks appear in both cases but the streaking is more pronounced with the cohesive component. With the cohesive component these streaks appear when the non-cohesive particles avalanche from beneath the cohesive particles. When the properties of a collection of grains are distributed across a range of values (the typical case), the grains may segregate as they move instead of mixing. Figure 4 shows an example of radial segregation where the larger particles move to the outside of the container and form a layered rotating pattern. While the geometrical approach yields valuable insight into the mixing of granular materials|the core is a promenent feature of gure 4 irrespective of the material properties|this technique fails to capture segregation due to particle di�erences. To capture this behavior with the model, we would need to have the correct rearrangement rule. Hybrid models [10] combinging the geometric spirit with a particle dynamics simulation of the avalanche, though, can capture many of the large-scale features in gure 4.
2.3 Material dependent e�ects and computational challenges
While gure 4 shows a precessing segregation pattern, there is a subtler precessing motion of the core illustrated in gure 5. In the model of x2.1, the core has a purely geometrical origin, implying the core should appear and not move no matter the material. However, gure 5 shows that the core does move|and at a rate that is material dependent. After every full revolution of the container, the line demarking the initial interface between the colored grains should return to its original orientation. However, for a large number of revolutions the line rotates past its original position. There are three things to note regarding core precession. (1) Precession depends on the container shape. Precession happens in containers of about equal width to height ratios. (2) The precession rate, i.e. how many degrees the core precesses per container revolution �_p depends on the ll level f |the rate is highest just above half full and falls to zero for a completely full container. (3) The precession rate depends on the material being mixed. There is an order of magnitude di�erence in �_p between small, cubic salt cubes and larger, spherical sugar balls. The physical mechanism driving core precession is at present obscure, but, since the precession rate depends on the material, core precession is an e�ect that does not seem explainable from geometry alone. Note that these patterns and their motions are not in and of themselves important for industrial processes. However, they are important as validating tests for the computational models of granular process design. To my knowledge no granular computation reports this very noticible macroscopic motion, possibly because there is essential physics missing from the computational models. What the missing physics might be is
(a)
(b)
(c)
Figure 5: Core precession with di�erent materials. After 20 container revolutions, the core precesses through an angle �p . As the precession rate �_p is material dependent, the cores shown precess di�erent amounts. An equal volume mix of (a) sugar balls and salt cubes, (b) 3 mm diameter sugar balls, and (c) coarse sugar (rotated about 60� past its stop point and rotated back for this picture).
(a)
(b)
(c)
(d)
Figure 6: Mixing with and without segregation e�ects. 5 slices from experiments uniformly initialized along the tube axis, all after 8 revolutions of the tube. (a) Particles of same size and density mix. (b) Particles of similar size and di�erent density segregate. (c) Particles of di�erent size and di�erent density can in some cases mix due to cancelation of the segregation forces. (d) Reverse the sense of one of the segregation mechanisms in (c) to get the strongest segregation. addressed elsewhere in this conference (Li�man's paper).
3 A VIEW OF 3-D TUMBLERS In this section we report MRI experiments of 3-d granular mixing in a slowly rotating tube [11]. Being non-invasive, MRI techniques are well-suited for the study of granular ows. Normally solids cannot be imaged with MRI, but many seeds contain natural oils giving a good signal [13]. Along with other noninvasive imaging techniques being developed [14], experiments seem on the verge of providing a wealth of new information on 3-d granular ows. Figure 6 shows radial segregation experiments with particles of di�erent size ratio s and density ratio d. The gure shows 5 of 128 total slices perpendicular to the tube axis. Figure 6a shows mixing with no segregation (s = 1:1 � 0:2; d = 0:8 � 0:2) in a tube 3/4 full. After 8 revolutions, grains are well-mixed throughout the tube. Segregation forces arise from size and density di�erences of the grains. For similar
densities and di�erent sizes, larger particles segregate to the outside of a tumbling container ( gure 4). Figure 6b shows density segregation with similar sizes and di�erent densities ( s = 1:1�0:2; d = 1:4�0:2). The denser particles collect in the center of the container (seen as voidage). Figure 6c (s = 1:4 � 0:2; d = 1:4 � 0:2) shows a surprising outcome when both size and density segregation forces operate at the same time, which is the typical case. Density segregation tends to move the denser particles to the inside of the container; size segregation tends to move the larger particles to the outside. The end result is that the segregation forces approximately cancel, giving good mixing where it would not normally be expected. This suggests there is a line in the d{s plane where mixing is always good. In contrast to gure 6c gure 6d shows the same density ratio but with s = 0:8 � 0:1. Now size segregation reinforces density segregation, with the result that we have the most strongly segregating mixture of all. The elimination of the stationary 2-dimensional segregation patterns from 3-dimensional ows seems to be due to the addition of axial motions. Note the implication segregation has for a mixing measure. If particle concentration were measured in a coarse-grained way by averaging over slices, such measurements would not distinguish between any of gure 6. Identifying the mixing patterns along with any coarse-grained measures of mixing rate is also important.
4 FUTURE DIRECTIONS Recent studies of granular ow and mixing raise a host of questions with combined technological and scienti c import, e.g. what are the detailed segregation mechanisms in a device for given particle characteristics; what are strategies for suppressing or enhancing segregation; are there granular manifolds and mixing templates analogous to those so important in uid mixing; what are the mixing patterns and rates in commercial mixers? A goal of these and future experiments is to measure granular transport systems in enough detail to answer some of these questions, leading hopefully to greater predictive facility and a deeper level of physical understanding of the ow of granular materials.
References [1] [2] [3] [4] [5] [6] [7] [8]
Guazzelli, E. & Oger, L., eds. Mobile Particulate Systems 1996 Kluwer. Ottino, J.M. The Kinematics of Mixing: Stretching, Chaos, and Transport 1989 Cambridge Press. Lacey, P.M. Developments in the Theory of Particle Mixing 1954 J. Appl. Chem. 4 257-268. Bridgwater, J. Fundamental Powder Mixing Mechanisms 1976 Pow. Tech. 15 215-235. Fan, L.T., Chen, Y., and Lai, F.S. Recent Developments in Solids Mixing 1990 Pow. Tech. 61 255-277. Mehta A., ed., Granular Matter: An Interdisciplinary Approach 1994 Springer. Behringer, R.P. The Dynamics of Flowing Sand 1993 Nonlin. Sci. Today 3 1{10. Jaeger, H.M., Knight, J.B., Liu, C. & Nagel, S.R. What is Shaking in the Sandbox 1994 MRS Bull. 14 25{31. [9]� Metcalfe, G., Shinbrot, T., McCarthy, J.J. & Ottino, J.M. Avalanche Mixing of Granular Solids Nature 1995 374 39{41. [10] McCarthy, J., Wolf, E., Shinbrot, T., Metcalfe, G., & Ottino, J.M. Mixing of Granular Materials in Slowly Rotated Containers 1996 accepted to AIChEJ. [11]� Metcalfe G., & Shattuck M. Pattern Formation during Mixing and Segregation of Flowing Granular Materials 1996 accepted to Physica A. [12] Wolf, E. Geometrical Aspects of Granular Solids Mixing M.S. thesis, 1995, Northwestern University. [13] Nakagawa, M., Altobelli, S.A., Caprihan, A., Fukushima, E., and Jeong, E.K. Non-invasive Measurements of Granular Flows by Magnetic Resonance Imaging Expr. Fluids 1993 16 54-60. [14] Broadbelt, C.J., Bridgwater, J., Parker, D.J., Keningley, S.T., and Knight, P. Phenomenological Study of a Batch Mixer Using a Positron Camera 1993 Pow. Tech. 76 317-325; M. Nikitidis, U. Tuzun, and N.M. Spyrou 1994 KONA Powder and Particle 12 43{56. � available online at http://fluids.mel.dbce.csiro.au/~guy/papers