challenges Article
Expert System for Bomb Factory Detection by Networks of Advance Sensors Carlotta Ferrari 1 , Alessandro Ulrici 2 and Francesco Saverio Romolo 1,3, * 1 2 3
*
Institut de Police Scientifique (IPS), Université de Lausanne, Dorigny, 1004 Lausanne, Switzerland;
[email protected] Department of Life Sciences, University of Modena and Reggio Emilia, Via Amendola, 2, 42122 Reggio Emilia, Italy;
[email protected] Legal Medicine Section, Department Saimlal, Sapienza Università di Roma, Viale Regina Elena, 336, 00161 Rome, Italy Correspondence:
[email protected]; Tel.: +39-06-4991-2581
Academic Editor: Palmiro Poltronieri Received: 31 October 2016; Accepted: 26 December 2016; Published: 3 January 2017
Abstract: (1) Background: Police forces and security administrations are nowadays considering Improvised explosives (IEs) as a major threat. The chemical substances used to prepare IEs are called precursors, and their presence could allow police forces to locate a bomb factory where the on-going manufacturing of IEs is carried out. (2) Methods: An expert system was developed and tested in handling signals from a network of sensors, allowing an early warning. The expert system allows the detection of one precursor based on the signal provided by a single sensor, the detection of one precursor based on the signal provided by more than one sensor, and the production of a global alarm level based on data fusion from all the sensors of the network. (3) Results: The expert system was tested in the Italian Air Force base of Pratica di Mare (Italy) and in the Swedish Defence Research Agency (FOI) in Grindsjön (Sweden). (4) Conclusion: The performance of the expert system was successfully evaluated under relevant environmental conditions. The approach used in the development of the expert system allows maximum flexibility in terms of integration of the response provided by any sensor, allowing to easily include in the network all possible new sensors. Keywords: improvised explosive; precursor; network; chemometrics; security; forensic science
1. Introduction The behaviour of terrorists using explosives changed in last decade of bombings: improvised explosives (IEs) produced with chemical substances available on the market substituted commercial and military explosives [1–4]. The chemical substances used in home-made preparations of IEs are called precursors. The European Parliament and the Council adopted the Regulation (EU) No. 98/2013 on the marketing and use of explosives precursors on 15 January 2014 [5]. According to this regulation, seven precursors shall not be available to the general public anymore in concentrations greater than their limit values listed in Table 1 and other precursors, listed in Table 2, will be monitored to report suspicious transactions when purchased by the public. The traces of precursors used in IEs production (particulates, vapours and/or waterborne) present in the environment surrounding the vicinity of a “bomb factory” could allow police forces to locate sites, where the on-going manufacturing of IEs is suspected. This approach for protecting citizens from bombings is expected to be more effective than simply patrolling a possible target, because the production time of IEs is much longer than the time needed to transport an improvised explosive device (IED) close to the target from the manufacturing site [6]. Between 2009 and 2011, the LOTUS project developed sensors to detect precursors of both drugs of abuse and IEs in the
Challenges 2017, 8, 1; doi:10.3390/challe8010001
www.mdpi.com/journal/challenges
Challenges 2017, 8, 1
2 of 18
environment. Another project, called “Bomb factory detection by Networks of Advanced Sensors” (BONAS) [7], recently studied a network of wireless sensors to detect precursors of IEs outside explosives manufacturing sites. Results from the BONAS project about the analysis of the precursor hydrogen peroxide have been recently published [8]. The different sensors of the BONAS project were specifically designed to be deployed in sensitive locations and easily camouflaged. This network allows an early threat alarm thanks to an expert system, which is a system allowing the detection of one precursor based on the signal provided by a single sensor, the detection of one precursor based on the signal provided by more than one sensor, and the production of a global alarm level based on data fusion from all the sensors of the network. The aim of the present work is to show how the expert system was successfully developed and tested to play its key role in protecting the security of citizens. Table 1. Precursors listed in the Annex I of the European Parliament and the Council adopted the Regulation (EU) No. 98/2013 on the marketing and use of explosives precursors on 15 January 2014 [5], which are available to the public only in limited concentration and in Annex II the eight substances that are required to be reported as suspicious transactions when purchased by the public.
1 2 3 4 5 6 7
ANNEX I Regulated Substance
Limit Value (w/w)
Hydrogen peroxide Nitromethane Nitric acid Potassium chlorate Potassium perchlorate Sodium chlorate Sodium perchlorate
12% 30% 3% 40% 40% 40% 40%
Table 2. Precursors listed in the Annex II of the European Parliament and the Council adopted the Regulation (EU) No. 98/2013 on the marketing and use of explosives precursors on 15 January 2014 [5], which are required to be reported as suspicious transactions when purchased by the public. ANNEX II Regulated Substance 1 2 3 4 5 6 7 8
Hexamine Sulphuric acid Acetone Potassium nitrate Sodium nitrate Calcium nitrate Calcium ammonium nitrate Ammonium nitrate (in concentration of 16 % by weight of nitrogen in relation to ammonium nitrate or higher)
2. Expert System for Advanced Sensors Network Data Analysis Sensors Network Expert System Overview The BONAS expert system was aimed to perform pattern recognition of the data collected by each network sensor, estimating the predicted probability of detection for each target. The system was then designed to integrate the responses from each sensor to provide the end-user with a global alarm level, summarizing information from the entire network into a unique evaluation of the possible criminal threat of an IE production site. Sensors able to detect explosives were considered for inclusion in the network too. The expert system follows a three step workflow while providing a real time response for any new measurement: 1.
The first step is estimating the predicted probability of the presence of each target for each sensor included in the BONAS network. The classification models adopted are computed by means of
Challenges 2017, 8, 1 Challenges 2017, 8, 1
1.
2. 2.
3. 3.
3 of 19 3 of 18
The first step is estimating the predicted probability of the presence of each target for each sensor included in the BONAS network. The classification models adopted are computed by means of a pattern recognition technique on a dataset of experimental data acquired from laboratory and a pattern recognition technique on a dataset of experimental data acquired from laboratory and field conditions. These classification models are then applied to any new data received to obtain field conditions. These classification models are then applied to any new data received to obtain the corresponding predicted probability value. the corresponding predicted probability value. The expert system integrates the output given from multiple sensors measuring the same target The expert system integrates the output given from multiple sensors measuring the same target to provide the user with a unique alarm value for each compound. In this context, sensor location to provide the user with a unique alarm value for each compound. In this context, sensor location is also considered and only output from sensors located within a user-defined distance range are is also considered and only output from sensors located within a user-defined distance range integrated, giving a positive detection within a reasonable time delay. are integrated, giving a positive detection within a reasonable time delay. At the last step, the output from the previous steps is further integrated to provide the user At the last step, the output from the previous steps is further integrated to provide the user with with a defined global alarm. This alarm can be triggered by the detection of a single explosive a defined global alarm. This alarm can be triggered by the detection of a single explosive compound, such as trinitrotoluene (TNT) or RDX, because these substances are generally forbidden compound, such as trinitrotoluene (TNT) or RDX, because these substances are generally to the general public. When precursors are detected, the alarm value is triggered when specific forbidden to the general public. When precursors are detected, the alarm value is triggered when couples of targets defined by the user are detected from sensors located within a user-defined specific couples of targets defined by the user are detected from sensors located within a userdistance range and giving a positive detection within a reasonable time delay. defined distance range and giving a positive detection within a reasonable time delay.
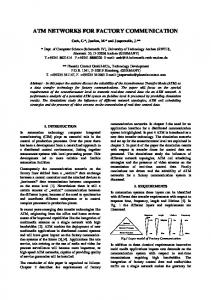
A compact representation of the information provided by the expert system is shown in the A compact representation of the information provided by the expert system is shown in the dedicated user interface developed in collaboration with TEKEVER [7]. A schematic representation of dedicated user interface developed in collaboration with TEKEVER [7]. A schematic representation the three step approach developed for the BONAS expert system is shown in Figure 1. of the three step approach developed for the BONAS expert system is shown in Figure 1.
Figure 1. of of thethe three-step approach developed for thefor BONAS expert system. Figure 1. Schematic Schematicrepresentation representation three-step approach developed the BONAS expert The alarms due to individual targets are provided as output of Step 2 while the global alarm level is system. The alarms due to individual targets are provided as output of Step 2 while the global alarm obtained as output of Step 3. level is obtained as output of Step 3.
Challenges 2017, 8, 1
4 of 18
3. Materials and Methods 3.1. Advanced Sensors Network and IE Precursors The BONAS project developed a network of advanced sensors able to detect traces of precursors used in IEs’ production present in the environment surrounding the vicinity of a “bomb factory”. Sensors based on a wide range of analytical methods were selected in order to enable the detection of precursors in different forms, i.e., particulates, vapours and/or waterborne. The sensors developed and tested throughout the project include a quartz-enhanced photo-acoustic spectroscopy (QEPAS) sensor, an electrochemical (EC) sensor, a light detection and ranging (LIDAR)/differential absorption LIDAR detection system (DIAL) sensor, and a surface-enhanced Raman spectroscopy (SERS) sensor. The substances considered in the project were selected among the IE precursors taken into account by the Regulation (EU) No. 98/2013 on the marketing and use of explosive precursors. Overall, classification models for the classification of five precursors with different forms were computed. These precursors are listed in Table 3 as codes, because their names are Confidential EU. Table 3. Precursors considered as targets of the different sensors included in the network. Sensor
Precursor Code
Precursor Form
QEPAS
B02 B10
Vapor Vapor
EC
B01 B08 B15
Waterborne Waterborne Waterborne
LIDAR
B02 B10
Vapor Vapor
SERS
B15
Particulate
Three key requirements were identified in the development of the present expert system: (i) minimization of false positive detections at sensor level (described in Section 3.2); (ii) flexibility of the system in terms of type and number of sensors included at any time in the network (described in Section 3.3); (iii) flexibility of the system in terms of choice of the parameters that determine the global alarm activation (described in Section 3.4), in order to allow the user to easily customize the system according to the condition-specific needs. All data analysis were performed using the PLS Toolbox ver. 7.5 and ver. 7.8.2 (Eigenvector Research Inc., Manson, WA, USA) and all routines were written in Matlab© platform 7.11 R2010b (The Mathworks Inc., Natick, MA, USA). 3.2. STEP 1: Supervised Pattern Recognition at Sensor Level At the first step, the expert system is requested to estimate the predicted probability of presence of each target for each sensor included in the sensor network. To this aim, different classification rules were chosen, based on the nature of the sensor data. In particular, for QEPAS and EC, Partial Least Squares-Discriminant Analysis (PLS-DA) [9] models were developed using experimental data acquired from laboratory and field conditions. The PLS-DA classification models were validated by means of an external test set, and their performance was evaluated on the basis of the following parameters:
• • •
sensitivity (SENS): the percentage of objects of each modelled class correctly accepted by the class model; specificity (SPEC): the percentage of objects of the other classes correctly rejected by the class model; efficiency (EFF): the geometric mean of sensitivity and specificity.
Challenges 2017, 8, 1 Challenges 2017, 8, 1
5 of 19 5 of 18
Once the optimal model for each target substance has been selected, for any new measurement the probability of the presence of the different target substances can be computed and stored. An Once the optimal model for each target substance has been selected, for any new measurement the alarm is then triggered if this value exceeds the corresponding probability threshold. In order to probability of the presence of the different target substances can be computed and stored. An alarm is better exploit the collected analytical information, two different thresholds are considered: then triggered if this value exceeds the corresponding probability threshold. In order to better exploit collected a lower analytical threshold information, (maxeff_thresh): thresholdare which provides the best compromise the two probability different thresholds considered: between false positive and false negative results; • aa lower probability threshold which provides theto best compromise higherthreshold threshold(maxeff_thresh): (maxspec_thresh): probability threshold which allows minimize false between false positive and false negative results; positive results. • a higher threshold (maxspec_thresh): probability threshold which allows to minimize false Following the double threshold approach, two different alarm levels are considered: a lower positive results. alarm level is provided when the predicted probability exceeds the value of maxeff_thresh but is lowerFollowing than maxspec_thresh, becauseapproach, it means two that different the predicted value is below the the double threshold alarmprobability levels are considered: a lower threshold that minimizes the false positive results, while a higher level alarm is given when the alarm level is provided when the predicted probability exceeds the value of maxeff_thresh but is lower predicted probability because exceeds it the valuethat of maxspec_thresh as well. value is below the threshold that than maxspec_thresh, means the predicted probability In thethe case of the SERSresults, sensor,while a simpler classification was used, on the correlation minimizes false positive a higher level alarmrule is given when based the predicted probability coefficient between the signal measured on the sample and the corresponding signal measured on exceeds the value of maxspec_thresh as well. the pure target. LIDAR sensor, classification it provided a concentration ofon thethe precursor B10 In the case Concerning of the SERSthe sensor, a simpler rule was used,value based correlation [7]. coefficient between the signal measured on the sample and the corresponding signal measured on the addition to the display of thesensor, detected target names and of the obtained probability pure In target. Concerning the LIDAR it provided a concentration value of predicted the precursor B10 [7]. values, a simpletocolour-based has beentarget implemented toofsummarize this information in the In addition the display ofcode the detected names and the obtained predicted probability expert system human interface and facilitate the interpretation of results. In particular, a green bar is values, a simple colour-based code has been implemented to summarize this information in the expert used to human indicateinterface that no detection has the occurred while a blue or yellow bar is displayed lower system and facilitate interpretation of results. In particular, a green when bar is aused to or higherthat alarm has been has triggered, respectively. Aor numeric 1, 2 andwhen 3 has abeen assigned to indicate no detection occurred while a blue yellow value bar is of displayed lower or higher green,has bluebeen andtriggered, yellow colour codes, respectively (Tableof4).1, 2 and 3 has been assigned to green, blue alarm respectively. A numeric value and yellow colour codes, respectively (Table 4). Table 4. Interpretation of the colour code used for the output of the expert system after the Step 1. Table 4. Interpretation of the colour code used for the output of the expert system after the Step 1.
Colour Code
Colour Code
Grey
Grey
Green Green Blue Blue Yellow
Yellow
Interpretation The target substance is not monitored by any Interpretation of the sensors included at that moment in the The target substance is not monitored by any of the network. sensors included at that moment in the network. target substance be detected by the TheThe target substance can becan detected by the network butatisthat notmoment. detect at that moment. butnetwork is not detect TheThe target substance is detected by the by sensor the target substance is detected the at sensor lower threshold. at the lower threshold. The target substance is detected by the sensor at the Thethreshold. target substance is detected by the sensor higher at the higher threshold.
Associated Value Associated Value
0
0 11 22 3
3
A of the used in in the A schematic schematic overview overview of the approach approach used the first first step step of of the the expert expert system system is is provided provided in in Figure 2. Figure 2.
Figure 2. Scheme of of the the expert expert system system step step for for pattern pattern recognition Figure 2. Scheme recognition at at sensor sensor level. level.
colourcode codeobtained obtainedbyby each sensor target substance thisisstep is stored in a The colour each sensor for for eacheach target substance at thisatstep stored in a matrix, matrix,iswhich to the of function of the second of system. the expert system. this way, this which passedistopassed the function the second step of thestep expert In this way,In this information information can then be integrated with thatsensors of the other ofand the anetwork a unique can then be integrated with that of the other of thesensors network unique and alarm level foralarm each level for each target canprovided be therefore provided to the end-user. target substance can substance be therefore to the end-user.
Challenges 2017, 8, 1
6 of 18
3.2.1. QEPAS Sensor For the BONAS project, the CREO team developed a QEPAS sensor allowing IR analysis of vapour [10]. At the first step, a database of experimental signals was created in order to calculate the PLS-DA classification model at the basis of the developed expert system. In order to obtain a representative spectra database, signals were acquired both in laboratory and on field conditions. In particular, a laboratory dataset was created in laboratory by acquiring spectra of four target substances, i.e., B01, B02, B03 and B10 and four interferents, i.e., Int02, Int05, Int10 and Int11 at two different concentration levels have been acquired. In order to evaluate the reproducibility of the system, at least two samples (replicates) of each substance at each concentration were considered. The laboratory spectra database was initially investigated by means of Principal Component Analysis (PCA) considering several data pre-treatments (data not shown for conciseness reasons). The results of this explorative analysis suggested focusing on two main target molecules, i.e., B02 e B10. Considering that the QEPAS sensor is able to analyze vapors, the database was then updated with data acquired during on-field tests carried out according to realistic IE preparation scenarios. During this test campaign, two target substances included in the priority list for BONAS and one interferent were tested, i.e., target B02, target B10 and Int10. The composition of the updated datasets used for classification model computation of both target B02 and target B10 are reported in Table 5. Table 5. Composition of the QEPAS dataset for target B02 and target B10 classification model computation. Target
Class
# Spectra Training Set
# Spectra Test Set
Total Number of Spectra
B02
Class TARGET B02 Class NO TARGET B02
139 340
90 363
229 703
B10
Class TARGET B10 Class NO TARGET B10
94 385
59 395
153 780
Subsequently, these datasets have been used to compute the classification models for the two targets and the selected classification model was then used to analyze the data acquired during on field tests carried out in realistic scenarios. 3.2.2. EC Sensor For the BONAS project, the UCBL team [7] developed an electrochemical sensor dedicated to the achievement of simultaneous monitoring of different explosive precursors. The BONAS EC sensor uses electrodes to oxidize or reduce molecules soluble in water using portable electrodes, easily hidden in the sewage system, operating stand-alone by battery, with wireless communication capability. The electrochemical chips used for the acquisition of the database signals were of one counter electrode, one pseudo-reference electrode and eight working electrodes. These electrodes were divided into two series of four electrodes each; in each series, three electrodes were modified with different electrodeposited metals (gold, palladium and platinum), resulting in four voltammograms per analysis. In addition to the analysis of the individual signals of the different electrode surfaces, another approach based on the creation of a unique signature for each sample was applied so as to take full advantage of the information provided by the different electrodes on the same sample. To this aim, the signals acquired with the four electrode surfaces were merged together as a sequence and each block of data then was scaled to unit variance, in order to assign equal importance to information provided by the different electrodes. A schematic representation of this approach is shown in Figure 3.
Challenges 2017, Challenges 2017, 8, 18, 1
7 of7 19 of 18
Figure 3. Electrochemical data analysis approach. Figure 3. Electrochemical data analysis approach.
In addition to the three main target substances analysed by this sensor, i.e., B01, B08 and B15, data In addition to the three main target substances analysed by this sensor, i.e., B01, B08 and B15, were acquired also on additional target substances, i.e., B04, B05 and B11, and on the interferent Int09, data were acquired also on additional target substances, i.e., B04, B05 and B11, and on the interferent selected as components of common cleaning products. The measurements were realized in: (i) NaCl Int09, selected as components of common cleaning products. The measurements were realized in: (i) 0.1NaCl M electrolyte solution; (ii) tap drinking water; water, (iii) tap(iii) non-drinkable waterwater (iv) soap water (GEH 0.1 M electrolyte solution, (ii) tap drinking tap non-drinkable iv) soap water dish washing soap 0.1% v/v in tap drinking water) and (v) artificial sewage water prepared, using (GEH dish washing soap 0.1% v/v in tap drinking water) and (iv) artificial sewage water prepared,tap drinking water. The composition of the dataset for theused calculation the PLS-DA classification using tap drinking water. The composition of used the dataset for the of calculation of the PLS-DA models of target B01, target B08 and target B15 is reported in Table 6. classification models of target B01, target B08 and target B15 is reported in Table 6. Table 6. Composition to compute computeand andvalidate validatethe theclassification classification Table 6. Compositionofofthe thetraining trainingset setand and test test set set used used to models of of thethe ECEC sensor. models sensor. Target
Target
Class
Class
# Spectra Training # Spectra Test # Spectra Training # Spectra Test Set/Electrode Set/Electrode Set/Electrode Set/Electrode 25 11
Class TARGET B01 Class TARGET B01 Class NO TARGET B01 Class NO TARGET B01187 B01 Class TARGET B08 33 Class TARGET B08 B08 B08 Class NO TARGET Class NO TARGET B08179 B08 Class TARGET B15 B15 B15 Class TARGET B15 33 B01
Class NO TARGET B15
25 187 33 179 33 179
122 22 111 21
Total Number of
Total Number of Spectra/Electrode Spectra/Electrode 36
11 122
36 309 309
22 111
55 55 290 290
21 112
54 54 291
Challenges 2017, 8, 1
8 of 18
Similarly to the QEPAS sensor, also in this case these datasets have been used for the computation of classification models to be applied on the data acquired during on field tests carried out in realistic scenarios. 3.2.3. SERS Sensor For the BONAS project, the Serstech team [7] developed a SERS based sensor, used for detecting particles and/or vapours in the air surrounding a potential IED factory. Briefly, the sensor system consists of a miniaturized Raman spectrometer in combination with a sampling system for collecting particles and/or vapours from the surrounding air. The sampling system collects air through an inlet fan and directs this to a cooled SERS-surface were particles are trapped onto the surface. The SERS-substrate is then dried by heating and placed in position for measurement by the Raman spectrometer. The resulting spectral information is transferred to the command centre for data analysis. In order to test the possibility to successfully integrate this sensor in the expert system, a very preliminary data analysis approach was applied during the on field test campaign. The approach was based on the calculation of the linear correlation coefficient (R) between any new acquired spectrum and a reference spectrum, after having applied a pre-processing step by means of linear detrend in order to remove baseline shifts. Furthermore, on the basis of a meeting with the specialists in charge of the sensor, only the data in spectral range between 812 and 880 nm have been considered for data analysis. For alarm triggering, it was set a criteria of correlation coefficient above a threshold of 0.8 with a significance level of 0.05. 3.2.4. Lidar/DIAL Remote Sensor For the BONAS project, the ENEA [7] and CSM teams [7] developed a lidar/DIAL remote sensor. As far it is concerned, no pattern recognition analysis has been required, since the sensor output is not provided as raw data or signals but directly as target B10 concentration values. In this case, therefore, the expert system just compares the concentration value in output with a concentration threshold defined experimentally that can be easily modified by the user. This information is then integrated with the response of the other sensors during the second step of the expert system in order to trigger an alarm. In order to take into account the limited selectivity of the sensor response, at this step the concentration values obtained for target B10 were also converted to equivalent concentration values of the other target substance the sensor can detect, i.e., target B02 . This is achieved by applying a correction factor defined according of the optical absorption characteristic of target B02. Therefore, whenever lidar/DIAL remote sensor has a positive detection, alarms are triggered for all the target substances it can detect (i.e., B10 and B02). However, this aspect is considered at the second step of the expert system and, when other sensors confirm the detection of only one of the lidar/DIAL target substances, the alarms triggered for the other one is set back to “no detection”. 3.3. STEP 2: High-Level Data Fusion for Single Target Substance Detection At the second step, the expert system is requested to integrate the output given from multiple sensors measuring the same target to provide the user with a unique alarm value for each compound. Over the years, a considerable number of data fusion methods have been developed, which can be roughly subdivided into three different levels as follows [11]:
• • •
low-level fusion, where the raw signals provided by the different sensors are combined before performing any data pre-processing; mid-level fusion, which is based on the combination of features extracted from the data of each sensor; high-level fusion, where the response of the different sensors (e.g., detection decision) are combined to obtain a unique response.
Challenges 2017, 8, 1
9 of 18
Considering the need of having a flexible expert system able to include any new sensor as well as to consider the possibility of temporary inactivity (e.g., battery drained waiting for replacement) of some sensors, the high level data fusion approach has been selected to be used in the development of the expert system. In particular, high level data fusion was used at this stage to enable the expert system to integrate the information about the alarms triggered for the same target substance by all the sensors which are included at that moment in the network and which are able to detect it. To this aim, a dedicated routine was developed, which runs over all the target substances the sensors network is monitoring at that moment and it checks if any alarm has been triggered for each of them. If this is not the case, nothing happens and the green colour bar is displayed in the user interface. Similarly, when only one sensor is detecting that target substance, the same alarm level and the same color code given by that sensor is kept. Whenever more than one sensor detects the same target substance, the information about their relative distance is first considered. For this reason, the distances between the positions of all those sensors are computed and compared with the defined threshold of maximum distance. For the stand-off sensors, the coordinates of the actual sampling volume are computed and considered in the calculation of their relative distance to the other sensors. At this point, if all the sensors are closer to each other than the distance threshold, the final alarm level is calculated as a weighted sum of the alarm levels of the individual sensors. The alarm of each sensor is thus weighted according to the efficiency value of the model used at Step 1 for its definition so as to take into account also the ability of that model to correctly discriminate samples belonging or not to the target class. If this value is greater than 4 (orange colour code) then the alarm is set to the maximum level, i.e., 5, corresponding to a red colour code. The colour codes used to represent the Step 2 output in the human interface are summarized in Table 7. Table 7. Interpretation of the colour code used to represent the Step 2 output. Colour Code Grey Green Blue Yellow Orange Red
Interpretation The target substance is not monitored by any of the sensors included at that moment in the network. The target substance can be detected by the network but is not detect at that moment. The target substance is detected by the network at the lowest threshold by one sensor only. The target substance is detected by one sensor only at the highest threshold or by two sensors at the lower threshold. The target substance is detected by at least two sensors at the .higher threshold The target substance is detected by at least two sensors at the higher threshold.
Associated Value 0 1 2 3 4 5
It has to be underlined that the approach used in the development of the expert system allows maximum flexibility in terms of integration of the response provided by any sensor, even if not considered in the previous step of the expert system. This characteristic is particularly important since it allows to easily include in the network any possible new sensor by just communicating to the expert system the information about the code of the detected target substance, the concentration/probability measured, the concentration/probability threshold and its location. The flexibility of the expert system in easily integrating the response of sensors not considered at Step 1 has been successfully tested in the integration of the lidar/DIAL remote sensor response. 3.4. STEP 3: Data Fusion for Multiple Target Substances Detection At the last step, the expert system further integrates the outputs of Step 1 and Step 2 to provide the user with a unique evaluation of the possible criminal threat of an IE production site, defined
Challenges 2017, 8, 1
10 of 18
taking into account the information obtained from the entire network of sensors. The global alarm level provided as output of this third step, in fact, considers sensor location, the total number of detected targets as well as the detection of specific targets known to be used together to prepare a specific IE in a reasonably short time window. In this context, particular attention has been paid to the development of a system characterized by maximum flexibility in terms of choice of the parameters that determine the alarm activation, in order to allow the user to easily customize the system according to the condition-specific needs. This means that the end user can easily modify the conditions that define an alarm triggering event as well as the global alarm threshold used to indicate the presence of a possible threat. In the set up adopted, the global alarm ranges from 1 to 100 and the alarm threshold was set to 50. In case explosive compounds are being monitored by the sensors network, the detection of just one of them is considered as an alarm triggering event and the global alarm score is increased above the threshold according to its probability of detection. When only precursors are monitored, this threshold can be exceeded only in case specific couples of target substances are detected, while otherwise the alarm level is lower or equal to 50. The reason of this approach is to avoid an excessive number of false positives, because precursors can be used in legal activities. The first part of the score (from 1 to 50) is in fact just a weighed sum of the information provided by Step 2, where the weight to be given to each detected target substance is calculated according to the total number of target substances monitored at that time. The second part of the score (from 51 to 100) is instead defined according to the number of specific couples of target substances, which are being detected, and to their probability level of detection. The names of all the couples of target substances are displayed when detected together. We stress once again the point that the system has maximum flexibility and that therefore the final user, according to the specific needs, can easily implement different choices about the parameters, which define the alarm activation. The user can thus easily modify the list of individual targets whose detection determine the alarm initiation in order to include, for example, not only explosive compounds but also precursors of particular interest. Similarly, also the list of couples of targets substances can be updated without requiring any modification of the routine code. As mentioned above and similarly to what described in Step 2 (see Section 3), also in this context the information about the relative distance between sensors is taken into account before combining the information about couples of target substances, i.e., the alarm is raised above the threshold only if the sensors which have detected the couple of target substances are located within the distance threshold defined by the user. 4. Discussion The discussion of the results is organized in a first section (4.1), where we report about applying the PLS-DA classification models developed for the QEPAS and EC sensors to the relevant test set signals in laboratory conditions (Step 1), and a second section (4.2) where we discuss the results of the final validation in real scenario both at single sensor level (Step 1) and by the whole network of sensors (Step 2 and Step 3). 4.1. Validation of PLS-DA Classification Models in Laboratory Conditions With regards to QEPAS sensor, efficiency values in prediction equal to 98.13% and 100.00% were obtained for target B10 and target B02, respectively (see Table 8). Table 8. PLS-DA classification results obtained in prediction on QEPAS spectra acquired for models validation in laboratory conditions. B10 SENS 100.00
SPEC 96.30
B02 EFF 98.13
SENS 100.00
SPEC 100.00
EFF 100.00
Challenges 2017, 8, 1
11 of 18
The PLS-DA classification model for the EC sensor has been calculated for the three main targets, i.e., B01, B08 and B15, and the results obtained for the prediction of the test set samples are reported in Table 9. Table 9. PLS-DA classification results obtained in prediction on the EC signals acquired for models validation in laboratory conditions. B01 SENS 90.90
SPEC 100.00
B08 EFF 95.34
SENS 100.00
SPEC 99.10
B15 EFF 99.55
SENS 100.00
SPEC 100.00
EFF 100.00
4.2. Expert System Validation in a Real Case Scenario A final validation of the whole expert system structure was carried out during two demos of the project, one at the Italian Air Force base of Pratica di Mare (Italy) and one at the Swedish Defence Research Agency (FOI) in Grindsjön (Sweden). During this demo, real case scenario tests were in fact performed in order to verify the detection abilities of the individual sensors as well as the expert system ability to successfully integrate their response. No details related to test protocols followed during the demo are described as they are Confidential EU. 4.2.1. Validation of Pattern Recognition Models at Sensor Level Considering that these tests were carried out on field and in real case scenario, target concentrations were not constant during the whole test due to several factors such as weather conditions. It can be however noticed that positive detections were obtained during all the tests while no false positive detections occurred (Tables 10 and 11). As for the QEPAS sensor, three tests were performed for each of the two target substances, i.e., target B10 and target B02. During these trials, the QEPAS sensor was placed inside a dumpster used for camouflage and used to analyse vapours of IE precursors generated during an IE production (or the simulation of an IE production). The results are reported in terms of alarm colour codes triggered after Step 1 (please refer to Table 4 for colour code interpretation). Table 10. Results of the three tests performed at FOI for target B10. # Test
Test 1
Test 2
Test 3
# Measurement Cycle 1 2 3 4 5 1 2 3 4 1 2 3 4 5
Target B10 3 1 1 2 1 3 3 3 3 3 3 3 3 1
Target B02 1 1 1 1 1 1 1 1 1 1 1 1 1 1
As for the QEPAS sensor, also the capability of the electrochemical sensor to detect IE precursors directly in sewage water drains from simulated bomb factories has been performed during the final demonstration in Sweden. Three different scenarios have been tested in this context, each of them involving the use of one the three main targets at one step of an IE preparation. It has to be underlined
Challenges 2017, 8, 1 Challenges 2017, 8, 1
12 of 19 12 of 18
Table 11. Results of the three tests performed at FOI for target B02.
# Test
# Measurement Target B10 Target B02 1 1 3 that all the experiments performed during this test campaign were carried out using local 2 1 3 and a sink system found in loco (Figure 4). Test 4 3 1 3 4 1 3 Table 11. Results5of the three tests performed 1 at FOI for target B02. 3 1 1 1 2 1 B10 3 B02 # Test # Measurement Target Target Test 5 31 11 33 42 11 33 53 11 33 Test 4 14 11 33 25 11 31 31 11 13 Test 6 42 11 33 53 11 33 Test 5 64 11 31
5
1
tap water
3
As for the QEPAS sensor, also the sensor to detect IE precursors 1 capability of the electrochemical 1 3 1 1 2 directly in sewage water drains from simulated bomb factories has been performed during the final 3 3 demonstration in6Sweden. Three different scenarios have 1been tested in this context, each of them Test 4 1 3 involving the use of one the three main targets at one step of an IE preparation. It has to be underlined 5 1 3 that all the experiments performed 6during this test campaign local tap water 1 were carried out using 1 and a sink system found in loco (Figure 4).
Figure 4. 4. EC ECsensor sensor experimental set-up the final demonstration out at FOI experimental set-up used used duringduring the final demonstration carried outcarried at FOI (Grindsjön). (Grindsjön).
The results obtained by applying the final classification models (see Section 4.1) to the The results obtained by applying the final classification models (see Section 4.1) to the measurements acquired during the experiments performed in the final demonstration are shown measurements acquired during the experiments performed in the final demonstration are shown in in Table 12. Table 12. It can be noticed that true positive alarms were obtained for the target substances during all the tests. However, in some of the tests carried out on target B01, false positive alarms were obtained also Table 12. Results obtained for the EC sensor during the tests performed during the final for target B08. In order to investigate the reason for this anomalous behaviour not observed during demonstration at FOI. the laboratory test, EC signals acquired during the tests on target B01 were compared to the average AlarmB08. Colour Codeobserved that, despite the signals previously acquired in tap water on target B01 and target It was # Test Target signals acquired during the final demonstration typical features of the average B01 B01showed most of the B08 B15 signals, the intensity registered especially using the Pd and Pt electrodes was lower than usual and
Challenges 2017, 8, 1
13 of 18
more similar to the intensity registered in the presence of target B08. A possible explanation for this behaviour could be the degradation of the solution used during the tests due to the high instability of target B01. Furthermore, it has to be underlined that a more limited number of signals acquired in a lower number of experimental conditions was available for this target substance. For these reasons, a further training of the expert system with a larger number of samples, acquired, e.g., at lower concentrations, could allow for significant improvement of the expert system performance. Table 12. Results obtained for the EC sensor during the tests performed during the final demonstration at FOI.
# Test
Target
Test 1 Test 2 Test 3 Test 4 Test 5 Test 6 Test 7 Test 8 Test 9 Test 10 Test 11 Test 12 Test 13 Test 14 Test 15 Test 16 Test 17 Test 18 Test 19 Test 20
B15 B01 B08 B01 B15 B01 B15 Blank Blank B15 B08 Blank B15 B01 Blank B08 Blank B08 B08 Blank
Alarm Colour Code B01 1 3 1 3 1 3 1 1 1 1 1 1 1 3 1 1 1 1 1 1
B08 1 1 3 3 1 3 1 1 1 1 3 1 1 3 1 3 1 3 3 1
B15 3 1 1 1 3 1 3 1 1 3 1 1 3 1 1 1 1 1 1 1
As mentioned in Section 3.2, in the case of the SERS sensor, no pattern recognition was applied and the possibility to successfully integrate the sensor in the network was evaluated by triggering the alarm on the basis of the correlation coefficient value calculated between the signal measured on the sample and the corresponding signal measured on the pure target. During the final demo, four tests were performed by applying a real case scenario involving the use of Target B15. The spectra obtained during these tests are reported in Figure 5, where it can be observed that positive detections by the Raman spectrometer were obtained in all experiments. Despite that positive detections were observed in all experiments, the initiated alarms obtained from the analysis of the pretreated data (Table 13) show that false negative detections were also observed. In particular, the false alarm obtained for the Test 4 spectrum acquired was likely due to a slight misalignment of the main absorption peak. The application of different data pretreatment methods as well as of different data analysis approaches is expected to greatly help in solving this issue. In conclusion, the tests performed during the demo at FOI confirmed the capability of the SERS sensor in sampling particles from the atmosphere and successfully acquiring spectra on the collected analytical data. The promising results obtained suggest that the acquisition of a more representative database of experimental data could allow developing a more reliable and robust data analysis step as well as to extend the list of target substances for this sensor.
Challenges 2017, 8, 1 Challenges 2017, 8, 1
14 of 18
14 of 19
Figure bymeans meansofoflinear lineardetrend. detrend. Figure5.5.Raman Raman spectra spectra pretreated pretreated by Table 13. Results of the were analysis of the spectra pretreated bythe linear detrend. Despite that positive detections observed in all experiments, initiated alarms obtained from the analysis of the pretreated data (Table 13) show that false negative detections were also # Test Target Alarm Code acquired was likely due to a observed. In particular, the false alarm obtained for the TestColor 4 spectrum Test 1 B15 2 slight misalignment of the main absorption peak. The application of different data pretreatment Test 2 B15 1 methods as well as of different data analysis approaches is expected to greatly help in solving this 1 Test 5 B15 issue. Test 6 B15 2 Blank B15 1 Table 13. Results of the analysis of the spectra pretreated by linear detrend.
4.2.2. Validation of Expert System# Data Network Test Fusion Targetat Sensors Alarm Color CodeLevel Test 1 B15 2 In addition to validating the classification models developed for the individual sensors, Test 2 B15 1 an extensive validation of the capability of the expert system to effectively integrate the information Test 5 B15 1 provided by the different sensors has also been carried out during the two test campaigns at the Italian Test 6 B15 2 Air Force base of Pratica di Mare and in Sweden at FOI. Blank B15 1 During both test campaigns, the command and control (C2) centre has shown its ability to In conclusion, thethe tests performed during at FOI confirmed the by capability communicate with all sensors included in the thedemo network and to process, means of ofthe theSERS expert sensor the in sampling particles The fromlive the atmosphere and successfully acquiring spectra on the by collected system, data received. alarm monitor end-user application developed Tekever analytical data. Themonitoring promising results suggest that thebyacquisition a more representative allowed a real-time of the obtained information provided the expertofsystem. In fact, the user database of experimental data could allow developing a more reliable and robust data analysis step interface reports: as well as to extend the list of target substances for this sensor. • on the left, the alarm obtained for each target substance considering the information of all the 4.2.2. Validation Expert System Fusion at Sensors Network Level sensors able toofmonitor it (StepData 2 output); • in In theaddition middle, to thevalidating global alarm summarizes information the entiresensors, networkan into the which classification modelsthe developed for from the individual a unique evaluation possibleofcriminal threat of antoIEeffectively production site (Step output); extensive validation of of thethe capability the expert system integrate the3information by thea different sensors also been carried out sensors during the tworeported. test campaigns at thethe • provided on the right, map showing thehas location of the different is also To indicate Italian Air Force base of Pratica di Mare and in Sweden at FOI. sensors’ positions, markers coloured according to the colour code of Step 2 are used in order to During both test campaigns, the of command and control (C2) centre has shown its ability to show a possible positive detection the sensor; communicate with all the sensors included in the network and threshold to process,for bydata means of the expert • a circle with a radius equal to the value maximum distance integration is also system, the data received. The live alarm monitor end‐user application developed by Tekever reported for each sensor. allowed a real-time monitoring of the information provided by the expert system. In fact, the user interface In thisreports: way, the interface allows to monitor the data based on which sensors are integrated. As example, thealarm user interface during an experiment performed at FOI isofshown anon the left, the obtained obtained for each target substance considering the information all the in Figure 6. From theable interface, it can noticed that only one sensor is showing positive detections and sensors to monitor it be (Step 2 output); that two targets are being detected. The location of the sensor corresponded to the lidar/DIAL remote sensor, while the two detected targets were target B02 and target B10. The double detection provided
order to show a possible positive detection of the sensor; a circle with a radius equal to the value maximum distance threshold for data integration is also reported for each sensor.
In this way, the interface allows to monitor the data based on which sensors are integrated. As an example, the user interface obtained during an experiment performed at FOI is shown in Challenges 2017, 8, 1 15 of 18 Figure 6. From the interface, it can be noticed that only one sensor is showing positive detections and that two targets are being detected. The location of the sensor corresponded to the lidar/DIAL remote sensor, while detected targets were target B02two andtarget target B10. The double provided by the sensor is the duetwo to its limited selectivity. Since substances are detection being detected at the by the sensor is due to its limited selectivity. Since two target substances are being detected at the lower alarm level, a low global alarm level is provided as output of Step 3. lower alarm level, a low global alarm level is provided as output of Step 3.
Figure 6. User interface duringan anexperiment experiment performed performed atatFOI, shows thethe results for the Figure 6. User interface during FOI,which which shows results for two the two possible targets giving positive detection by Lidar. possible targets giving positive detection by Lidar.
Another example of a user interface obtained during the test campaign at FOI is shown in Figure a user interface the test campaign at FOI is showni.e., in Figure 7.Another In this example case, inofaddition to the obtained detection during described above, also another sensor, the 7. In this case, in addition to the detection described above, another sensor, i.e., the electrochemical electrochemical sensor, showed a positive detection foralso target B08 with a probability above the threshold which minimizes false positives (colour code yellow, probabilityabove of 100%). since sensor, showed a positive detection for target B08 with a probability theHowever, threshold which no couples of targets known to be used together in the preparation of IEs have been detected, the minimizes false positives (colour code yellow, probability of 100%). However, since no couples of global alarmtostill a low value. targets known be shows used together in the preparation of IEs have been detected, the global alarm still
shows a low2017, value. Challenges 8, 1
16 of 19
Figure 7. Example of user interface obtained during the test campaign at FOI, which shows the
Figure 7. Example of user interface obtained during the test campaign at FOI, which shows the positive positive detections for three targets obtained by two sensors. No couples of targets are known to be detections for three targets obtained by two sensors. No couples of targets are known to be used used together in the preparation of one IE. together in the preparation of one IE.
A third example of a user interface obtained during the test campaign at FOI is shown in Figure 8. It can be noticed that, as in the previous case, three target substances are being detected by two sensors. However, since target B02 and target B15 are one of the couples of targets known to be used together in the preparation of one IE, a much higher global alarm level is obtained in this case as output of Step 3.
Figure 7. Example of user interface obtained during the test campaign at FOI, which shows the positive for three targets obtained by two sensors. No couples of targets are known to be 16 of 18 Challenges 2017, 8,detections 1 used together in the preparation of one IE.
third exampleofofa auser userinterface interfaceobtained obtainedduring during the the test test campaign campaign at AA third example at FOI FOI is is shown shownin inFigure Figure 8. 8. Itbe can be noticed the previous substances are being detected bysensors. two It can noticed that, that, as in as theinprevious case, case, three three targettarget substances are being detected by two sensors. However, since target B02 and target B15 are one of the couples of targets known to be used However, since target B02 and target B15 are one of the couples of targets known to be used together in in theofpreparation of one IE, a global much alarm higherlevel global level obtained this case as 3. thetogether preparation one IE, a much higher is alarm obtained in is this case as in output of Step output of Step 3.
Figure Exampleofofaauser userinterface interface obtained obtained during shows thethe Figure 8. 8.Example duringthe thetest testcampaign campaignatatFOI, FOI,which which shows positive detections for three targets obtained by two sensors. Since a couple of target detected is positive detections for three targets obtained by two sensors. Since a couple of target detected is known known to be used together for the preparation of one IE, the global alarm has increased above the to be used together for the preparation of one IE, the global alarm has increased above the threshold threshold of 50. of 50.
Finally, we want to emphasize that during the final demonstration at the Swedish Defence Research Agency, also the sensors developed in another project (EMPHASIS) [12] were able to communicate with the BONAS Central Command Unit (CCU) in order to have their data processed by means of the BONAS expert system. In particular, the positive detections of the EMPHASIS sensors were successfully integrated in the second step of the BONAS expert system and did participate to determine both the individual target substance alarms and the global alarm of the sensor network. This test campaign, therefore, confirmed that the approach used in the development of the BONAS expert system allows maximum flexibility in terms of integration of the response provided by any sensor, even if not considered at the beginning of the expert system development. It is important to note that, despite the use of IR and Raman sensors, any positive detection produced by the network is not yet a forensic identification. To obtain a forensic identification of a chemical substance (e.g., the IE TATP) a suitable number of laboratory analyses must be carried out [13,14]. The capability to integrate the response any possible new sensor is the basis to establish a large network supporting safer smart cities, where many existing sensors can be networked in a grid allowing new elements of new types to collect information to be provided to the security authority [15]. 5. Conclusions This paper describes the innovative expert system approach developed in the BONAS research project to exploit the information provided by the whole sensor network and to provide the end-user with a unique global evaluation of the possible criminal threat of an IE production site. Three key requirements have been identified in the development of the present expert system: (i) minimization of false positive detections at the sensor level (developed within Step 1); (ii) flexibility
Challenges 2017, 8, 1
17 of 18
of the system in terms of type and number of sensors included at any time in the network (developed within Step 2); (iii) flexibility of the system in terms of choice of the parameters that determine the global alarm activation (developed within Step 3), in order to allow the user to easily customize the system according to the condition-specific needs. In order to meet these requirements, an expert system which follows a three-step workflow has been created. During the first step, the expert system estimates the predicted probability of presence of each target for each sensor included in the BONAS network. To this aim, classification models were computed by means of a PLS-DA algorithm with a dataset of experimental data acquired by means of QEPAS and EC sensors both in laboratory and in field conditions. The computed classification models were then applied to any new data received to obtain the corresponding predicted probability value. Two different probability thresholds were then considered for alarm activation, one which allows to maximize classification efficiency and one which allows to maximize classification specificity (i.e., to minimize false positive results). During the second step, the expert system integrates the output given from multiple sensors measuring the same target to provide the user with a unique alarm value for each compound. In this context, the application of a high-level data fusion approach allows to meet the requirement of having a flexible expert system able to include at this stage any new sensor (e.g., LIDAR sensor) as well as to consider the possibility of temporary inactivity of some sensors. During the last step, the expert system further integrates the outputs from the previous steps to provide the user with a unique global evaluation of the possible criminal threat of an IE production site. The global alarm level provided as output of this third step is, in fact, defined considering the sensors’ locations, the short time, if any, between the positive detections of the total number of detected targets as well as the detection of specific targets known to be used together to prepare a specific IE. At this stage, the end user can easily customize the system according to the condition-specific needs by modifying the parameters that determine the alarm activation (e.g., the list of individual targets or the list of couples of targets substances whose detection determine the alarm). Finally, a dedicated user interface has been developed in collaboration with TEKEVER (reference) to provide the user with a compact representation of the information given by the expert system. The performance of the developed sensor network was evaluated under relevant environmental conditions, i.e., in the presence of interferents and pollutants in both air and water, in the Italian Air Force base of Pratica di Mare and in Swedish Defence Research Agency facility in Grindsjön. An extensive validation of the capability of the expert system was carried out to effectively integrate the information provided by the different sensors showing that the end-users were effectively provided with a global alarm level, summarizing information from the entire network into a unique evaluation of the possible criminal threat of an IE production site. The expert system during the validation showed its capability to handle information not only from the BONAS sensors, but also from the sensors developed in another project, EMPHASIS. This flexibility in terms of integration of the response provided by any sensor allows easily including in the network any possible new sensor and establishing a large network supporting safer smart cities. Acknowledgments: The project BONAS was funded under the 7th Framework Programme of the European Commission, grant agreement No. 261685. We acknowledge Christophe A. Marquette, Directeur Adjoint of the Institut de Chimie et Biochimie Moléculaires et Supramoléculaires Equipe Génie Enzymatique, Membranes Biomimétiques et Assemblages Supramoléculaires (GEMBAS) of the University Lyon 1 (France) for the tests carried out with the electrochemical sensor, Pedro Santo Antonio from TEKEVER, Obidos (Portugal), for developing the software connecting the sensors of the BONAS network. Author Contributions: Francesco Saverio Romolo proposed the general approach for the expert system to handle the network of sensors (Step 1, Step 2 and Step 3), and contributed to the writing of this article. Carlotta Ferrari developed and validated chemometric models, and contributed to the writing of this article. Alessandro Ulrici contributed to the validation of the results of the expert system, and supervised the writing of this article.
Challenges 2017, 8, 1
18 of 18
Conflicts of Interest: The authors declare no conflict of interest. The founding sponsors had no role in the design of the study; in the collection, analyses, or interpretation of data; in the writing of the manuscript, and in the decision to publish the results.
References 1. 2.
3.
4. 5.
6.
7. 8. 9. 10. 11.
12. 13. 14.
15.
Marshall, M.; Oxley, J.C. (Eds.) Aspects of Explosives Detection; Elsevier: Amsterdam, The Netherlands, 2009; p. 21. Department of Justice, Office of Public Affairs. Umar Farouk Abdulmutallab Sentenced to Life in Prison for Attempted Bombing of Flight 253 on Christmas Day 2009. Available online: http://www.justice.gov/opa/ pr/2012/February/12-ag-227.html (accessed on 26 October 2016). Transportation Security Administration. UK 2006 Liquid Explosives Plot Trial Overview. Available online: http://www.tsa.gov/press/releases/2008/09/08/uk-2006-liquid-explosives-plot-trial-overview (accessed on 26 October 2016). Intelligence and Security Committee. Report into the London Terrorist Attacks on 7 July 2005. Available online: www.fas.org/irp/world/uk/isc_7july_report.pdf (accessed on 26 October 2016). Regulation (EU) No. 98/2013 of the European Parliament and of the Council on the Marketing and Use of Explosives Precursors was Adopted on 15 January 2013. Available online: http://eur-lex.europa.eu/legalcontent/EN/TXT/?uri=uriserv:OJ.L_.2013.039.01.0001.01.ENG (accessed on 26 October 2016). Önnerud, H.; Wallin, S.; Östmark, H.; Menning, D.; Ek, S.; Ellis, H.; Kölhed, M. Localisation of threat substances in urban society—LOTUS: A viable tool for finding illegal bomb factories in cities. In Proceedings of the SPIE 8019, Sensors, and Command, Control, Communications, and Intelligence (C3I) Technologies for Homeland Security and Homeland Defense X, 80190Y, Orlando, FL, USA, 25 April 2011. [CrossRef] Final Report Summary—BONAS (Bomb Factory Detection by Networks of Advanced Sensors). Available online: http://cordis.europa.eu/result/rcn/169207_en.html (accessed on 30 October 2016). Romolo, F.S.; Connell, S.; Ferrari, C.; Suarez, G.; Sauvain, J.J.; Hopf, N.B. Locating bomb factories by detecting hydrogen peroxide. Talanta 2016, 160, 15–20. [CrossRef] [PubMed] Barker, M.; Rayens, W. Partial least squares for discrimination. J. Chemom. 2003, 17, 166–173. [CrossRef] Viola, R.; Liberatore, N.; Luciani, D.; Mengali, S. Quartz enhanced photoacoustic spectroscopy for detection of improvised explosive devices and precursors. Adv. Opt. Technol. 2016, 2016, 1–12. [CrossRef] Kemp, M.C. A review of sensor data fusion for explosives and weapons detection. In Proceedings of the SPIE Defense, Security, and Sensing, International Society for Optics and Photonics, Baltimore, MD, USA, 29 April 2013. Final Report Summary—EMPHASIS (Explosive Material Production (Hidden) Agile Search and Intelligence System). Available online: http://cordis.europa.eu/result/rcn/169001_en.html (accessed on 30 October 2016). Romolo, F.S.; Cassioli, L.; Grossi, S.; Cinelli, G.; Russo, M.V. Surface-sampling and analysis of TATP by gas chromatography/mass spectrometry. Forensic Sci. Int. 2013, 224, 96–100. [CrossRef] [PubMed] Sigman, M.E.; Clark, C.D.; Caiano, T.; Mullen, R. Analysis of triacetone triperoxide (TATP) and TATP synthetic intermediates by electrospray ionization mass spectrometry. Rapid Commun. Mass Spectrom. 2008, 22, 84–90. [CrossRef] [PubMed] Connell, Toward a “Smart City”, IH and Security Professionals Collaborate on Early Detection of Bombs. Available online: http://synergist.aiha.org/201605-toward-a-smart-city (accessed on 30 October 2016). © 2017 by the authors; licensee MDPI, Basel, Switzerland. This article is an open access article distributed under the terms and conditions of the Creative Commons Attribution (CC-BY) license (http://creativecommons.org/licenses/by/4.0/).