Why are Men Falling Behind? Explanations for the Gender Gap in College Outcomes
Dylan Conger The George Washington University Trachtenberg School of Public Policy and Public Administration 805 21st Street NW, MPA 601G Washington, DC 20052 202-994-1456
[email protected] Mark C. Long University of Washington Daniel J. Evans School of Public Affairs Box 353055 Seattle, WA 98195-3055 206-543-3787
[email protected]
July 29, 2008
Prepared for the Texas Higher Education Opportunity Project Conference, August 14-15, Princeton, New Jersey. We thank Ana Karruz and Danielle Fumia for excellent research assistance.
[Preliminary Draft]
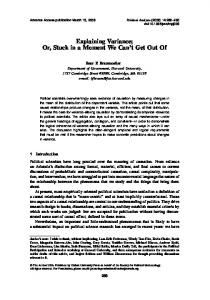
Why are Men Falling Behind? Explanations for the Gender Gap in College Outcomes 1. Introduction Males' share of total college enrollment has fallen steadily from 71% in 1947 to 43% in 2005, with 1978 being the last year that males held an advantage (see Figure 1 derived from data in Snyder, T.D., Dillow, S.A., and Hoffman, C.M., 2008). Between 1980 and 2005, the number of males who were enrolled grew by 26% while the number of females enrolled grew by 62% (U.S. Census Bureau, 2007). Several studies have explored the reasons for males falling behind their female counterparts in enrollment (e.g. Jacob 2002; Peter and Horn, 2005; Riegle-Crumb, no-date). Yet few have examined whether these gaps persist conditional on college enrollment, and if so, why. There is suggestive evidence that male college enrollees fall behind their female classmates. For example, 42% of bachelor's degrees went to men in 2005-06 despite males comprising 46% of freshmen in 2002 (Snyder, T.D., Dillow, S.A., and Hoffman, C.M., 2008). This gap is surprising as prior studies have also found that male college enrollees have higher secondary school test scores than female enrollees. 1 [Figure 1 here] In this paper, we use administrative data on college enrollees in Florida and Texas to examine gender gaps in college outcomes, including credits earned, grade point averages, and graduation, and identify explanations for these gaps. We focus in particular on the role played by students' high school experiences (their choice of school, curriculum, and performance) and students' college experiences (their choice of school and curriculum).
1
Peter, K., and Horn, L. (2005); LoGerfo, L., Nichols, A., and Chaplin, D. (2006); Long, M., Conger, D., and Iatarola, P. (forthcoming).
1
2. Prior Research on Gender Gaps in Postsecondary Education Relatively little research has explored the causes of men falling behind at the postsecondary level, and the research that does exist focuses almost exclusively on college enrollment or college completion, with little exploration of outcomes in between these two points. Prior studies of female advantages in college enrollment find that females have higher high school grade point averages, are more likely to graduate from high school, and more likely to take rigorous course loads while in high school (Peter and Horn, 2005; Riegle-Crumb, no-date). Digging a little deeper, some studies find that girls are also advantaged in non-academic areas, such as parental, peer, and teacher expectations as well as "non-cognitive" skills such as organization, attentiveness, and seeking help from others (Reynolds and Burge 2004; Riegle-Crumb, no date; Jacob, 2002). Though little prior research has examined male-female differences in college grade point averages and credits, the characteristics of male and female college entrants, as well as the universities they attend, helps us form some hypotheses. For instance, though males are less likely to attend college, the males that go to college tend to have higher high school test scores than females: 58.1% of males in 1992 fell in the top 40% of the senior test score distribution compared to 55.7% of females. 2 Male college enrollees also have higher scores on mathematics assessments in elementary and high school, and are less likely to need remediation in math at the college-level (LoGerfo, Nichols, and Chaplin, 2006; Long, Iatarola, and Conger, forthcoming). Based on these factors, it would be reasonable to expect male college enrollees to perform better once they reach college. At the same time, females are less likely to major in subjects with strict grading standards, such as mathematics and engineering (e.g. Turner and Bowen, 1989). They also attend less selective colleges than males – schools that have looser admissions requirements and higher admissions rates (Jacobs, 1999). In part, this appears to be due to institutional factors; specifically, the fact that 2
Based on an index of test scores in reading comprehension; mathematics; science; and history, citizenship, and geography. Peter and Horn (2005).
2
selective universities often have larger male-dominated engineering programs and are less likely to accept part-time students, which tend to be female (Jacobs, 1999). Finally, a handful of studies have explored female advantages in college completion rates and they tend to find that incentives due to shifting female premiums on college degrees may be at work. Yet the incentives are not due to an increase in the wage premium on a college degree for women relative to men; in fact, with the decline of the manufacturing sector, the wage premium associated with completing more years of education and with attending a higher quality college have been rising faster for men than for women (Charles and Luoh, 2003; Long, forthcoming). Instead, Charles and Luoh (2003) suggest that greater variation in the returns to a college degree among men than among women leads to greater uncertainty for men, which in turn lowers their educational attainment levels. Taking a slightly more social perspective, DiPrete and Buchmann (2006) suggest that the female advantage in college completion is more likely due to the male-female differential in "personal" returns to education, including a higher probability of marriage, a higher standard of living, and a lower probability of being poor. In a companion paper, Buchmann and DiPrete (2006) find that completion gaps are also driven by changes in family resources and the differential effect of family resources on girls and boys. More specifically, they argue that boys are disproportionately harmed by growing up in families without fathers or with fathers who do not have a college education. Given the shortage of research on the reversal in the gender post-secondary education gap, we clearly have much to contribute. First, unlike the prior research, we are able to examine grade point averages, credits earned, and college completion rates, shedding light on whether gender gaps are constant, growing, or diminishing during the students' years of college enrollment. Second, we control for many important determinants of college achievement that prior studies have not explored, including demographic background, educational needs, high school quality, performance
3
on high school achievement exams, high school grades, college quality, and college major. Finally, we undertake our study with two unique, and complimentary, administrative datasets. Our results show that male-female gaps in college are generally not caused by differences in demographics, the quality of high schools and neighborhoods, or test scores among male and female college enrollees. In fact, these factors tend to favor male enrollees. On the other hand, male enrollees have lower high school class rank, and adding this single factor (controlling for test scores and other factors) lowers male-female gaps by around half! We also find, consistent with the prior literature, that males choose majors in college that place them at a disadvantage in terms of college performance relative to their female counterparts.
3. Data The first source of data comes from students who enrolled in one of Florida's eleven public 4year universities in 2002-03 in the year immediately following their high school graduation. More specifically, the dataset consists of a census of Florida public 8th graders in 1997-98 plus any other student who entered this cohort given normal progression (i.e., new 9th graders in 1998-99 + new 10th graders in 1999-00 + new 11th graders in 2000-01 + new 12th graders in 2001-02). Students are followed through the 2004-05 school year, 3 and we are able to follow students as they make movements across Florida's postsecondary public universities. 4 For these students, we have complete high school and college transcript records, 10th grade test scores, and demographic information. These data were supplied to the authors by the Florida Department of Education. The second data source includes a census of the enrollees at the University of Texas at Austin in 1999-00 (UT); at the University of Texas-Pan American in 1999-00 (UTPA); and Rice University in
3
In the near future, we will be getting data on these students through 2006-07. We additionally have data from the National Clearinghouse on these students' terms of enrollments in other postsecondary institutions. These additional data will be used in subsequent versions of the paper.
4
4
2000-01. Students at these universities are followed through 2004-05. For these students we have records on college credits earned and grade point average by term of enrollment, and college graduation. In addition, we have limited information collected on their college applications, including SAT/ACT scores, high school class rank, high school identifiers, and for UT only: advanced placement test taking and test passing indicators, mother's and father's education, and parent's combined income. For the Texas data, we have measures of the majors that students' choose (by year for UT and UTPA and for last term enrolled for Rice [check this]) and can control for these choices. In future version of the paper, we aim to generate similar measures of college major for the Florida data but for now, these measures are not available. The Texas data were compiled and made available to the authors by the Texas Higher Education Opportunity Project (www.theop.princeton.edu). These administrative datasets hold several important advantages over national survey data (e.g. National Educational Longitudinal Study). First, they offer large numbers of students attending individual postsecondary institutions, which can allow us to address nuanced questions about the relationships between these institutions and gender gaps. Secondly, we can evaluate how gender gaps evolve during the students' college careers. Third, given the large numbers of enrollees coming from individual states, we can add both high school and institutional fixed effects to the model. Fourth, these data provide insight into the most recent cohorts of college students. The data are limited to just Florida and Texas, but 13% of U.S. freshmen enrollees in 2005 were located in these two states (Snyder, T.D., Dillow, S.A., and Hoffman, C.M. (2008)), making the results here relevant for discussions of gender gaps nationally.
4. Estimation Strategy Using the Florida sample, we begin with the following specification:
5
(1)
Yihj = Giβ1 + Xiβ2 +νh + Aiβ3 + Ciβ4 + Riβ5 + αj + εi.
Yihj is the outcome (cumulative credits earned or cumulative GPA) for student i from high school h in university j. Gi equals 1 if the student is male, Xi is a vector socio-demographic characteristics (e.g. race/ethnicity; eligibility for free or reduced-price lunch), νh is a vector of variables indicating the high school the student attended, Ai is a vector of 10th grade test scores in math and reading, Ci is a vector of higher-level high school course-taking variables, Ri is the student's high school class rank,
αj is a vector of variables indicating the college campus the student attended, and εi is an error term. We begin by estimating Y on G, then enter each vector in subsequent models to examine the contribution of these background, high school, and college variables to the gender gap in early college outcomes. The order of these variables roughly corresponds to the temporal order of the variables' determination. In order to learn more about the within-college gender difference, we then examine gender gaps in five institutions, including the University of Florida (UF) and Florida A&M University (FAMU) and the three Texas Universities. As shown below, these five universities vary greatly in their degrees of selectivity and racial composition of their enrollment. For the two Florida institutions, we estimate Eq. (1) except that we remove the college campus fixed effect. For the two Texas institutions, we estimate Eq (1), again, without the campus fixed effect and with SAT/ACT test scores replacing 10th grade test scores. We also add an additional vector, M of the major that students choose. This last specification will allow us to determine whether differences in college major choices contribute to the gap. Finally, for our three Texas institutions we are able to model whether the student completed college within five years in addition to the credits and GPA earned along the way. Our goal with these multiple dependent variables and institutions is to examine the full variation in the college gender gap, and its determinants, by university and state.
6
5. Results: Determinants of Gender Gaps at Florida Universities. Table 1 shows means for credits earned and GPA for females and male-female raw gaps. Across all eleven Florida public universities, females in their first year earn an average of 23.3 credits and a GPA of 2.90. Males earn 1.5 fewer credits and have a GPA that is 0.19 lower. These gaps widen during the first three years after their initial enrollment. 5 The next columns show the results for enrollees at UF and FAMU. FAMU is an historically black university, which accepted 66% of their applicants in 2000-016 ; UF is perhaps the most selective public university in the state, admits 42% of its applicants, and has an interquartile range of SAT scores between 1140 and 1360 7 . Despite the differences in these institutions, significant male-female gaps are found within both institutions, and at both institutions these gaps widen during the first three years of enrollment. These gaps are larger at FAMU. Table 2 shows the means of the characteristics of male and female enrollees in these institutions. For the state university system as a whole, male enrollees are more likely to be white or Asian and less likely to be black; are less likely to have received free- or reduced-price lunch during high school; but more likely to have some form of disability (i.e., "Non-Gifted Exceptionality"). Males have higher 10th grade math scores, but are nearly five percentage points lower in their high school class rank distribution. Male enrollees are more likely to have taken advanced placement (AP) or international baccalaureate (IB) classes in math and English, but less likely to have taken an AP/IB science course. The distribution of males and females across institutions is roughly comparable, with the exception of males being overrepresented at the New College of Florida, which is a highly selective institution. In combination, the gender gaps in these characteristics do not provide a clear
5
For the Florida institutions, we track credits earned at any Florida public university. For the Texas institutions, we track credits earned in that specific university. 6 http://www.blackexcel.org/march-2002.htm (based on U.S. News & World Report 2000-2001 admissions data) 7 http://www.petersons.com.
7
pattern of advantage for female students as several characteristics would seem to suggest male advantages. Table 3 shows the regression results for the Florida universities. The raw gaps shown in the first three rows repeat what was shown in Table 1. We then add demographic characteristics as explanatory variables. With these variables included, the male coefficients are largely unchanged. That is, the demographic differences between male and female enrollees explain very little of male's performance gaps. Gaps at UF widen by as much as 10% when including demographics, while they fall by as much as 12% at FAMU. We next add high school fixed effects. These high school fixed effects will capture any qualities of the high school (or the associated neighborhoods) that systematically vary across male and female enrollees. Again, these high school fixed effects don't provide much explanatory power. In fact, the gaps across the eleven universities increase slightly with the inclusion of the high school fixed effects, which suggests that males come from high schools / neighborhoods that provide them some advantage over their female enrollee counterparts. At UF, the gaps widen by as much as 14% with the inclusion of high school fixed effects, while at FAMU, the gaps narrow by as much as 6%. These results suggests that males who come from advantaged high schools may be steered more toward attending the state's flagship campus than their female classmates. 8 We next add 10th grade math scores on the Florida Comprehensive Assessment Test. Male enrollees held a test score advantage over their female classmates systemwide and at UF, but not at FAMU. As a result, controlling for these test scores, the male-female gaps substantially widen systemwide (18-29% larger gaps) and at UF (6-36% larger gaps). That is, males should be doing better given their test score advantages.
8
This hypothesis will be tested more systematically in future versions using data on all eleven institutions.
8
Next, we add AP/IB coursetaking. Since males enrollees hold advantages in coursetaking in some subjects, but not in others, the male-female gaps in cumulative credits and GPA change modestly, falling 7-8% systemwide and 7-10% at FAMU, but remaining essentially unchanged at UF. The next set of results are the most striking. Controlling for females advantage in high school rank, the male-female gaps are substantially reduced. The remaining gaps fall by 53-63% systemwide, 33-72% at UF, and 56-70% at FAMU. Female advantages in high school class rank more than offset their modest deficiencies on 10th grade math scores. These results suggest that being a successful high school student, in terms of getting higher grades than ones peers, is a strong predictor of credits earned and grades within college. Finally, for the eleven universities, we add university fixed effects. This specification checks whether males are systematically enrolling in universities in which students complete fewer credits and have lower GPAs. The results show that the opposite is true; male-female gaps widen with the inclusion of these fixed effects indicating that males are more likely to attend universities where students complete more credits and have higher GPAs. Since more selective institutions tend to have higher graduation rates and higher GPAs, males being distributed towards more selective institutions could explain these results.
6. Results: Determinants of Gender Gaps at Texas Universities. The three institutions that we study are very different types of institutions. UT is the most selective public institution in the state, with an average freshman SAT around 1,200. UTPA is located along the Mexican border and designated as an "Hispanic-serving institution" with more than 80% of its students being Hispanic. UTPA's admitted nearly 90% of its applicants and its average freshman SAT was around 840. Rice University is a private and extremely selective institution with an average freshman SAT of around 1,400. Despite the differences in these
9
institutions, we find large gender gaps in college GPA and 5-year college graduation rates at each institution, as shown in Table 4. The GPA gaps widen over time at each institution. Males at UTPA also earn fewer credits than their female classmates, and these gaps widen over time. 9 In Table 5, we show that male enrollees at UT are more likely to be Asian and less likely to be black, while at Rice, male enrollees are less likely to be Asian, and at UTPA there is no difference in the racial composition of male and female enrollees. Males at UT have parents with higher education and income than their female counterparts. At all three institutions, males have higher SAT/ACT scores (although the difference is small and insignificant at Rice). At all three institutions, females have significantly higher class ranks. At UT, males are more likely to have passed AP tests in math, science, and social science, while females are more likely to have passed AP test in foreign language and other subjects. Again, there is not a clear pattern in these data which would predict a female advantage in college GPA and graduation. Finally, we see that at all three institutions, males are far more likely to have majored in engineering / computer science and less likely to have majored in humanities or social sciences. Table 6 shows the regression results. Adding student's demographic characteristics raises the gender gap in GPA at UT (10-14%) and at Rice (7-10%), but has no effect at UTPA. Adding high school fixed effects raises the GPA gaps at all three institutions by 4-6% at UT, 8-11% at UTPA, and a remarkable 62-137% at Rice. 10 These results suggest that males are coming from high schools /neighborhoods that advantage them over their female classmates. Adding the high school fixed effects raises the gender gap in graduation by 34% at Rice and 5% at UT, but lowers it at UTPA by 9
Note that the 10.0% 5-year graduation rate that is reported for females at UTPA is not a misprint. UTPA reports the following 4-year graduation rates: 6.2% for 1997 entrants and 10.2% for 2001 entrants. Their 6-year graduation rates are much higher: 26.2% for 1997 entrants and 32.4% for 2000 entrants. Adding graduation at any Texas public university, their 6-year graduation rates were 29.6% for 1997 entrants and 37.0% for 2000 entrants. Thus, the low graduation rates do not simply reflect students transferring to other institutions prior to graduating. (University of Texas System, 2008). 10 High school codes are missing for 12.1% of enrollees at UTPA and 0.5% of enrollees at UT and Rice. We have given these students a common high school code for the purposes of the fixed effects analysis. Implicitly, this method treats these students as having a common high school experience.
10
9%. At Rice, large gaps in credits earned emerge with the inclusion of high school fixed effects, although these gaps are mostly insignificant. Like the results for Florida institutions, we observe that the neighborhood effects advantage males at the most selective institutions, but have ambiguous effects at the less selective institutions. Next we add SAT/ACT scores as control variables. Given males advantage on these tests among enrollees at these institutions, the gaps widen. The GPA gaps widen 28-52% at UT, 18-25% at UTPA, and 3-4% at Rice, while the graduation gaps widens 21% at UT, 10% at UTPA, and 5% at Rice. Adding in AP test performance lowers these gaps at UT by 8-10%, suggesting a net advantage for female enrollees in high school coursetaking and/or performance. Again, the striking results come when we control for high school class rank. At UT, malefemale gaps and graduation are cut nearly in half, and males now have a significant advantage in credits earned by the 6th year. At UTPA, gaps in credits earned, GPA, and graduation are cut by 4051. At Rice, gaps in GPA are reduced by 34-46%, gaps in graduation are reduced by 6%, and these gaps all become insignificant. In the last section, we add college major indicators. For UT and UTPA, college majors are recorded for each year; thus it is possible to evaluate how changes in college majors over time affect whether the student graduated in five years. As these results show, males are enrolled in majors that place them as a substantial disadvantage relative to their female classmates. At UT, the remaining gender gaps (after controlling for gaps in class rank and other variables) are reduced by 24-33% for GPA, 17-40% for college graduation, and males now have significant advantages in credits earned beginning in their 3rd year. At UTPA, the remaining GPA gap is cut by 15-39% in each year. At Rice, the inclusion of college major widens the gaps in credits earned and graduation, but lowers the gap in GPA and nearly all of these gaps remain insignificant.
11
7. Conclusions After decades of research aimed at explaining why girls are less likely to enroll in college than boys, the attention has recently shifted to the relatively dismal performance of boys at the post-secondary level. The female advantage persists through secondary school, with females graduating high school and, now,entering college at higher rates than males. Though males remain overrepresented in several high-wage occupations and industries, the labor market implications of the gender reversal in high school degree attainment and college enrollment are troubling. In this paper, we examine whether the female advantage persists into the college years by examining gender gaps in post-secondary hours, grade point averages, and college completion. Specifically, we use administrative data on post-secondary entrants in two of the largest states in the nation—Texas and Florida—to both quantify gender gaps in college performance and provide some explanations. Given that females are more likely than males to enroll in college and, consequently, more likely to be drawn from lower on the ability distribution, it is not clear that females should still outperform males once in college. Our data suggest that, indeed, they do. Across all 11 public 4-year institutions in Florida, for instance, males earn 1.5 fewer credits than females in their first year, and earn even fewer in the second and third years for a cumulative male disadvantage of 6.5 credits by the end of the third year. Males also earn lower grades than females in each year of college, with a gender GPA gap for Florida entrants of approximately 0.20 in each year. In the three Texas universities that we examined for which college completion could be determined, males are also less likely to graduate within five years. Yet there is substantial variation in the male disadvantage across post-secondary institutions. We profile five institutions, two from each state that represent highly and less selective public institutions, and one private university in Texas. The male/female credit gap in the first year of 12
college in these five institutions is -1.3 at UF, -2.1 at FAMU, +0.4 at UT, -1.0 at UTPA, and a statistically insignificant -0.2 at Rice University. To the extent that patterns can be gleaned from these five institutions, we see that the credit gaps are smaller or nonexistent at the more selective universities in both states (UF, UT, and Rice). Interestingly, however, while the more selective institution in Florida also has a lower GPA gap than the least selective institution, this is not entirely true of Texas, where the GPA gap is almost the same in UT and UTPA, What is more, the male disadvantage in the five-year completion rate is highest at UT and lowest at UTPA. Thus, our institution-specific analysis reveals that either differential selection into these universities, or university-specific policies and practices, can alter gender gaps in college outcomes. To examine this possibility, and other explanations, we estimate a series of regressions of gender gaps in outcomes for all of the Florida entrants and entrants into each of the five institutions. We begin our discussion with the factors that appear not to be driving the gaps. Among Florida entrants, we find that the gaps are mostly robust to controls for demographics (e.g. race/ethnicity) and educational needs (LEP and exceptionality), high school fixed effects, 10th grade test scores, and advanced high school course-taking. In fact, differences in 10th grade scores and the high schools attended currently advantage males in college. In addition, the gaps are remarkably unaltered by the addition of college campus fixed effects. Instead, what single-handedly reduces the gap by around half for all of these institutions are the students' class rank percentiles, a measure of their grades relative to their peers in their high schools. Females earn higher rankings, and the rankings are far more predictive of hours and GPA than any other variable in the model. Our separate analysis of the five institutions largely
13
confirms the major conclusion: high school class rank trumps all other explanations. Clearly, boys need to earn better grades in high school in order to make up the gap in college. With data on students' choice of major in the three Texas institutions, we also find that males are disadvantaged by choosing majors with lower GPAs. Since these majors lead to higher wages, the fact that males earn lower grades and credits in pursuit of them is not, in and of itself, evidence of males falling behind. However, we also find that the choice of major leads to lower 5-year college completion rates in at least one university (UT), suggesting some male disadvantage in choosing them. Finally, though we reduce the gaps substantially with our observables, we are unable to reduce them to zero in most cases. Thus, despite controls for backgrounds, educational needs, high school quality and performance, and college quality and major, males are still falling behind. There are several remaining explanations that we have not addressed. For instance, some research finds that girls are socialized to respect authority and please others, which may lead to their stronger work ethic and academic orientation (Gilligan, 1982; Reigle-Crumb, no-date). Others find that females have greater incentives to do well in college given male-female differentials in the stability or quality of the returns to a college degree (e.g. Charles and Luoh, 2003; DiPrete and Buchmann, 2006). Our findings suggest that either our measure of high school grades does not fully hold these factors constant, or that they grow over time. Put differently, females non-congnitive advantages and incentives to attain may increase as they progress through school.
14
References Buchmann, C. and DiPrete, T. (2006). "The Growing Female Advantage in College Completion." American Sociological Review 71, 515-541. Cameron, S.V., and Heckman, J.J. (1993) "The Nonequivalence of High School Equivalents," Journal of Labor Economics, 11, 1-47. Charles, K.K., and Luoh, M. (2003). "Gender Differences in Completed Schooling." The Review of Economics and Statistics 85(3): 559-577. DiPrete, T., and Buchmann, C. (2006). "Gender-Specific Trends in the Value of Education and the Emerging Gender Gap in College Completion." Demography 43: 1-24. Gilligan, C. (1982). In a Different Voice: Psychological Theory and Women's Development. Cambridge, MA: Harvard University Press. Heckman, J.J., and LaFontaine, P.A. (2007) "The American High School Graduation Rate: Trends and Levels," National Bureau of Economic Research, Working paper 13670, December Jacob, B.A. (2002) "Where the boys aren't: Non-cognitive skills, returns to school and the gender gap in higher education," Economics of Education Review, 21(6): 589-598. Jacobs, J.A. (1999) "Gender and the Stratification of Colleges." Journal of Higher Education 70: 161-87. King, J.E. (2006) "Gender equity in higher education: 2006," American Council on Education, accessed February 15th, 2008 from http://www.acenet.edu/bookstore/pubInfo.cfm?pubID=373. LoGerfo, L., Nichols, A., and Chaplin, D. (2006) "Gender gaps in math and reading gains during elementary and high school by race and ethnicity," Urban Institute, Accessed February 13th, 2008 from http://www.urban.org/publications/411428.html.; Long, M.C. (forthcoming), "Changes in the Returns to Education and College Quality." Economics of Education Review.
15
Long, M., Conger, D., and Iatarola, P. (forthcoming) "Explaining Gaps in Readiness for CollegeLevel Math: The Role of High School Courses," Education Finance and Policy. Jacobs, J.A. (1999) "Gender and the stratification of colleges," The Journal of Higher Education, 70(2): 161-187. Peter, K., and Horn, L. (2005) "Gender differences in participation and completion of undergraduate education and how they have changed over time" (NCES 2005–169). U.S. Department of Education, National Center for Education Statistics. Washington, DC: U.S. Government Printing Office. Reynolds, J.R. and Burge, S. (2004) "Gender-related changes in educational expectations: The roles of family, school, and race/ethnicity," working paper accessed February 15th, 2008 from http://garnet.acns.fsu.edu/~jreynold/socofed-submitted.pdf. Riegle-Crumb, C. (no date) "More girls go to college: Academic and social factors behind the female postsecondary advantage," working paper accessed February 12, 2008 from http://theop.princeton.edu/workingpapers.html; Turner, S. and Bowen, W. (1999). "Choice of Major: The Changing (Unchanging) Gender Gap. Industrial Labor Relations Review 52 (2): 289-313. Snyder, T.D., Dillow, S.A., and Hoffman, C.M. (2008). Digest of Education Statistics 2007 (NCES 2008022). National Center for Education Statistics, Institute of Education Sciences, U.S. Department of Education. Washington, DC. U.S. Census Bureau, Statistical Abstract of the United States: 2007 (126th Edition) Washington, DC, 2006. University of Texas System (2008). "The University Of Texas-Pan American Accountability Profile", http://www.utsystem.edu/osm/accountability/2007/Profiles/UTPAAccountabilityProfile.pdf, (accessed July 27, 2008).
16
Figure 1: Male's Declining Share of College Enrollment and BA Completion 0.80
Male share of high school completers 0.70
Male share of enrollment in postsecondary degree-granting institutions
0.60
0.50
Male share of BA recipients
2003
1998
1993
1988
1983
1978
1973
1968
1963
1957
1952
1947
0.40
Source: Digest of Education Statistics, 2007.
17
Table 1: Gender Differences in Outcomes at Florida Public Universities Any 4-Year FL Public Univ.
University of Florida
Florida A&M University
Years Since Entry
Cumulative Hours
Cumulative GPA
Cumulative Hours
Cumulative GPA
Cumulative Hours
Cumulative GPA
Female Means
1 2 3
23.3 44.6 65.5
2.89 2.86 2.87
25.3 50.8 77.3
3.29 3.29 3.30
23.6 43.9 63.4
2.50 2.40 2.40
Male-Female Raw Difference
1 2 3
-1.5*** -3.6*** -6.5***
-0.19*** -0.21*** -0.23***
-1.3*** -3.4*** -6.0***
-0.071*** -0.101*** -0.129***
-2.1*** -4.4*** -7.6***
-0.240*** -0.264*** -0.279***
Number of Obs. Male Female Total
11,014 16,445 27,459
2,170 3,089 5,259
582 972 1,554
Notes: Cumulative hours and GPA refer to those earned at any 4-year public institution.
18
Table 2: Differences in Mean Characteristics of Enrollees at Florida Public Universities Any 4-Year FL Public Univ. Male Female Sig Diff?
University of Florida Male Female Sig Diff?
Florida A&M University Male Female Sig Diff?
Demographics White Black Hispanic Asian Received Free- or Reduced-Price Lunch Age (as of?) Foreign Born Limited English Proficient Non-Gifted Exceptionality
66% 14% 13% 5% 20% 18.0 10% 9% 4%
62% 19% 13% 4% 23% 18.0 10% 9% 2%
*** *** ***
***
72% 8% 9% 9% 12% 18.0 6% 2% 1%
70% 10% 10% 7% 16% 18.0 11% 8% 2%
** **
3% 95% 9% 3% 51% 19.0 6% 6% 5%
1% 95% 2%