gest perceived usefulness explains a significant pro- ... while age was not a significant predictor. Implica- .... The effect of age again was not significant (figure not.
Explaining Information Technology Use with the Usefulness Scale: A Comparison with User Age Michael W. Kattan' and Dennis A. Adams2
'Departments of Urology and Information Technology, Baylor College of Medicine, Houston 2Department of Decision and Information Sciences, University of Houston ABSTRACT
pared here with age in explaining use of information technology.
Understanding and predicting the use of information technology is an important problem in healthcare management. The relationships among user characteristics and information technology have generally been weak. This paper describes a recently developed scale that measures perceived usefulness of information technology. Following this description, the scale is compared with user age in ability to explain information technology use. The results suggest perceived usefulness explains a significant proportion of the variance in use (r2 = .13, p < 0.0001), while age was not a significant predictor. Implications and suggestions for use of the usefulness scale are discussed.
METHODS A summary of the development of the usefulness scale is presented here, and details can be found in [7]. Based largely on the theory of reasoned action, perceived usefulness is defined as "the degree to which a person believes that using a particular technology would enhance his or her job performance." A useful technology should have a positive useperformance relationship. Initially, 14 job performance items were candidates for the usefulness scale, though rigorous psychometric analysis [7-9] suggested that 6 items were sufficient to capture the semantic content of the usefulness construct. The final usefulness scale appears in Table 1.
INTRODUCTION Many studies have examined use of medical and nonmedical information technology. Generally, the purpose of these studies is to explain and/or predict voluntary use of information technology. A technology that is not used cannot be effective [1]. Explaining technology use can be excellent feedback for technology designers or can help diagnose problems with technology that are leading to poor acceptance. Predicting technology use could greatly assist information technology managers in selection among competing packages. Prediction of technology use might also benefit IS trainers by indicating the possible superiority of a particular training methodology.
Table 1. Items of the Perceived Usefulness Scale 1. Using [Technology X] allows me to accomplish tasks more quickly. 2. Using [Technology X] enhances my effectiveness on the job. 3. Using [Technology X] improves my job performance. 4. Using [Technology XI makes it easier to do my job. 5. Overall, I find using [Technology X] to be advantageous in my job. 6. Using [Technology X] increases my productiVitY.
Physicians have historically not used information technology in their daily routine [2-4]. While many reasons have been proposed, age of the user has received considerable attention [5,6]. However, age itself would seem to be a proxy for some underlying factor (e.g., reticence [5], lack of training). Theoretically, age is not the important factor, but a convenient measure for something that perhaps correlates with age. To attempt to measure this underlying theoretical factor, a perceived usefulness scale has been derived by Davis [7,8]. This usefulness scale is com0195-4210/94/$5.00 i 1994 AMIA, Inc.
These items seem to capture many of the variables speculated by others [5] to affect information technology use. For example, a large amount of time required to use the technology [10] is reflected in items 1 and 6. A lack of value in using the technology [11] seems similar items 3 and 5, as well as perhaps items 2 and 4.
81
USE
The usefulness scale is designed to be domain and technology independent. That is, the theory behind the scale suggests that a physician would not use medical information technology that he/she does not perceive as useful, nor would an auto mechanic use an automotive diagnostic technology that he/she does not perceive as useful. For this reason, we chose to measure perceived usefulness, age, and information technology use by'individuals across a variety of industries, including healthcare. Approximately 80% of the respondents held professional to executive levels in their respective organizations. Nearly 80% were college educated. The average age of the respondents was 35.5 years; 41% of the respondents were female; and the average time with their current employer was 8.2 years. The technologies selected were voice mail (v-mail) and electronic mail (e-mail), and the particular systems used varied across and within organizations. Each respondent evaluated his or her specific v-mail and/6r e-mail system (e.g., PC Eudora).
USE 60
50
40
30
20
10
0
.
.
. .
20
.
1
v . .
8 I
.
40 50 (R2-. 0008)
30
AGE
60
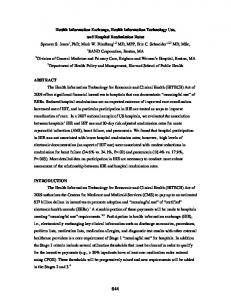
Figure 1. Use Regressed on Age
Confidential pencil-and-paper questionnaires were administered to 260 individuals across 10 organizations, and 118 questionnaires were returned, for a response rate of 45%. Given the theoretical technology independence of the usefulness scale (described above), we chose to report pooled results of the e-mail and v-mail systems, yielding 170 observations. (Of the 118 respondents, 52 used both e-mail and v-mail systems.) The usefulness items were each measured on 7-point Likert scales, ranging from "Strongly Disagree (1)" to "Strongly Agree (7)". The usefulness scale is the equally weighted sum of the six individual items. Age was self-reported in years. Use was self-reported as the sum of the number of messages sent and received on a typical day.
USE 60
50
40
3D .
20
1 0.
RESULTS
0
20
10
USF
As a preliminary check of the multi-item usefulness scale, reliability was verified. Cronbach's alpha was high, at .93, indicating that respondents' scores across the usefulness items tended to covary. The individual items appear to address the same construct as scores on the individual items move together across respondents.
.:'."
30
40
(R2-. 1298)
Figure 2. Us'e Regressed on Usefulness
Separate regression analyses were performed to investigate the explanatory powers of age, perceived usefulness, and the individual items of the perceived usefulness scale. Respectively, the results appear in Figures 1, 2, and 3a-3f.
82
50
USE 60
60
50
50
40
40
30
30 a I
20
20 0
t 6
a
a a
a
10
a
10
:
a a
0 0
I
1
2
3
USF1
.
a,
a
a
-b-
-
I 2
a
n
-.--
:
I
4
5
a
r.I 6
7
1
2
3
(RR2-._0413 )
USF3
Figure 3a. Use Regressed on "Accomplish Tasks More Quickly"
5
4
6
7
CR2-.0636)
Figure 3c. Use Regressed on "Improving Job Performance u5E
el r,
60
50
40
30
2
0
-
I: .~ a
SF4
0~ q~ ~ 1. 2 3
.SF
Figure 3b. Use Regressed on "Enhancing Effectiveness"
CR2-. .
4
R2
.05 7
I
Figure 3d. Use Regressed on "Easier to do Job"
83
USE USE 60
perceived usefulness items were significant (all p