6-glucuronide at the total mu, mu 1, mu 2 and delta receptors were determined. ... found to have a 4-fold lower affinity for the mu 2 receptor (IC50 17 nm and 82 ...
Br. J. Cancer (1992), 122-126 65, 122-126 Br. J. Cancer (1992), 65,
'." ©
Macmillan Press Ltd., 1992
Macmillan
Press
Explanation at the opioid receptor level for differing toxicity of morphine and morphine 6-glucuronide D. Hucks', P.I. Thompson2, L. McLoughlin', S.P. Joel2, N. Patel2, A. Grossman', L.H. Rees' & M.L. Slevin2 'Department of Chemical Endocrinology, St Bartholomew's Hospital, London; 2ICRF Department of Medical Oncology, St Bartholomew's and Homerton Hospitals, London, UK. Summary The radiolabelled opioid receptor binding affinities of morphine and its active metabolite morphine 6-glucuronide at the total mu, mu 1, mu 2 and delta receptors were determined. Morphine 6-glucuronide was found to have a 4-fold lower affinity for the mu 2 receptor (IC50 17 nm and 82 nm for morphine and morphine 6-glucuronide respectively, P = 0.01), the receptor postulated to be responsible for mediating the respiratory depression and gastrointestinal effects after morphine. This provides a possible explanation for the reduced respiratory depression and vomiting seen following morphine 6-glucuronide in man. A similar reduction in affinity of morphine 6-glucuronide was seen at the total mu receptor whilst there was no significant difference seen at the mu or delta receptor. Hence the increased analgesic potency of morphine 6-glucuronide over morphine remains unexplained.
Morphine is
of the commonest drugs prescribed by and is an effective potent analgesic. Howof the side effects of constipation, nausea and vomiting, and sedation are encountered frequently (Jaffe & Martin, 1991). Respiratory depression is a less common problem but is the most potentially dangerous toxicity. An analgesic with equivalent potency but lower toxicity would therefore be of particular use. The major metabolic products of morphine are morphine 3-glucuronide (M3G) and morphine 6-glucuronide (M6G). Although M3G is devoid of analgesic activity, M6G is now thought to play a major role in mediating the analgesic effect of morphine (Osborne et al., 1986; Hanks et al., 1987; Hoskin & Hanks, 1990). When given directly M6G has been demonstrated to have more potent antinociceptive activity than morphine in animals (Shimomura et al., 1971; Pasternak et al., 1987; Abbott & Palmour, 1988; Paul et al., 1989). It is tempting to presume the receptor binding profile of morphine and M6G is similar with M6G purely binding more avidly to the same receptors as morphine. However there are now several pieces of biochemical and clinical evidence to suggest this is not the case. Shimomum et al. (1971) found the systemic LD50 of M6G to be 88% that of morphine and hence first suggested the lethal effects of M6G did not directly correlate with its analgesic potency advantage over morphine. In addition glucuronidation is normally a natural mechanism of the body to detoxify noxious substances. An open study in man (Osborne et al., 1989) provided anecdotal evidence in man that M6G may have a better toxicity profile than morphine as no nausea or sedation was seen at doses sufficient to give significant pain relief. A recent double-blind randomised study comparing the respiratory depression induced by equipotent doses of morphine and M6G in normal volunteers (Thompson et al., 1990) demonstrated that significantly less respiratory depression was caused by M6G. In addition less nausea and no sedation was again observed. The apparent improved therapeutic /toxic ratio of M6G over morphine suggests these compounds have different opioid receptor binding profiles. From a number of studies the existence of several types of opioid receptor has been proposed (Gilbert & Martin, 1976; Lord et al., 1977; Wuster et al., 1979; Wolozin et al., 1981; Pasternak et al., 1980. one
cancer physicians ever one or more
Correspondence: P.I. Thompson, Department of Clinical Oncology, Auckland Hospital, Park Road, Grafton, Auckland, 1, New Zealand. Received 25 April 1991; and in revised form 5 September 1991.
Gouarderes et al., 1981; Rothman & Westfall, 1982), but there remains controversy over the existence and the functional and structural relationships of the various opioid receptor subtypes, particularly of the mu and delta receptor. Despite this, recent developments in producing selective enkephalin agonists has enabled the comparative affinity of different compounds to individual types of receptor to be determined via radioligand binding studies. For the purpose of the current study we have chosen the model proposed first by Pasternak and colleagues (Wolozin & Pasternak, 1981). This model suggests there is a common receptor labelled by either a prototypic delta agonist such as DADLE (D-Ala2, D-Leu5-enkephalin) or with a mu agonist such as morphine which has high affinity for morphine. This they termed the mu 1 receptor. The receptor labelled with a mu agonist which possessed a lower affinity they termed the mu 2 receptor. Similarly the receptor labelled with a delta agonist possessing lower affinity for morphine they termed the true delta receptor. It has been postulated that several of the adverse affects including respiratory depression of morphine are due to activation of the mu 2 or lower affinity mu opioid receptor (Pasternak & Wood, 1986). Using this classification it was therefore hypothesised that M6G has a lower affinity for the mu 2 receptor than morphine at least partially explaining the lower apparent toxicity seen in man. The aim of the current study was to investigate this hypothesis by comparing the receptor affinities of the two compounds by the use of radiolabelled binding studies on homogenised rat brain preparations. Materials and methods In this study the method of Yoburn et al. (1988)
was
adapted
to provide binding affinities, as expressed by the IC50, of morphine and M6G at each of the mu 1, mu 2, total mu and
delta receptors. The IC50 is defined as the concentration of morphine or M6G to displace 50% of the 3H-ligand specifically bound to the opioid receptor subtype. Tissue preparation
Binding studies were performed using homogenised brain (minus the hypothalami used by other investigators) preparations from Wistar rats weighing 200-300 g. The rats were decapitated, the brains removed and hypothalami dissected out, before being washed in ice-cold 10 mM Tris HCI (pH 7.4 at room temperature), damped dry and weighed. The brains were then minced with scissors and homogenised in 4 x w/v
RECEPTOR BINDING OF MORPHINE AND MORPHINE 6-GLUCURONIDE
ice-cold 10 mM HCl containing 0.32 M sucrose (Goldstein et al., 1971) using an Ultra Turrex tissue homogeniser (Janke and Kankel Ltd). The homogenates were kept standing on ice throughout the procedure. Homogenates were centrifuged at 1000 g for O min at 4°C to remove the crude nuclear pellet. The supernatant was removed and recentrifuged at 100,000 g for 90 min at 4°C. The supernatant was removed and the pellet (P2) resuspended in a minimal volume of 10 mM Tris HCl buffer. An estimation of the protein concentration was made by using a modified Lowry protein assay (Boerhinger Mannheim, Mk78). The P2 suspension was then diluted with -buffer to achieve a final protein concentration of 4 mg ml -. The P2 fractions were aliquoted and stored at 3OC for up to 3 weeks. -
Peptides DAGO, DSLET and DPDPE were obtained from Peninsula laboratories and 3H-DAGO and 3H-DSLET from Du Pont (UK) Ltd. Morphine sulphate was obtained from McCarthy Medical Ltd, UK, and M6G from Ultrafine Chemicals Ltd, UK. Assay procedure The list of synthetic enkephalin ligands used with their assumed receptor specifities is displayed in Table I. All assays for specific binding were performed in triplicate in 10 ml plastic test tubes and assays for total binding and nonspecific binding performed in quadruplicate using the following experimental procedure:
Total bindings ta assays) assays).
or
0.1
(i) 0.5 ml P2 (4 mg ml-'). (ii) 0.1 ml 3H-DSLET (1.5 nM) (mu 1 and delml 3H-DAGO (1.5 nM) (total mu and mu 2
(iii) 0.1 ml Tris-HCl buffer (pH 7.4 at room temperature). Vortex and pre-incubate in shaking water bath at 37°C for 5 min. (iv) 0.1 ml Tris-HCl buffer. Vortex and incubate in shaking water bath at 37°C for a further 15 min. Non-specific binding and delta assays) or and mu 2 assays).
(i) 0.5ml P2 (4mgml-'). (ii) 0.1 ml 3H-DSLET (1.5 nM) (mu 1 0.1 ml 3H-DAGO (1.5 nM) (for total mu
(iii) 0.1 ml DPDPE (20 nM) (mu 1 assay), 0.1 ml DSLET (5 nM) (mu 2 assay), 0.1 ml DAGO (5 nM) (delta assay) or 0.1 ml Tris-HCI buffer (total mu assay). Vortex and pre-incubate in shaking water bath at 37°C for 5 min. (iv) 0.1 ml DSLET (1 ILM) (mu 1 assay), 0.1 ml DAGO (1I 1M) (total mu and mu 2 assays) or 0.1 ml DSLET (1 ltM) (delta assay). Vortex and incubate in shaking water bath at 37'C for a further 15 min.
Specific binding
(i) 0.5 ml P2 (4mg ml-'). (ii) 0.1 ml 3H-DAGO (1.5 nM) (total mu and mu 2 assays) or 0.1 ml 3H-DSLET (1.5 nM) (mu and delta assays). (iii) 0.1 ml Tris-HCl buffer (total mu assay), 0.1 ml DPDPE (20 nM) (mu 1 assay), 0.1 ml DSLET
123
(5 nM) (mu 2 assay) or 0.1 ml DAGO (5 nM) (delta assay). Vortex and pre-incubate in shaking water bath at 37°C for 5 min. (iv) 0.1 ml DSLET (mu 1 and delta assays), DAGO (total mu and mu 2 assays), morphine or M6G standards at concentrations specified below, or 0.1 ml TrisHCl buffer. Vortex and incubate in shaking water bath at 37°C for 15min. Following the second incubation the procedure for all assays was identical. The reaction was stopped by the addition of 5 ml ice cold Tris-HCl buffer to all tubes. The resulting solution was filtered through Whatman GF/B glass fibre filters using a Baker 10 extraction system capable of filtering ten samples simultaneously. The filter was washed twice with 5 ml of 10 mM Tris-HCl buffer and placed in scintillation bottles with 5 ml scintillant fluid (Ecoscint, National Diagnostics). Four unused filter papers were impregnated with 0.1 ml of the relevant 3H-ligand and added to four similar vials for the calculation of total counts. All vials are stored for 48 h prior to counting in a Tri-care liquid scintillation counter model 2425 (Hewlett Packard). Standards For all assays blocking agent concentrations were based on those suggested from studies of Yoburn et al. (1988). The concentration range of opiate standards ranged from zero, which gave 100% specific binding, to the concentration required which inhibited all specific binding of 3Hligand to the opioid receptor (binding equivalent to the NSB).
Validation procedures To confirm there was no biotransformation of morphine to M6G or vice-versa whilst incubation was in progress, after incubation some tubes were assayed by HPLC assessing morphine and M6G concentrations. In addition, to confirm the binding was actually at the opioid receptor, all assays were performed in the presence or absence of levorphanol (5 pM) or its inactive stereoisomer dextrorphan (5 pM). In order to determine that the P2 was the optimal fraction for use in the binding assays, all fractions produced during tissue preparations (P1, SI, P2 and S2) were assessed for opioid binding activity by their ability to bind the 3HDAGO ligand. Calculation of results The mean counts from the three or four tubes were calculated prior to the calculation of binding. The results are expressed as the percentage of specifically bound 3H-ligand vs concentration of opioid. Non-specific binding was defined as counts in the presence of 1 fLM non-radioactive enkephalin ligand.
% Total bound =
counts of zero standard (std) - NSB total counts
% Specific bound counts of zero std (of total binding) = counts of zero
% 3H-ligand bound
=
- NSB std
counts of std - NSB
x 100 x
100
x 100
From a plot of percentage 3H-ligand bound versus opiate concentration an IC50 was ascertained and the ICsOs of cold ligand (DAGO or DSLET), morphine and M6G compared to determine relative binding affinities at each receptor.
Table I List of synthetic enkephalin ligands used and their receptor
specificities Synthetic ligand DAGO ([D-ala2-MePhe4, Gly-ol5]-enkephalin) DSLET ([D-Ser2, Leu5]-enkephalin) DPDPE ([D-Pen2, D-Pen5]-enkephalin)
Receptor specificity mu 1 and mu 2 (total mu) mu 1 and delta
delta
124
D. HUCKS
et
al.
Statistical considerations The IC50 was obtained from each assay and the mean ICms of each compound compared for each receptor using the Mann Whitney U test to determine if a statistically significant difference in binding affinities was present. All mean results are quoted with the standard error of the mean (s.e.m.). Results
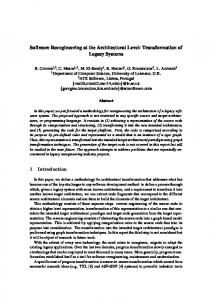
Table II demonstrates the mean IC5os for morphine and M6G obtained from a plot of % 3H-ligand bound versus concentration of unlabelled ligand, morphine and M6G for individual assays. Graphical representation of the results has been achieved by plotting the means of % 3H-ligand bound across all assays versus concentration in Figures 1 to 4. There was no significant difference in affinity at the mu 1 receptor as identified with 3H-DSLET and unlabelled DAGO, with the mean IC50 of morphine and M6G being 300 nmol -1' and 211 nmol 1' respectively. Figure 1 demonstrates that the affinity remained similar throughout the concentration range. Unlabelled DSLET bound with a higher affinity than either compound as expected as this is the enkephalin analogue defining this receptor. At the mu 2 receptor, however, the mean IC5o of morphine was 4.8 fold lower than that of M6G (17 nmol l' and 82 nmol 1' respectively) indicating a significantly increased affinity (P = 0.01) for this receptor. Figure 2 demonstrates this difference in affinity held for the whole concentration range over which binding occurs. The binding of morphine and M6G to the total mu (mu 1 and mu 2) was similar to that seen at the mu 2 receptor with mean IC50s of 13 nmol 1' and 94 nmol 1' (P = 0.01) respectively. Again this difference was maintained through out the concentration range tested (Figure 3). The initial results obtained in the delta receptor assay showed considerable variability despite strict adherence to experimental technique and hence a larger number of assays were performed to ensure a reliable result. There was no difference in binding affinities observed with the mean ICo of morphine 365 nmol 1- and of M6G 305 nmol 1` (Figure 4). There was no morphine or M6G found in the suspensions incubating the alternative compound with the receptor tissue. The results above are from experiments performed on whole brain minus hypothalami. Therefore a single assay for each receptor type was performed on P2 fractions of whole rat brain homogenate to ensure the absence of hypothalamus did not change the relative affinities of morphine and M6G. The IC50s obtained are summarised in Table III. Similar IC50s were obtained for both compounds at all mu receptors. However, in the delta assay there appeared to be a significant shift in IC_o for both compounds. However, the morphine: M6G IC50 ratios were similar. The presence of 5 jM levorphanol in the assays reduced the competitive specific binding of the 3H-ligand to 0% in the cases of the total mu and delta assays, to 1% in the mu 1 assay and to 28% in the case of the mu 2 assay. The inactive isomer dextrorphan, used at an equal molar concentration, resulted in a reduction of specific binding of 3H-ligand to 70% and 72% for the total mu and mu 2 assays respectively, while in the cases of the mu 1 and delta assays no inhibition was observed.
To obtain a sensitive radioreceptor assay it is necessary to the tissue fraction containing the highest concentration of receptors with the least overall protein content as the nonopioid protein will increase the non-specific binding of the 3H-ligand and hence reduce the sensitivity of the assay. Table IV demonstrates the mean c.p.m. per 2 mg of protein for each tissue fraction obtained during tissue preparation when a total mu assay was performed. The pellet (P2) obtained after ultracentrifugation was confirmed to have the largest differential between specific and non-specific binding and therefore was used in all assays. use
120 CD 1
00-
80
cn
I0
40c
20-
0i -
I1
|
..
..I
10 100 Concentration (nmol I-')
1000
Figure 1 Mu 1 receptor binding. Graph of % specifically bound x DSLET 3H-DSLET versus opiate concentration. (+ SEM); -0- Morphine (+ SEM); -*- M6G (+ SEM). CD100.c
* 80O
< 600 I
I 40.2
0w
1
1
10 100 Concentration (nmol 1-1)
1000
Figure 2 Mu 2 receptor binding. Graph of % specifically bound 3H-DAGO versus opiate concentration. x DAGO (+ SEM); 0 Morphine (+ SEM); * M6G (+ SEM). 0m100 800