Noname manuscript No. (will be inserted by the editor)
Exploiting Latent Embeddings of Nominal Clinical Data for Predicting Hospital Readmission Denis Krompaß · Crist´ obal Esteban · Volker Tresp · Martin Sedlmayr · Thomas Ganslandt
Received: date / Accepted: date
Abstract Hospital readmissions of patients put a high burden not only on the health care system, but also on the patients since complications after discharge generally lead to additional burdens. Estimating the risk of readmission after discharge from inpatient care has been the subject of several publications in recent years. In those publications the authors mostly tried to directly infer the readmission risk (within a certain time frame) from the clinical data recorded in the medical routine such as primary diagnosis, co-morbidities, length of stay, or questionnaires. Instead of using these data directly as inputs for a prediction model, we are exploiting latent embeddings for the nominal parts of the data (e.g. diagnosis and procedure codes). These latent embeddings have been used with great success in the natural language processing domain and can be constructed in a preprocessing step. We show in our experiments, that a prediction model that exploits these latent embeddings can lead to improved readmission predictive models. Keywords Hospital Readmission, Latent Embeddings, Latent Factors, Logistic Regression, Neural Network Denis Krompaß Ludwig Maximilian University E-mail:
[email protected] Crist´ obal Esteban Siemens AG, Corporate Technology E-mail:
[email protected] Volker Tresp Siemens AG, Corporate Technology E-mail:
[email protected] Martin Sedlmayr and Thomas Ganslandt Friedrich-Alexander-University Erlangen-Nuremberg E-mail:
[email protected] E-mail:
[email protected]
1 Introduction Unscheduled readmissions are a general well-known problem of hospitals, health care providers and patients. In the US, nearly one fifth of discharged Medicare beneficiaries had to be readmitted within 30 days and the re-hospitalization was estimated to have produced $17.4 billion in costs in 2004 [12]. In the UK, the costs caused by unscheduled readmissions were recently estimated to £1.6 billion annually [18]. In France, approximately 14% of patients aged 75 years or older are readmitted unexpectedly within 30 days after discharge [15]. [6, 9, 19] discuss clinical readmissions in Germany, especially in the context of adverse drug reactions, diabetis mellitus and chronic heart failure. Besides the tremendous costs, unplanned readmissions also burden patients and prolong their suffering. It is a known fact that the percentage of the population that is 65 or older is growing, and as a consequence, the amount of incidences of chronic diseases and hospital admissions is growing as well. To cut costs, the average length of stay of inpatients has decreased, e.g. in the Europe member states from 8.2 days in 2000 to 6.9 days in 2010. Even though the decrease of length of stay is mostly caused by increased efficiency in the hospitals, there are concerns that this trend might lead to an increased risk that patients are discharged prematurely and have to be readmitted within a short period of time [15]. To counteract this scenario, there are initiatives to use readmission rates of hospitals as a metric for the quality of treatment, where hospitals that exceeds certain readmission rates will be penalized. Since 2012, the Hospital Readmission Reduction Program (HRRP) forces hospitals to pay penalties for higher readmission rates after medical and surgical discharges in the US. In the UK, the Department of Health guidance for the
2
National Health Service (NHS) proposed that in some cases no reimbursements should be paid to hospitals for emergency readmissions within 30 days [16]. For this reason, there is a great need for valid risk-adjustment methods that would allow hospital comparison and reimbursement calculations. Even though it is unlikely that hospital readmissions can be completely prevented, there is evidence that targeted interventions before or after discharge can reduce the risk of readmission [14, 11]. In order to specifically trigger transitional care intervention for high risk patients it would be highly desirable to have reliable tools or indicators for estimating the readmission risk. In this paper we propose an approach for predicting hospital readmission that exploits latent embeddings for nominal features from routinely collected medical data (like primary diagnosis or procedure codes). Employing latent representations of features has been recently shown to be quite successful in the domain of Natural Language Processing (NLP), where words are not solely represented by an existence indicator but as word vectors [13, 4, 10, 22]. In our experiments, we will compare logistic regression models using raw data in a binary format as inputs with models using latent embeddings as inputs. In addition, we will analyze different Feed-Forward Neural Network architectures, also with binary inputs and with embeddings. The paper is structured as follows: We introduce and describe our approach in the next section. In Section 3 we will describe our experimental setup and discuss our results. Related work is covered in Section 4. We conclude in Section 5.
2 Exploiting Latent Embeddings in Clinical Data Increasingly, routinely collected medical data is made available by hospitals for research purposes. The provided information mostly contains structured data and often reflects only partially the true conditions of the patients. For example, due to the internal processes the chronology and content of the recorded medical facts like diagnoses might not be accurate. In addition, the recorded data normally contains thousands of different codes that have to be treated as individual features. As suggested in this paper, a reparametrization of the observed data in form of latent variables can help to simplify the dependencies between the input features and the target variables. The new representation in a latent vector space can uncover similarities between features and additionally leads to a reduction of the feature space.
Denis Krompaß et al.
2.1 Notation In the following, capital letters like W or Wi will represent matrices, whereas lowercase boldface letters, e.g. w or wi , will denote column vectors. Scalars are represented as w or wi .
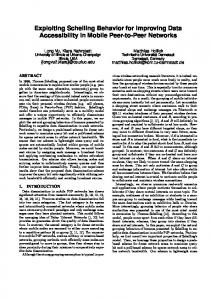
2.2 Data Representation We organized the clinical data in a n × m sparse matrix where each of the n rows contains the data of one patient stay (all data that was embraced by an admission and discharge code). The columns hold m features such as e.g. diagnosis and procedure codes, length of stay and age (details on the nominal features are provided in Table 1). Nominal data such as diagnosis (ICD10) or laboratory (LOINC) codes were represented as binary existence/non-existence values (see Figure 1 on the top). In our data, flags for laboratory (lab) measurements were provided that indicated if a measurement was normal, high or low. For this reason we represented the LOINC lab codes for each flag (normal, high, low) once (three times in total). In case of overlapping lab measurements in one stay (e.g. measurements taken at the admission day and before discharge) we considered only the most recent ones.
2.3 Constructing Latent Embeddings for Clinical Nominal Data In our approach, we pursue a similar idea as in [13] where the latent embeddings are computed through Principal Component Analysis (PCA) of the data cooccurrence matrix. Since the clinical data setup is different to the textual data setup, we had to slightly adapt this approach. We compute meaningful latent vector representations for complex nominal data like diagnosis codes through PCA of the nominal data covariance matrix, where the entries in the covariance matrix are computed from normalized values (centered and scaled to unit variance). Note that the covariance matrix can be directly computed without centering and scaling the original binary nominal data matrix first (which can be very expensive in memory), making this approach still applicable in the presence of a huge amount of patients (n >> m). The covariance matrix XCov is directly computed as XCov =
X T X − z · (µX ⊗ µX ) (z − 1) · σX ⊗ σX
(1)
where X is a sparse binary matrix of shape n × z representing the complex nominal data from the data matrix
Exploiting Latent Embeddings in Clinical Data
3
Patient X: Input-Vector For Current Stay Age
Length of Stay
Low Normal High Lab Lab Lab Procedures Values Values Values 1001 ... 1010 10...10 01...00 00...00 .. ... ... 11...00
Sex
Secondary Diagnoses 01010...0100
Therapy/ Medication Discharge Reason Admission Reason
Primary Diagnoses 01000...0000
Departments
Complex Nominal Data
1
65
10
Lookup of Latent Vectors
Lookup Table For Latent Embeddings
Normal Lab Procedures Values Secondary Primary Diagnoses Diagnoses max
max
vP
max
max
vNL
max
vHL
Discharge Therapy/ Depart- Admission Reason Medication ments Reason max
vLL
vD
max
vAR
max
vDR
max
vTM
Sex
vSD
Low Lab Values
Age
vPD
High Lab Values
Low Normal High Lab Lab Lab Values Values Values
Length of Stay
max
Procedures
Therapy/ Medication
Secondary Diagnoses
Discharge Reason Admission Reason Departments
Primary Diagnoses
Readmission Risk
Fig. 1 Schematic of the Logistic Regression approach proposed in this paper, where we exploit latent embeddings for complex nominal data as inputs. For numerical data such as age or length of stay or nominal data of low complexity, such as sex, no latent embeddings are exploited (top). For complex nominal data e.g. procedure or lab codes, the latent embeddings are looked up from a table of latent vectors which has been constructed in a pre-processing step through PCA (Section2.3). After the lookup, the latent vector representations that belong to the same category are combined through max-pooling before they are plugged into the logistic regression model together with the other parameters (bottom).
constructed in Section 2.2. µX is a vector containing the means of each column in X and σX the standard deviations, respectively. ⊗ denotes the outer vector product. Given the covariance matrix XCov of the nominal data, the latent embeddings for the nominal data are simply derived by Singular Value Decomposition XCov = V Σ 2 V T ,
(2)
where V holds the latent vector representations of the nominal features in its rows and will be used as lookup table in our model (Figure 1). The number of singular vectors used (i.e, the rank) is a hyper-parameter. In general, the required rank for a meaningful latent representation is significantly smaller than the full rank of the covariance matrix XCov . 2.4 Exploiting Latent Embeddings in the Model Given a lookup table V for latent vector representations for each nominal data feature (Section 2.3, e.g. the matrix V ) in the data, we have to find a way to exploit these latent vectors in a reasonable way in our model. In contrast to the textual data setting, the clinical data setting is substantially different. For many tasks
in the textual setting, like Named Entity Recognition, it often suffices to assume that a label or role of a word is solely dependent on the local context of the word. In that case, a labeling function is learned based on the data defined through a fixed words-window that embraces a constant amount of adjacent words in a sentence. In Semantic Role Labeling on the other hand, this assumption does not necessarily hold and a sentencewide approach is needed that often exploits convolutional layers. After convolution, the extracted local features are combined through max-pooling and subsequent neural network layers [4]. In the clinical data setting, the visits could be seen as a counterpart to sentences and clinical facts, like diagnosis or procedure codes as words, where adjacency is defined through time. Unfortunately, due to the data recording routines in a hospital, the correctly recorded chronological order of facts cannot be assumed in general. Therefore, a sliding-window based approach with a possible subsequent convolution would not make any sense in this context since no reliable definition of a neighborhood is available. As a possible solution, we propose to skip the convolutional approach, and combine the latent embeddings
Denis Krompaß et al.
directly through max-pooling. In other words, we are selecting only the most responsive latent features from the latent embeddings. In addition we are exploiting the structure of the nominal features, e.g. that we know that clinical facts fall into different categories like e.g. primary diagnoses, procedures or lab values (Figure 1). In this way, one latent representation for each category with respect to the complete visit of a patient is generated that is used as input for a subsequent logistic regression model. Note that in difference to the textual settings, we are not interested in labeling single facts (words) in a visit (sentence) but rather in labeling the whole visit. Numerical features (e.g. age, denoted as xage ) or nominal features of low complexity (sex), for which no latent embeddings are constructed, are used as model inputs as well. The probability of readmission is then given by the model as:
vP D ... vM T (3) P (y = 1|z, W, b) = σ(W z + b), with z = xsex xage xlos where σ is the logistic function, and e.g. vP D denotes the combined latent embeddings (max-pooling) for the primary diagnoses in one visit. The full procedure is illustrated in Figure 1.
2.5 Task-Dependent Fine-Tuning of Latent Embeddings In the model architecture shown in Figure 1, the lookup table for latent embeddings is built through PCA in a pre-processing step and stays fixed during model training. It might be beneficial to allow the latent embeddings to further adapt during model training with respect to the learning task of the model. This can be achieved, by integrating the whole approach into a neural network (NN), where we use the lookup table as initialization for the first hidden layer(s) in the network. All features without a latent representation are then fed directly into the second layer of such a net P (y = 1|x, V, wT , bV , bW ) = σ(wT h + bw ), φ(VP D xP D + bVP D ) ... φ(VM T xM T + bVM T ) , with h = xsex xage xlos
(4)
xPD
...
xMT
...
xSex xAge xLOS
4
Output Node
(a) NN architecture of equation 5 (NN2) Fig. 2 Schematic illustration of the two NN architectures exploited for predicting clinical readmission.
where φ(x) = max{0, x} denotes the rectifier activation function and e.g. xP D is a sub-vector of x that contains the primary diagnoses, a patient was labeled with during the visit. In accordance, VP D and bVP D are neural network weights and bias in the first layer for the primary diagnoses and wT and bw for the output node. In addition, we exploit a second network architecture, where we increased the complexity of the model by adding an additional hidden layer. This additional layer has the purpose to further extract features from the combination of latent embeddings and the non-latent features (age, sex, length of stay). By this we exploit a very similar neural network structure as used by [1] P (y = 1|x, V, G, wT , bV , bw , bG ) = σ(wT φ(Gh + bG ) + bw ), (5) where G and bG are the weights and bias for the second hidden layer. The NN architecture of Equation 5 is schematically illustrated in Figure 2, Equation 4 has a similar architecture, but the second hidden layer is omitted.
3 Experiments In order to show the benefits of latent embeddings for complex nominal data in the clinical domain, we constructed a simple experimental setup: We used a logistic regression model and provided it with two different sets of inputs. In the first case (referred to as binary model in the following), the nominal part of the data2 is coded as a binary existence/non-existence vector. In the second case (referred to as latent model), the nominal data 1 Admission and discharge reason, therapy (also medication) and department codes 2 Primary diagnosis, secondary diagnosis, LOINC Lab, therapies/medication, admission reason, discharge reason and department codes
Exploiting Latent Embeddings in Clinical Data
5
Table 1 Statistics of the datasets used in the experiments. CD10000 contains the complete data provided by University Hospital Erlangen. CD65 contains only stays from patients that had an age of at least 65 years at admission time. ”#Name” represents the number of unique codes present in the dataset. Dataset CD10000 CD65
Patients 10 000 4 022
Stays 26 128 13 693
Facts 5 903 573 2 525 424
#ICD10 3 240 2 759
#OPS 2 288 2 004
#LOINC 805 494
#Other 490 257
1
is processed as illustrated in Figure 1. Thereby the observed nominal features are replaced by latent vector representations that are used as input for the logistic regression. We assume that in this way we get a fair comparison of the two approaches since they only differ at the data input level. For the neural network models (NN1, NN2), we initialized the first layer with the same latent embedding matrix as used for the latent model. Therefore NN1 is similar to the logistic regression model with latent embeddings as input, but the latent embeddings are further adapted during the training of the model. For comparison, we added also two simple feed-forward neural networks with one (FFNN1) and two (FFNN2) hidden layers that take the same input as the binary logistic regression model. All neural network models were trained using adaptive gradient descent and dropout regularization [21] on the hidden layer weights. We also tried elastic net regularization but it lead to worse results.
Table 2 AUC and Logarithmic Loss scores for predicting readmission within one year after discharge.
3.1 Datasets and Evaluation Routine
LogLoss = −
CD10000 AUC LogLoss 0.754 0.586 0.756 0.583 0.750 0.591 0.752 0.589 0.753 0.590 0.752 0.596 0.761 0.578
Model Binary Latent NN1 NN2 FFNN1 FFNN2 Binary+Latent
CD65 AUC LogLoss 0.672 0.671 0.687 0.633 0.686 0.644 0.682 0.651 0.678 0.645 0.681 0.646 0.687 0.633
ral network approach 5% of the training set was used for early-stopping. For the latent-embeddings, PCA was only performed on the training set. For the final validation against the holdout set, we retrained the models on all data excluding the 20% holdout set, using the optimal parameter settings. We report the C-Statistic (Area under Receiver Operating Characteristic (AUC)) and the Logarithmic Loss or LogLoss (Equation 6) on the holdout set, with n
In the experiments, we used routinely collected data from patient records of the University Hospital Erlangen. The dataset includes anonymized structured patient data (partially administrative claims, e.g. ICD10 and OPS codes but also laboratory measurements results) from a selection of 10000 patients in inpatient care in the years from 2010 to 2012, where half of these patients are cancer patients and the other half was selected independently from the cause of their stay. In addition, all records regarding the time before 2010 were included for these patients. The dataset was provided in the context of the recently started German project Klinische Datenintelligenz funded by the Federal Government Department of Economics (BMWi). For our experiments we evaluated the models on the complete dataset and a subset that only contains patients of the age cohort of 65 years and older. Details of these datasets can be found in Table 1. For all datasets we followed the same evaluation procedure. We randomly split the data into three subsets, where 70% where used for model training, 10% for hyper-parameter tuning and 20% as a holdout set for the final validation of the model. In the case of the neu-
1X yi log(θi ) + (1 − yi ) log(1 − θi ). (6) n i=1
Here, θi is the prediction of the model. The C-statistics describes hereby how well the model is able to distinguish visits with and without a future readmission (higher is better). The Logarithmic Loss on the other hand additionally evaluates the returned probabilities for a future readmission (lower is better), and therefore the readmission risk prediction quality. Numerical features (age, length of stay) were centered and normalized to unit variance.
3.2 Results The performance of the logistic regression (latent and binary) or neural network models for predicting readmission within one year or 30 days after discharge on the two different datasets are shown in Table 2 and 3. For the two logistic regression approaches (binary and latent) the AUC values achieved by both models are comparable. They also agree with results reported in the literature (see e.g. [17]). In accordance to their observations, we also notice that the readmission risk prediction for older patients (65 years or older) seems
6
Denis Krompaß et al.
Table 3 AUC and Logarithmic Loss scores for predicting readmission within 30 days after discharge. Model Binary Latent NN1 NN2 FFNN1 FFNN2 Binary+Latent
CD10000 AUC LogLoss 0.779 0.438 0.790 0.421 0.786 0.427 0.783 0.429 0.785 0.428 0.787 0.439 0.795 0.416
CD65 AUC LogLoss 0.724 0.431 0.730 0.418 0.707 0.434 0.717 0.426 0.715 0.426 0.709 0.434 0.742 0.411
to be a harder task than predicting the risk for younger patients (CD65 in Table 2 and 3). In our case, also the readmission risk prediction within one year shows significantly worse results than predicting the readmission risk within the first 30 days after discharge. This can be seen best by comparing the LogLoss score which is generally approx. 50% higher when predicting readmission within one year. It can be inferred from Tables 2 and 3 that exploiting latent embeddings for the nominal clinical data, like diagnosis or procedure codes, leads to an improvement in both evaluation metrics for the logistic regression approach. Especially the readmission prediction within the first 30 days after discharge seems to profit from the latent embeddings, the AUC score improves from 0.779 (binary) to 0.790 (latent) and for patients that are above 65 years from 0.724 (binary) to 0.730 (latent). For predicting hospital readmission within one year, the model seems to only profit from latent embeddings when predicting the readmission for elderly patients (Table 2, CD65), hereby decreasing the LogLoss from 0.671 to 0.633 and increasing the AUC score from 0.672 to 0.687. With the neural network models NN1 and NN2 we investigated if a more complex approach can drive the prediction quality further. The results are shown below the dashed line in Table 2 and Table 3. As can be seen, none of the more complex neural networks increases the prediction quality. An explanation for this result might lie in the fact that, as typical for the clinical data setting, only a limited amount of data instances are available compared to the high dimensionality of the feature space. Predicting readmission within the first 30 days (Table 3) on the CD65 dataset is clearly worse with NN models than with the simpler logistic regression models. The amount of training instances in this dataset is halved but the amount of features is almost the same as in the complete dataset (CD10000), due to the increased amount of chronic diseases and co-morbidities in that age cohort. On the other hand, when simply combining the predictions (arithmetic mean) of the binary and latent logistic regression model (Binary+Latent in Table 2 and
3) we are able to improve the prediction quality in all experiments, thereby almost reaching the level for adequate genuine clinical utility [17] when predicting readmission within 30 days after discharge (AUC:0.795).
3.3 Clinical Relevance of Results As mentioned in Section 3.1, the dataset mostly contains patients with chronic diseases, where at least half are cancer patients. In accordance a certain bias towards these clinical phenotypes of the trained models cannot be avoided. In addition a population of 10000 patients is certainly not enough to fully evaluate the potential of the proposed models with respect to the complete clinical setting since the full complexity of all clinical phenotypes can simply not be covered. This especially applies for our dataset since patients with cancer or other chronic diseases often have many comorbidities that lead to a high diversity and complexity of the corresponding clinical phenotypes.
4 Related Work Vector Space Models (VSM) have been known for a long time in the Natural Language Processing domain where vector representations of documents or words have been shown to be very effective on various NLP tasks such as part of speech tagging or named entity recognition to name few [4, 10] (We refer to [22] for a comprehensive survey). [13] showed that complex deep learning methods are not necessarily needed for good word vector representations, but that the principal components of a Hellinger similarity matrix can suffice. For predicting hospital readmission risks [5, 2, 20] identify a small set of significant coefficients by stepwise regression approaches to construct easy-to-use scoring systems that rely on a parsimonious set of indicator variables. In contrast, there are also other approaches that do not exploit parsimony, but directly use clinical and administrative patient data in combination with logistic regression [8, 7, 3] or support-vector-machines [23] for prediction. Since clinical data is typically not openly accessible due to data privacy issues, a direct comparison to other works in this domain is rather difficult. Generally, the performance (C-statistic) reported for the different models ranges between 0.6 and 0.8.
5 Conclusion In this work we showed that latent embeddings for nominal data in patient records can improve the readmission
Exploiting Latent Embeddings in Clinical Data
risk predictions of patients after discharge. We further showed that more complex models like neural networks could not improve the prediction results in our experiments, most likely because of the imbalance between complexity and available training instances, which is typical for the clinical data setting. Additionally, we showed that the prediction quality can be further improved when combining a simple model that exploits latent embeddings with a conventional logistic regression approach. Nevertheless, additional data sources, like textual data and imaging data, might help to further improve prediction quality.
6 Acknowledgment The project receives funding from the German Federal Ministry of Economics and Technology; grant number 01MT14001A.
References 1. Y. Bengio, R. Ducharme, P. Vincent, and C. Janvin. A neural probabilistic language model. J. Mach. Learn. Res., 3:1137–1155, March 2003. 2. J. Billings, I. Blunt, A. Stevenson, T. Georghiou, G. Lewis, and M. Bardsley. Development of a predictive model to identify inpatients at risk of readmission within 30 days of discharge (parr-30). BMJ Open, 2012. 3. S. Choudhry, J. Li, D. Davis, C. Erdmann, R. Sikka, and B. Sutariya. A public-private partnership develops and externally validates a 30-day hospital readmission risk prediction model. Online Journal of Public Health Informatics, 5(2), 2013. 4. R. Collobert, J. Weston, L. Bottou, M. Karlen, K. Kavukcuoglu, and P. Kuksa. Natural language processing (almost) from scratch. Journal of Machine Learning Research, 12:2493–2537, 2011. 5. J. Donz´ e, D. Aujesky, D. Williams, and J.L. Schnipper. Potentially avoidable 30-day hospital readmissions in medical patients. JAMA, 173:632–638, 2013. 6. H. Dormann, A. Neubert, M. Criegee-Rieck, T. Egger, M. Radespiel-Troger, T. Azaz-Livshits, M. Levy, K. Brune, and E.G. Hahn. Readmissions and adverse drug reactions in internal medicine: The economic impact. Journal of Internal Medicine, 255:653–663, 2004. 7. O. Hasan, D.O. Meltzer, S.A. Shaykevich, C.M Bell, and et al. Hospital readmission in general medicine patients: A prediction model. J Gen Intern Med, 25:211–9, 2009. 8. C. Hebert, C. Shivade, R. Foraker, J. Wasserman, and et al. Diagnosis-specific readmission risk prediction using electronic health data: A retrospective cohort study. BMC Mediacal Informatics and Decision Making, 14, 2014. 9. V. Hendricks, S. Schmidt, A. Vogt, D. Gysan, V. Latz, I. Schwang, R. Griebenow, and R. Riedel. Case management program for patients with chronic heart failure. effectiveness in terms of mortality, hospital admissions and costs. Deutsches Aerzteblatt International, 111:264–70, 2014.
7 10. E.H. Huang, R. Socher, C.D. Manning, and A.Y. Ng. Improving word representations via global context and multiple word prototypes. In Annual Meeting of the Association for Computational Linguistics (ACL), 2012. 11. B.W. Jack, V.K. Chetty, D. Anthony, J.L. Greenwald, and et al. A reengineered hospital discharge program to decrease rehospitalization: A randomized trial. JAMA, 281:613–20, 1999. 12. S.F. Jencks, M.V. Williams, and E.A. Coleman. New England Journal of Medicine, (14):1418–1428. 13. R. Lebret and R. Collobert. Word embeddings through hellinger pca. In Proceedings of the 14th Conference of the European Chapter of the Association for Computational Linguistics (EACL), pages 482–490. Association for Computational Linguistics, 2014. 14. M.D. Naylor, D. Brooten, R. Campbell, B.S. Jacobsen, and et al. A comprehensive discharge planning and home follow-up of hospitalized elders: A randomized clinical trial. JAMA, 281:613–20, 1999. 15. OECD. Health at a Glance 2013: OECD Indicators. 2013. http://dx.doi.org/10.1787/health_ glance-2013-en. 16. Department of Health. Payment by results guidance for 2013-2014. London: Department of Health, 2013. 17. E. Ohman, C.B. Granger, R.A. Harrington, and K.L. Lee. Risk stratification and therapeutic decision making in acute coronary syndromes. JAMA, 286(7):876–878, 2000. 18. P. Robinson. Hospitals readmissions and the 30 day threshold. http://www.chks.co.uk/userfiles/files/ CHKS%20Report%20Hospital%20readmissions.pdf. 19. G. R¨ umenapf, S. Geiger, B. Schneider, K. Amendt, N. Wilhelm, S. Morbach, and N. Nagel. Readmissions of patients with diabetes mellitus and foot ulcers after infra-popliteal bypass surgery: Attacking the problem by an integrated case management model. European Jurnal of Vascular Medicine (Vasa), 42:56–67, 2013. 20. D. Smitht, A. Giobbie-Hurder, M. Weinberger, E.Z. Oddone, and et al. Predicting non-elective hospital readmissions: A multi site study. Journal of Clinical Epidemiology, 53:1113–1118, 2000. 21. N. Srivastava, G. Hinton, A. Krizhevsky, I. Sutskever, and R. Salakhutdinov. Dropout: A simple way to prevent neural networks from overfitting. Journal of Machine Learning Research, 15:1929–1958, 2014. 22. P. D. Turney and P. Pantel. From frequency to meaning: Vector space models of semantics. pages 141–188, 2010. 23. S. Yu, A. Van Esbroeck, F. Farooq, G. Fung, V. Anand, and B. Krishnapuram. Predicting readmission risk with institution specific prediction models. In ICHI, pages 415–420, 2013.