Winston K.G. Seah. Wei Li. School of Engineering and Computer Science ... irregularity can be used to provide a low-cost alternative to dedicated sensing ... as signal strength fluctuations at the receiver, and the degree of signal fluctuation ...
Exploiting Radio Irregularity in the Internet of Things for Automated People Counting Wei-chuan Lin
Winston K.G. Seah
Wei Li
School of Engineering and Computer Science Victoria University of Wellington, P.O. Box 600 Wellington 6140, New Zealand Email: {wei-chuan.lin, winston.seah, wei.li}@ecs.vuw.ac.nz
Abstract—The Internet of Things (IoT) is a new concept that refers to an Internet connecting not just computer systems but a plethora of systems, devices, and objects, collectively referred to as ”Things”, and encompasses technologies for identification and tracking, sensing and actuation, both wired and wireless communications, and also, intelligence and cognition. Wireless communications, which is an integral part of IoT, suffers from radio irregularity – a phenomenon referring to radio waves being selectively absorbed, reflected or scattered by objects in their paths, e.g., human bodies that comprises liquid, bone and flesh. Radio irregularity is often regarded as a problem in wireless communications but, with the envisioned pervasiveness of IoT, we aim to exploit radio irregularity as a means to detect people. We demonstrate how radio signal fluctuations arising from radio irregularity can be used to provide a low-cost alternative to dedicated sensing systems for indoor automated people counting.
I. I NTRODUCTION The Internet has grown beyond connecting computer systems and platforms that run applications to meet endusers’ computing and communication needs to connecting a plethora of systems, appliances, devices, objects, etc., collectively referred to as ”Things”, giving rise to a new paradigm known as the Internet of Things (IoT) [1]. Likewise, the technologies that the IoT encompasses extend beyond computation and communication, to identifcation and tracking, sensing and actuation, and even intelligence and cognition. Wireless communication will play a major role in providing connectivity in the IoT. When a radio frequency (RF) signal propagates within a medium, it may be reflected, diffracted, and scattered. Each effect occurs to a different extent in various media, depending on factors such as wavelength and intensity of the wave, thickness and physical composition (permittivity and permeability) of the medium. The human body comprises liquid, bone and flesh, which selectively absorb, reflect or scatter RF signals, leading to the phenomenon known as radio irregularity. Consequently, in the presence of human activity within a network, the radio irregularity phenomenon is seen as signal strength fluctuations at the receiver, and the degree of signal fluctuation exhibits a significant level of correlation to the level of human activity in the network [2]. Applications like automated people counting cannot tolerate false positives that result in overcounting, giving inaccurate data that are used for forecasting and resource allocation. People counting is extensively used in different industries,
including retail (stores, malls and shopping centres), colleges and universities, government facilities, government non-profits organizations, visitor centres, libraries, museums and art galleries. In the retail industry, it is a form of intelligencegathering that helps a retailer determine the percentage of visitors who actually make purchases. This is a key performance indicator of a store’s performance as compared to just looking at the sales data. It also helps the management to optimize the usage of staff resources, e.g. deploy more staff during peak periods and cutting down during lull periods in order to save wages. For building management purposes, people counting is used to ensure that the safe level of occupancy is maintained. With the emergence of IoT leading to pervasive wireless communication devices, radio irregularity which has often been viewed as a problem can instead be exploited for automated people counting with minimal additional hardware and installation costs. In the next section, we examine the related research on automated people counting with a focus on indoor use cases. We then present our approach to indoor automated people counting based on the signal fluctuations arising from radio irregularity. This is followed by the discussion of the experimental study and results obtained from tests carried out indoors within a building before concluding the paper. II. R ELATED W ORK The GreenSpace organization provides a guide to commercially available automated people counting technology [3] among which infrared beam counters, thermal counters and video/CCTV cameras are the commonly used indoor people counting technologies. A. People Counting Methods The simplest and possibly cheapest approach is a singlebeam infrared (IR) counter placed across an entrance. However, such a counter suffers from numerous drawbacks and is only suitable detecting someone passing, e.g. entering/leaving a shop. When multiple (IR) beams are deployed with careful placements strategies and coupled with wireless communications for transferring the acquired data to a base station computer that uses artificial intelligence techniques for processing, a more accurate and versatile people counting system can be realized [4].
People counters that use thermal imaging are typically mounted overhead and have the ability to simultaneously maintain separate counts for multiple people moving in two directions (in and/or out). The IR images captured by the heat detectors are then processed to determine the number of people [5]. Video-based people counters work on video streams obtained through video/CCTV camera which are then run through intelligent video-processing techniques to identify and count the people in the video. The accuracy of such approaches can vary according to the level of ambient lighting and background colour contrasts [6]. Hybrid approaches combining IR and video cameras, together with neural networks, have been proposed to improve the accuracy of visual-based automated people counting [7].
a) RSSI fluctuation without movement 100 Frequency (%)
80 60 40 20 0 −7
−6
−5
−4
−3
−2 −1 0 1 2 3 RSSI fluctuation (dB) b) RSSI fluctuation with movement
4
5
6
7
−6
−5
−4
−3
4
5
6
7
100 Frequency (%)
80 60 40 20 0 −7
Fig. 1.
B. Radio-based Detection and Counting Methods
III. D ETECTION
USING
3
RSSI Fluctuation Patterns [10]
B. Human Detection
Absolute RSSI (dBm)
Our proposed algorithms computes the fluctuation between the RSSI of packets received at a receiver. The absolute RSSI readings for packets recorded at the receiver over a period of time is shown in Fig. 2. From the absolute RSSI readings, the fluctuation of RSSI readings is calculated, as shown in Fig. 3. −60 −70 −80 −90
0
150
300
450
600
Fig. 2.
RSSI fluctuation (dB)
It was first reported in [8] that the shadowing effect caused by an object moving between two communicating wireless devices can be used for detection purposes. In particular, a human body comprises liquid, bone and flesh, that selectively absorb, reflect or scatter RF signals, leading to the phenomenon known as radio irregularity. The approach adopted by [8] and extended in [9] for outdoor people counting relies on the Received Signal Strength (RSS) level measured at the receiver. The reliance on (absolute) RSS values, however, has a drawback during deployment, which is the need to take into consideration other environmental factors like the impact of path loss and fading. It has been observed in [10] that human movement through the path of the radio signal causes the histogram of the absolute RSS values to become more spread; this is manifested quantitatively as higher standard deviation. However, the standard deviation varies significantly across environments, making it difficult to define a universal threshold to detect movement in terms of these first order statistics. While also exploiting the RSS spread caused by human movement, the approach adopted in [10] focused on the fluctuation in signal strength instead, in order to reduce the impact of other environmental factors. However, there are false positives reported in their results which are deemed to be acceptable in the intrusion detection application considered in that work.
−2 −1 0 1 2 RSSI fluctuation (dB)
750 900 1050 1200 1350 1500 1650 1800 Sample Index
Absolute RSSI reading
20 10 0 −10 −20
0
200
400
600
Fig. 3.
800 1000 Sample index
1200
1400
1600
1800
RSSI Fluctuation
RSSI F LUCTUATIONS
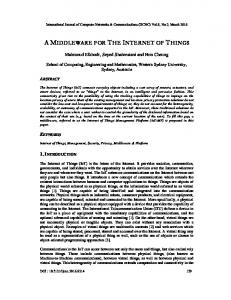
A. RSSI fluctuations caused by human activity In our approach, we extend the method of using RSSI fluctuations proposed in [10]. Two consistent patterns of RSSI fluctuations can be observed for two key scenarios of interest to us, namely, without human movement and with human movement across the signal transmission path, as shown in Fig. 1. The histogram of RSSI readings shows narrower distribution when there is no human movement across the signal path, i.e., there is less fluctuation across RSSI readings (Fig. 1a). On the other hand, the wireless signals fluctuate in the presence of human movement resulting in the spread out distribution of RSSI fluctuation shown in Fig. 1b.
We then define a sliding window of n samples, where n is a parameter that can be tuned to achieve the desired accuracy for the target environment. In our example, a sliding window of size n = 10 is used to observe the behaviour of RSSI fluctuation. Therefore, a window of RSSI fluctuations at sample 200 is shown in Fig. 4. At sample 200, using the window of 10 previous readings, the mean and standard deviation are computed as 0.2727 and 4.6280 respectively. We then map the RSSI fluctuations into the normal distribution with the mean and standard deviation for that window, i.e. µ = 0.2727 and σ = 4.6280, as shown in Fig. 5a representing the case where the signal has been subjected to interference by human movement across its path. Similarly, the normal
RSSI fluctuation (dB)
10
Actual Movement 1.5
5
1
0
0.5
−5
0
−10 190
192
Fig. 4.
194 196 Sample index
198
200 −0.5
200
400
600
800 1000 Sample Index Inferred Result
200
400
600
RSSI fluctuations over a window size of 10
1200
1400
1600
1200
1400
1600
1.5 1 Probability Between Limits = 0.17078
Probability Between Limits = 0.84303
0.5 0.6
0.6
0.5
0.5
0.4
0.4
0.3
0.3
0.2
0.2
0.1
0.1
0 −15
−10
−5 0 5 RSSI fluctuation
10
(a) Sample 200 (movement) Fig. 5.
15
0 −2
0 −0.5
Fig. 7.
−1
0 1 RSSI fluctuation
2
800 1000 Sample Index
Inferred presence of human movement using RSSI Fluctuations
3
(b) Sample 600 (no movement)
Normal distribution showing probability in fluctuation range [-1,1] (a) False positives by detection method in [10]
Probability betwen [−1 1]
distribution of RSSI fluctuation at sample 600, where there is no movement, is shown for comparison in Fig. 5b. From the graphs, we compute the probability of the RSSI fluctuation falling within the range [-1,1] (i.e. area under the curve from -1 to 1) to be 0.17078 for the case where there is movement across the signal path (i.e. sample 200) and 0.84303 for the case where there is no movement (sample 600). For the dataset shown in Fig. 2, we compute the probability of falling with the fluctuate range [-1,1] and plot the results as shown in Fig. 6. As shown, the probability of fluctuations falling in the range
Fig. 6.
1.5 1 0.5 0 −0.5
00:00
02:00
04:00
06:00
08:00
10:00 12:00 Time (mm:ss) inferred
14:00
16:00
18:00
20:00
22:00
actual
(b) Movement detected by our method Fig. 8.
Detection results using dataset of [10]
IV. P EDESTRIAN T RAFFIC M ONITORING Accurate detection of human movement is just the initial step to achieving the goal of automated people counting. The next step is the ability to infer that more than one person has crossed the area of interest.
1
0.5 0.3 0
A. Single transmitter-single receiver configuration 0
200
400
600
800 1000 Sample index
1200
1400
1600
1800
Probability of fluctuation within [-1,1] for RSSI readings in Fig.2
of [-1, 1] is below 0.3 in the presence of human movement. Hence, a probability value that is higher than 0.3 implies no human movement. Based on this threshold, we then infer from the results whether or not there has been human movement across the signal path, and the results are shown in Fig. 7. The approach used in [10] has resulted in false positives as shown in Fig. 8a. We applied our approach to the dataset used by the detection algorithm [10] that produced the results shown in Fig. 8a, and confirmed that our algorithm is able to achieve better accuracy in eliminating false positives, as shown in Fig. 8b.
First, a series of experiments were conducted to observe the precision of the detection algorithm in a realistic indoor environment, namely, a corridor in a university building, as shown in Fig. 9, where the two red dots indicated by the arrows refer to the transmitter/receiver pair using IEEE802.15.4 technology. The devices are spaced 1.5m apart (width of corridor) and placed at a height of 1.1m, on a ledge. Each data collection duration was 300 seconds with inter-packet interval time of 0.15 seconds, during which the number of people who have walked past the devices were recorded and tagged with the time. Fig. 10 shows the results for one data collection period, during which nine persons walked through individually and two pairs of people past while walking close to each other, at the sample index of 473 and 915. In the detection results, shown in Fig. 10, 11 movements were detected. It is clear that
Fig. 12.
One-Transmitter Two-Receiver Configuration Receiver 1
1.5
Fig. 9.
Deployment along corridor of building in university
1 0.5
Inferred Result 1.5
0
1 0.5
−0.5
0 −0.5
200
400
Fig. 10.
600
800
1000 Sample Index
1200
1400
1600
1800
50
100
150 Sample index Receiver 2
200
250
300
50
100
150 Sample index
200
250
300
2000
Detection of pedestrian traffic along corridor
1.5 1 0.5
detecting two people walking side by side is a major challenge as the fluctuations between one and two persons passing are quite indistinguishable.
0 −0.5
Fig. 13.
One person walking in the direction of R2 to R1
B. Single-transmitter multiple-receiver configuration In a pervasive network environment like IoT, it is not inconceivable to have numerous small wireless devices present. A conceptual deployment scenario like that shown in Fig. 11 can be assumed, and we look at a subset configuration of one-transmitter and two-receivers as shown in Fig. 12. Using the one-transmitter two-receiver configuration, the transmitter broadcasts packets at a rate of one packet every 0.15 seconds. Receiver R1 is 1.5m from transmitter T and R2 is 1.5m from R1 . As two persons walk along the path between T and the
Fig. 11.
Conceptual Configuration
two receivers in the direction shown in Fig. 12, they first cross the T-R2 signal transmission path, followed by the T-R1 signal path. A key point to note is the different signal interference zones that result from the movement of the two persons. First, we collected data for one person walking across the signal transmission path, passing first R2 then R1 to be used as the reference case. The detection results correctly show that one person passed at around the time of sample 100 and another at around sample 200, as shown in Fig. 13. Intuitively, the detection result at sample 100 is more logical since the person passed R2 first, then R1 . However, as the two receivers at very close to each other, having the two receivers showing signal fluctuations at almost the same instant is also likely especially when the person is walking fast. Next, we collected data for the case of two persons walking side-by-side in the direction of R2 to R1 as shown in Fig. 12. We expect that the detection duration of T-R2 should be longer than T-R1 . This is because the T-R2 signal experienced a longer duration of interference than the T-R1 signal. The detection result of two people walking from R2 to R1 shown in Fig. 14 confirms our hypothesis. However, we also observed a false positive detection at sample 64. As the two receivers are placed closed to each other, 1.5m apart, we can assume that it is unlikely for a moving object to be detected by
Receiver 1 1.5 1 0.5 0 −0.5
50
100
150 Sample Index Receiver 2
200
250
300
50
100
150 Sample Index
200
250
300
1.5 1 0.5 0 −0.5
Fig. 14.
Two people walking in the direction of R2 to R1 Receiver 1 : Optimised Result
1.5 1 0.5 0 −0.5
50
100
150 200 Sample Index Receiver 2 : Optimised Result
250
300
250
300
1.5 1 0.5 0 −0.5
50
Fig. 15.
100
150 Sample Index
200
Optimised Result of multiple receivers
one receiver but not the other. Therefore, by comparing and matching the data from both receivers, we can perform a simple optimization process to remove such false positive detections, to achieve the desired results as shown in Fig. 15.
V. C ONCLUSION The use of radio irregularity resulting from the movement of human objects crossing the path of a radio signal to detect human presence has been demonstrated previously and applied to intrusion detection [10]. We have improved the accuracy by eliminating the occurrence of false positives but noted that the ability to detect more than one person remains a challenge if we rely on the charateristics of one signal’s fluctuations. However, with pervasive networking brought about by the Internet of Things, the presence of numerous wireless communication devices allow us to study the fluctuations of multiple signals in close proximity of one another as a result of human interference and deduce the number of human objects that have crossed the paths of these signals.
In this paper, we have demonstrated the ability to detect two persons walking side-by-side along a typical 1.5m wide corridor using the fluctuations of two signals as the two human subjects pass. While the scheme in its current form requires further work to enhance its capabilities for detecting more than two human objects simultaneously, it presents an exciting opportunity to turn an existing indoor wireless communications network into a sensing system for automated people counting. From this study, we aim to show that the Internet of Things can be exploited for applications like automated people counting without the need for specialized hardware, like those already in use. However, our method is not aimed to completely replace the specialized hardware for automated people counting but more as a complement to improve the accuracy and extend the coverage with minimal costs. R EFERENCES [1] O. Vermesan et al., Internet of Things Strategic Research Roadmap. European Commission - Information Society and Media DG, 15 September 2009. [2] N. Patwari and J. Wilson, “RF Sensor Networks for Device-Free Localization: Measurements, Models, and Algorithms,” Proceedings of the IEEE, vol. 98, no. 11, pp. 1961–1973, November 2010. [3] GreenSpace, “A guide to automated methods for counting visitors to parks and green spaces.” [Online]. Available: http://www.greenspace.org.uk/downloads/greenSTAT/visitor monitoring guide.pdf [4] E. Mathews and A. Poigne, “An echo state network based pedestrian counting system using wireless sensor networks,” in Proceedings of the International Workshop on Intelligent Solutions in Embedded Systems, Regensburg, Germany, 10-11 July 2008, pp. 1–14. [5] J. Nakamura, Y. Tomita, and S. Honda, “Algorithm for counting the number of persons using ir image processing,” in Proceedings of the IEEE Instrumentation and Measurement Technology Conference (IMTC), Hamamatsu, Japan, 10-12 May 1994, pp. 220–223. [6] H. Celik, A. Hanjalic, and E. Hendriks, “Towards a robust solution to people counting,” in Proceedings of the IEEE International Conference on Image Processing (ICIP), Atlanta, GA, USA, 8-11 October 2006, pp. 2401–2404. [7] I. Amin, A. Taylor, F. Junejo, A. Al-Habaibeh, and R. Parkin, “Automated people-counting by using low-resolution infrared and visual cameras,” Measurement, vol. 41, no. 6, pp. 589 – 599, 2008. [Online]. Available: http://www.sciencedirect.com/science/article/B6V424R1MF05-1/2/214939e79cdc070f3e5fe6cca4b4000b [8] K. Woyach, D. Puccinelli, and M. Haenggi, “Sensorless sensing in wireless networks: Implementation and measurements,” in Proceedings of the 2nd International Workshop on Wireless Network Measurement (WiNMee 2006), Boston, MA, USA, April 2006. [9] D. Puccinelli, A. Foerster, A. Puiatti, and S. Giordano, “Radio-based trail usage monitoring with low-end motes,” in Proceedings of the 7th IEEE International Workshop on Sensor Networks and Systems for Pervasive Computing (PerSeNS), Seattle, WA, USA, 21 March 2011. [10] P. Lee, W. K. G. Seah, H. P. Tan, and Z. Yao, “Wireless sensing without sensors – an experimental approach,” in Proceedings of the 20th IEEE International Symposium on Personal, Indoor and Mobile Radio Communications (PIMRC), Tokyo, Japan, 13-16 September 2009.