International Journal of
Molecular Sciences Article
Exploration for the Salinity Tolerance-Related Genes from Xero-Halophyte Atriplex canescens Exploiting Yeast Functional Screening System Gang Yu 1 ID , Jingtao Li 1 , Xinhua Sun 1 , Yanzhi Liu 1 , Xueliang Wang 1 , Hao Zhang 2, * and Hongyu Pan 1, * 1
2
*
College of Plant Sciences, Jilin University, Changchun 130062, China;
[email protected] (G.Y.);
[email protected] (J.L.);
[email protected] (X.S.);
[email protected] (Y.L.);
[email protected] (X.W.) College of Resource and Environment, Jilin Agricultural University, Changchun 130062, China Correspondence:
[email protected] (H.Z.);
[email protected] (H.P.); Tel.: +86-431-8783-5659 (H.P.)
Received: 11 October 2017; Accepted: 15 November 2017; Published: 17 November 2017
Abstract: Plant productivity is limited by salinity stress, both in natural and agricultural systems. Identification of salt stress-related genes from halophyte can provide insights into mechanisms of salt stress tolerance in plants. Atriplex canescens is a xero-halophyte that exhibits optimum growth in the presence of 400 mM NaCl. A cDNA library derived from highly salt-treated A. canescens plants was constructed based on a yeast expression system. A total of 53 transgenic yeast clones expressing enhanced salt tolerance were selected from 105 transformants. Their plasmids were sequenced and the gene characteristics were annotated using a BLASTX search. Retransformation of yeast cells with the selected plasmids conferred salt tolerance to the resulting transformants. The expression patterns of 28 of these stress-related genes were further investigated in A. canescens leaves by quantitative reverse transcription-PCR. In this study, we provided a rapid and robust assay system for large-scale screening of genes for varied abiotic stress tolerance with high efficiency in A. canescens. Keywords: Atriplex canescens; salinity tolerance; yeast expression; halophyte; Gene Othology analysis
1. Introduction The world’s population is on track to grow from 7 to 9 billion in the next 50 years [1]. Securing the reliable production of staple crops to feed these people is the primary task of governments world-wide and is one of the most important concerns for state security. Abiotic stresses (such as drought, salinity and extreme temperature) negatively impact crop growth and productivity. High soil-salt concentrations not only impair the ability of plants to take up enough water for growth and development, but large amounts of Na+ and Cl− uptake negatively impacts growth by impairing metabolic processes and decreasing photosynthetic efficiency [2]. In the face of salt stress, plants use coordinated strategies to combat salt stress which associates with Reactive oxygen species (ROS) generation and detoxification pathways, signal transduction, osmo-regulation or ion homeostasis by osmoprotectants, and regulated expression of salt responsive genes and transcription factors [3]. Exogenous application of chemicals including compatible solutes and hormones, like glycine betaine, glutathione, polyamines, nitric oxide (NO), brassinosteroids (BRs) and salicylic acid (SA), were also reported as an effective approach to increase the salt resistance in certain plant species [4]. The identification of elements of salt stress resistance is still a major topic in plant breeding and genetic engineering. Currently, plant abiotic stress research is mainly focused on herbaceous plants, while abiotic stress resistance determinants in woody halophytes are as yet rarely investigated. Notably, Casuarina glauca, an actinorhizal plant with N2-fixing bacteria of the genus Frankia, is a good model Int. J. Mol. Sci. 2017, 18, 2444; doi:10.3390/ijms18112444
www.mdpi.com/journal/ijms
Int. J. Mol. Sci. 2017, 18, 2444
2 of 14
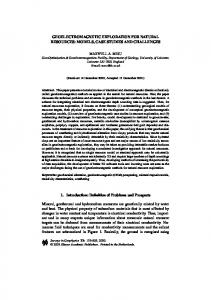
to investigate relationship among plant, abiotic stress and symbiotic microbes and its salt-resistant characteristics have been extensively characterized at the physiological level, such as photosynthesis, nitrogen metabolism, membrane integrity and antioxidative system and metabolome [5–8]. Halophytes have been considered to be an elite resistance gene resource, and research has become focused on isolation and functional characterization of their genes [9,10]. Whole genome sequence information of laboratory model plants including Arabidopsis thaliana, and Thellungiella salsuginea has made possible comparative analysis of a glycophyte (A. thaliana) and a haplophyte (T. salsuginea) [11]. Such comparative genomics and experimental analyses have demonstrated that gene families categorized to cation transport, abscisic acid signaling, and wax production in T. salsuginea might contribute to its success in stressful environments [11]. Another study focusing on physiological and proteomic analyses of salt stress responsive genes in the halophyte Halogeton glomeratus proposed that photosynthesis, energy production, ion homeostasis and oxygen radical scavenging enzymes are involved in maintaining homeostasis under conditions of salt stress [9]. Transcriptomics and subsequent microarray analysis identified genes involving in osmotic and ionic homeostasis, redox equilibrium and signal transduction during salt treatment of another halophyte Atriplex centralasiatica [12]. Advances in genome sequencing is driving a revolution in genomics, transcriptomics and proteomics analysis in the investigation of molecular and biochemical mechanisms that underpin biological functions and is providing strategies for crop improvement [13]. But the raw data provided by the “omics” approaches does not identify precise controlling factors in many of these biological processes. The elite halophyte Atriplex canescens (four-wing saltbush), a member of the Chenopodiaceae, is indigenous in arid and semi-arid areas of western North America. A. canescens exhibits tolerance to salinity, drought, heavy metals and low temperature and the plant has been employed in phytoremediation of saline–alkali and heavy-metal contaminated soils [14]. Therefore, the plant is a source of genes that could be employed in the genetic manipulation of crops for improvements in salt, drought and low temperature stress [14]. Yeast expression systems have been extensively used for protein functional characterization and protein production, combining advantages in rapid growth and facile genetic manipulation with the relevance of a eukaryotic expression system, such as capacity for post-translational modifications [15]. Some recent studies demonstrated that the yeast expression system is suitable to isolate genes responsible for salt-, drought-, and high temperature-resistance in Jatropha curcas, tomatos and Salicornia europaea, respectively [16–19]. Since little is known about molecular determinants and mechanisms for adaption to salt stress in woody halophyte A. canescens, we describe a yeast expression and screening system to rapidly and efficiently isolate salt-responsive genes from that source. 2. Results 2.1. Generation of the Yeast Expression cDNA Library A yeast expression library was constructed using the SuperScript full-length Library Construction Kit II, following manufacturer’s instructions (Figure 1). Approximately, 1.76 × 10⁶ colony-forming units (CFU) of E. coli transformants harboring A. canescens cDNA inserts by BP reaction were generated in pDONR222 with a recombinant rate of 91%. And the primary cDNA library was transferred to a yeast expressional destination vector pYES-DEST52 by LR reaction with a recombinant rate about 95% [20]. The size of cDNA inserts ranged from 0.6 to 2 kb and the average inserted fragment is sized above 1 kb (Table 1).
Int. Int. J.J. Mol. Mol. Sci. Sci. 2017, 2017, 18, 18, 2444 2444
33of of14 14
Figure illustration of cDNA librarylibrary construction and yeast functional screening. screening. Generally, Figure1.1.Schematic Schematic illustration of cDNA construction and yeast functional 400 mM NaCl treated A. canescens was subjected to RNA isolation and then cDNA library construction. Generally, 400 mM NaCl treated A. canescens was subjected to RNA isolation and then cDNA library The cDNA library pool was transformed into yeast cells subsequently treated withtreated salt under construction. The cDNA library pool was transformed intoand yeast cells and subsequently with induction Finally, the survived yeast was turned plasmid preparation the plasmids salt underconditions. induction conditions. Finally, the survived yeasttowas turned to plasmidand preparation and were sent for sequencing and bioinformatics analyses. the plasmids were sent for sequencing and bioinformatics analyses. Table Table1.1.General Generalinformation informationA. A.canescens canescensfull-length full-length cDNA cDNA library. library.Recombinant Recombinant rate rate represents represents the the percentage of cDNA inserts in plasmid checked by PCR and electrophoresis. percentage of cDNA inserts in plasmid checked by PCR and electrophoresis.
cDNA library cDNA library Primary cDNA library
Primary cDNA library Destination cDNA library Destination cDNA library
Vector Vector
CFU CFU
pDONR222
1.76 × 10⁶ 1.76 × 10⁶ 7 1.624 1.624××10107
pDONR222 pYES-DEST52 pYES-DEST52
Average AverageInserted Inserted Fragment Fragment >1>1kb kb >1>1kb kb
Recombinant Recombinant Rate Rate 91% 91% 95% 95%
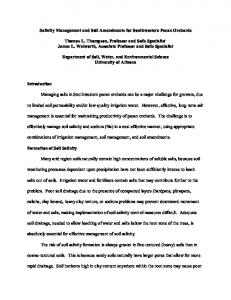
2.2. Identification of Salt Tolerance-Related Genes from A. canescens 2.2. Identification of Salt Tolerance-Related Genes from A. canescens From initial screening, 2 M NaCl was chosen to use as a stringent selection concentration (Figure From initial screening, 2 M NaCl was chosen to use as a stringent selection concentration (Figure 2). 2). As shown in Figure 3, 53 tolerant colonies were recovered (Figure 3) from approximately 1 × 10⁵ As shown in Figure 3, 53 tolerant colonies were recovered (Figure 3) from approximately 1 × 10⁵ yeast yeast transformants on the Synthetic Complete without Uracil (SC-U) medium containing 2 M NaCl, transformants on the Synthetic Complete without Uracil (SC-U) medium containing 2 M NaCl, and most of the yeast were not able to survive on 2 M NaCl plates. Plasmids isolated from all 53 saltand most of the yeast were not able to survive on 2 M NaCl plates. Plasmids isolated from all tolerant yeast transformants were back-transformed into E. coli for propagation and sequencing. 53 salt-tolerant yeast transformants were back-transformed into E. coli for propagation and sequencing. Insert sequences from all 53 yeast colonies were identified by BLAST analysis and the sequence Insert sequences from all 53 yeast colonies were identified by BLAST analysis and the sequence information were deposited in GenBank. Corresponding GenBank accession numbers are listed in information were deposited in GenBank. Corresponding GenBank accession numbers are listed in Table 2. Thirty-four out of these 53 cDNA sequence contain the full ORF (open reading frame) (Table Table 2. Thirty-four out of these 53 cDNA sequence contain the full ORF (open reading frame) (Table 2). 2). All of these genes are homologous to the known genes in the other plants. Gene ontology (GO) All of these genes are homologous to the known genes in the other plants. Gene ontology (GO) classification of the isolated genes was performed to identify the functional processes. Overall, these classification of the isolated genes was performed to identify the functional processes. Overall, these isolated genes were mainly membrane associated and with binding and catalytic activity categories isolated genes were mainly membrane associated and with binding and catalytic activity categories (Figure 4). (Figure 4).
Int. J. Mol. Sci. 2017, 18, 2444 Int. Int. J.J. Mol. Mol. Sci. Sci. 2017, 2017, 18, 18, 2444 2444
4 of 14 44 of of 14 14
Figure Figure 2. Optimization of of NaCl NaCl concentrations concentrations for for yeast yeast functional functional screening. screening. Yeast Yeast cells cells INVSc1 INVSc1 2. Optimization Optimization of NaCl concentrations Yeast cells harboring pYES-DEST and control were induced with 2% galactose and streaked on Synthetic control were induced with 2% galactose and streaked on Synthetic harboring pYES-DEST pYES-DESTand and control were induced with 2% galactose and streaked on Complete Synthetic Complete without Uracil (SC-U) and respectively. The were °C for hh without Uracil (SC-U) and SC medium, respectively. The plates were 28 ◦at C28 for h 72 and Complete without Uracil (SC-U) and SC SC medium, medium, respectively. The plates plateskept wereatkept kept at 28 °C72 for 72 and photographed. highlight in red) emerging colonies photographed. The The concentration (2M (2M NaClNaCl highlight in red) emerging yeastyeast colonies were and photographed. The concentration concentration (2M NaCl highlight in without red) without without emerging yeast colonies were for used used for screening. were used for screening. screening.
Figure Figure 3. Yeast transformants exhibited NaCl resistance on SC-U SC-U plates. INVSc1 competent cells were Figure 3. 3.Yeast Yeast transformants transformants exhibited exhibited NaCl NaCl resistance resistance on on SC-U plates. plates. INVSc1 INVSc1 competent competent cells cells were were transformed with library plasmid DNA and streaked on 2% glucose SC-U plate and incubated for 72 transformed glucose SC-U plate and incubated forfor 72 transformed with with library libraryplasmid plasmidDNA DNAand andstreaked streakedonon2% 2% glucose SC-U plate and incubated 555transformants were picked up hh at 28 °C. After yeast colony was visualized, more than 1 × 10 ◦ 28 28 °C. C. After yeast 72ath at After yeastcolony colonywas wasvisualized, visualized,more morethan than 11 ××10 10 transformants transformantswere were picked picked up randomly randomly and and induced induced with with 2% 2% galactose galactose for for 24 24 h, h, 22 μL μL transformed yeast yeast was was spotted spotted on on SC-U SC-U solid solid µL transformed ◦ Cfor plates 72 h and photographed. plates (2% (2% agar agar ++ 2% 2% galactose) galactose) with with 22 M M NaCl NaCl and and then then incubate incubate at at 28 28 °C °C for 72 h and photographed. for 72 h and photographed.
Int. J. Mol. Sci. 2017, 18, 2444 Int. J. Mol. Sci. 2017, 18, 2444
5 of 14
5 of 14
Figure 4. 4. Functional in A. A. canescens canescensseedlings seedlingsexposed exposed salinity. Figure Functionalcategorization categorization of of isolated isolated genes genes in to to salinity. Fisher’s exact test was used to indicate indicateaastatistically statisticallysignificant significant difference Fisher’s exact test was usedand andp p