Exploring City Development Modes under the Dual Control of ... - MDPI
Recommend Documents
Apr 26, 2017 - Carl Hansen Verlag: Munich, Germany, 2015. 6. ... Braun, U.; Schartel, B. Effect of Red Phosphorus and Melamine Polyphosphate on the Fire ...
May 29, 2018 - The most effective derivatives are (5b) and (7b) with terminal sulfapyridine and dihydroxy substituted phenyl fragments. Furthermore, the most ...
Jun 11, 2016 - call for the creation of more livable and sustainable urban environments ... Sustainability 2016, 8, 547; doi:10.3390/su8060547 .... However, by combining the best attributes of each program, LEED®-ND⢠.... LEED®-ND⢠sites with V
May 25, 2018 - method and the coordinated development degree model to .... as a distinctive âChongqing modelâ under the backdrop of more people and less ...
Oct 16, 2014 - the evolution process of border ports in China since the 1930s, in terms ..... as the five cities and municipal districts in the eastern region of Inner.
Feb 20, 2013 - cost of the project, based on Earned Value Management (EVM) and with regarding .... EVM and Work/Schedule/Cost/Integrated; in both of them.
processes anteriorly and posteriorly across their sisters, the ... for two posterior seam cells, V5 and V6, to generate rays. .... during late L1 and early L2 stages.
Mar 13, 2011 - Fred Lubben ... North West SLC: Amanda Smith, Dawn Jones ... Teachers' reported changes in their classroom teaching ..... and supporting CPD, the personal positive characteristics and levels of motivation .... science coordination (in
Oct 1, 2014 - Modes of Action and Therapeutics Application ... development of anti-PrP antibody compounds and discusses therapeutic candidates that.
May 7, 2018 - the multi-objective optimization of the power converter in the aircraft electrical power system. ... power peak in the circuit is increased, and the weight and volume of the transformer will ..... 400. 0.52. 0.654. 5. 350. 0.568. 0.645.
Oct 6, 2018 - A2x + B2y1 ⤠C2. A3x + B3y2 ⥠C3 yi ⥠0, i = 1, 2. (4). Assuming that x* is the optimal solution of the upper level, then it will be a constant in ...
the most used methods of joining sheet metals. ... aerospace because of the relatively low cost of the process. ..... Materials and Design 29, 1679â1684, 2008. [9.] ...
Sep 13, 2018 - The tenth paper by Konopka et al. [17] aims to ... All the papers in this Special Issue provide insights on how sustainable energy can be used to.
Feb 28, 2007 - Yang X, Bani MR, Lu SJ, Rowan S, Ben David Y, et al. (1994) The .... Worby CA, Simonson-Leff N, Dixon JE (2001) RNA interference of gene.
Oct 19, 2018 - by concentrating a magnetic field in a small circular region. ... toroidal resonance and external electromagnetic fields have become a subject of ...
Dec 21, 2015 - Dual-Track Mechanism of Market Socialism in China: ... from urban centers to fringes, while a large number of EGD still agglomerate close to urban ..... In this study, we call the region within FRR Zone I, the area between.
Apr 13, 2018 - Abstract: When controlling a Dual-Active-Bridge (DAB) DC/DC converter, the high frequency terminal current is usually measured for use in the ...
Dec 21, 2015 - Dual-Track Mechanism of Market Socialism in China: A Case Study ..... Study Area and Field Survey ..... jurisdictional service and management.
Jul 24, 2018 - This network is called a dual-hop multiple access relay network (MARN) ..... non-orthogonal to the transmission direction. This means that D = 0 ...
Jun 23, 2018 - Now, many firms are selling their products through both traditional retail (offline) and internet (online) channels, such as Panasonic, Lenovo.
(ii) Bank account based One Time Password (OTP):. Provided that where the mode ... IN. Page 1 of 1. Main menu. Displayin
Dec 18, 2018 - Keywords: new energy vehicle industry; sustainable development of ...... coordinated to create, distribute and transfer value, and then to form ...
Jun 6, 2018 - Goh, S.C.; Boopathy, S.R.; Krishnaswami, C.; Schlüter, J.U. Tow testing of Savonius wind turbine above a bluff body complemented by CFD ...
Jan 27, 2014 - School of Electrical Engineering, Kyungpook National University, 1370, Sankyuk-dong, Buk-gu, ..... linked 3D convergence industry promotion programâ through the Ministry of Trade, Industry & ... Radiology 1998, 208, 81â86.
Exploring City Development Modes under the Dual Control of ... - MDPI
Sep 4, 2018 - balance economic development, water and energy security, and environmental sustainability at the ... established to explore suitable development modes for future years. ... Water and energy have become two bottlenecks restricting .... to more than 95%, and the proportion of renewable energy will exceed ...
sustainability Article
Exploring City Development Modes under the Dual Control of Water Resources and Energy-Related CO2 Emissions: The Case of Beijing, China Yan Wang, Weihua Xiao *, Yicheng Wang Mingzhi Yang and Lishan Zhu
Abstract: Water and energy are basic resources for urban development. It is of extreme importance to balance economic development, water and energy security, and environmental sustainability at the city level. Although many studies have focused on energy-related CO2 emissions or water resources, individually, in relation to socioeconomic development, few studies have considered water and energy-related CO2 emissions as synchronous limiting factors. Here, taking Beijing as an example, a partial least squares STIRPAT model—a method that combines partial least squares with the STIRPAT (stochastic impacts by regression on population, affluence, and technology) model—was used to determine the main driving factors of water use and energy-related CO2 emissions at the regional scale from 1996 to 2016. The empirical results showed that the population, per capita gross domestic product (GDP), urbanization level, technology level, and service level, are all important factors that influence the total water use and energy-related CO2 emissions. Additionally, eight scenarios were established to explore suitable development modes for future years. Consequently, a medium growth rate in socioeconomic status and population, and a high growth rate in the technology and service level, were found to be the most appropriate development modes. This scenario would result in a total water use of 4432.13 million m3 and energy-related CO2 emissions of 173.64 million tons in 2030. The results provide a new perspective for decision makers to explore suitable measures for simultaneously conserving water resources and reducing energy-related CO2 emissions in the context of urban development. Keywords: partial least squares STIRPAT model; water resources; energy-related CO2 emissions; scenario analysis; Beijing
1. Introduction Water and energy have become two bottlenecks restricting sustainable socioeconomic growth [1]. The long-term requirement for water and energy is increasing with population and economic development, which has aggravated the global fragility of water and energy systems, both regionally and nationally, in the past few decades [2]. Water, energy, and environmental status are especially threatened in countries or regions experiencing high-speed economic and urbanization development. Among such countries, China is a typical instance in which water and energy status are particularly challenging for high-speed economic development and the aquatic ecosystems and environment are highly stressed [3,4]. Cities are gathering places where population, industry, and wealth are highly
concentrated, and large amounts of resources are consumed. In China, city regions account for 75% of the total energy consumption and are responsible for 85% of energy-related CO2 emissions [5]. Additionally, water resources are one of the main factors in urban economic development. The city development modes and policy choices have a significant impact on ensuring water and energy security and sustainable environmental development. To date, multiple studies have analyzed the impact of policy trends on the environment. For example, Yang et al. investigated the climate impact of U.S. policy choices based on the assumption of whether the U.S. follows its proposed nationally determined contribution and makes use of technological innovation [6]. Pan et al. studied the implications of different effort-sharing principles of China’s energy system transformation with regard to achieving the 2 ◦ C goals [7]. Feyera et al. developed the water evaluation and planning (WEAP) model to test various policy options to determine which one could achieve sustainable water use in Kenya [8]. We should choose appropriate city development modes to ensure not only city economic development, but also water and energy security and environmental sustainability. In addition, multiple studies have explored the driving forces of energy-related CO2 emissions to ensure energy conservation and emission reduction [9–11]. For example, Pao and Tsai forecasted the CO2 emissions, energy consumption, and economic growth in Brazil by applying a grey prediction model (GM) and autoregressive integrated moving average (ARIMA) model [12]. Meng et al. proposed a hybrid model for projecting energy-related CO2 emissions of China and compared the results with those from the GM [13]. Liddle presented the STIRPAT (stochastic impacts by regression on population, affluence, and technology) model to explore the carbon emissions elasticities for income and population, and found that the carbon emissions elasticity of income is highly robust, in contrast to the carbon emissions elasticity of the population [14]. Additionally, previous studies have investigated the relationship between social development and water resources. Chenoweth used scenario analysis to analyze whether the water resources of Israel, Palestine, and Jordan are adequate to enable social and social development in the future [15]. Wang et al. evaluated the impact of socioeconomic development on water resources use [16]. Jason Scott et al. selected fractional water allocation and capacity sharing as a method of allocating and managing water entitlements to encourage sustainable economic growth and social development in South Africa [17]. Zhao et al. explored the influencing factors of population, affluence, urbanization level, and diet structure on the agriculture product-related water footprint change based on an extended STIRPAT model to address China’s current water resource pressures [18]. Although these studies have forecasted future CO2 emission or water resources from different perspectives, and have provided meaningful policy implications, many studies have tended to regard water and energy security as isolated factors, rather than consider them in conjunction in formulating long-term policies. The newly born concept of the water–energy nexus has emerged over the past decade, and is closely related to population growth, urbanization, diminishing resources, and climate change [19]. Immense amounts of fundamental research have been conducted to analyze the link between water and energy, i.e., water is needed to produce energy, and energy is consumed to maintain a water supply. For example, He et al. evaluated the needed energy for various water supply sectors in 2020 and 2030 in China, and predicted that the urban domestic sector will overtake the agricultural sector as the most energy-intensive sector in 2030 [20]. Sun et al. investigated the water–energy nexus in the Beijing–Tianjin–Hebei region from the perspective of the electricity sector, and found that the insufficient water demand of power generation can be mitigated, to a certain degree, due to power structure adjustment and technological advancement, but that the trend towards water shortages cannot be avoided [21]. Lam et al. calculated and compared the energy consumption for water provision in thirty cities of the Middle East and North Africa [22]. However, most of these studies have concentrated on the physical linkages of water and energy resources to make planning and policy implications, and lack any integrated analysis exploring the common driving factors of the
Sustainability 2018, 10, 3155
3 of 16
two from the aspect of social development to ensure water and energy security, and environmentally sustainable development. Beijing, as the capital of China, has been facing a water–energy predicament in balancing the inherent tradeoffs among water and energy security, economic competitiveness, and environmental sustainability. According to the Thirteenth Five-Year Plan (2016–2020), The gross domestic product (GDP) growth is expected to average 6.5% per year from 2016 to 2020. The total water use will be controlled at 4.3 billion m3 , and the water intensity per unit of GDP will be reduced by over 30% relative to the standards proposed in the Eleventh Five-Year Plan (2006–2010). The total energy consumption will be capped at 76 million tons of standard coal, and the energy intensity per unit of GDP is slated to drop by more than 17% in 2020. The proportion of high-quality energy will increase to more than 95%, and the proportion of renewable energy will exceed 8% [23], to achieve peak carbon dioxide emissions as soon as possible. It is important to consider the development modes of Beijing under the dual control of water resources and energy-related CO2 emissions to fulfil future urban planning requirements. The specific objectives in the present paper are to (1) identify the significant common driving factors influencing water use and energy-related CO2 emissions in Beijing; (2) design scenarios with driving forces at different levels according to the results; and (3) select a suitable way to simultaneously conserve water resources and reduce energy-related CO2 emissions over the next fourteen years. 2. Materials and Methods 2.1. Study Area Beijing is the capital of the People’s Republic of China, and is located in the northern region of the North China Plain, adjacent to Tianjin and surrounded by Hebei province (Figure 1). The per capita GDP of Beijing was 16,789 USD in 2016, ranking second in China. The permanent population in 2016 was 21,729,000, and the urbanization rate reached 86.5%, which was second only to that of Shanghai in the whole country. The proportion of the tertiary industry exceeded 80% and reached 80.3% [24,25]. Advanced technology and the introduction or internalization of high-end talents have become the fundamental driving forces of Beijing’s economic development. The construction of cultural centers and science and technology innovation centers has been promoted steadily [26]. Beijing is located in the Haihe River Basin, where water resources are scarce. The average per capita reserves of water resources in Beijing were 161 m3 in 2016, or 1/60 of the global average [27]. The demand for water has already exceeded the supply capacity, due to the increase in urban population and economic development. The demand and supply balance have been maintained at the expense of the overdraft of groundwater, and has damaged the environment for many years [28]. The competition between supply and demand will become increasingly acute in the future as social development progresses. Additionally, the city has a small primary energy reserve and is a typical energy resource-poor city that relies heavily on foreign provinces [29]. Fossil energy accounts for up to 76% of the energy consumption structure. Energy is the basic resource of urban development and inevitably causes extensive CO2 emissions [24,30]; thus, it is imperative to explore future development modes for achieving the goals of resources conservation and environmentally sustainable development in Beijing.
Sustainability 2018, 10, 3155 Sustainability 2018, 10, x FOR PEER REVIEW
4 of 16 4 of 16
Figure Figure 1. 1. Simplified Simplified map map of of Beijing. Beijing.
2.2. Methodology Methodology Calculation of Energy-Related CO22 Emissions Emissions 2.2.1. Calculation Energy-related CO22 emissions emissions were were calculated calculated based based on on the 2006 Intergovernmental Intergovernmental Panel Panel on Energy-related Climate Change (IPCC, Geneva, Switzerland) Guidelines for National Greenhouse Gas Inventories as (IPCC, Geneva, Switzerland) Guidelines for National Greenhouse Gas Inventories follows [31]: as follows [31]: 44 ERCE = ∑ Ei × LCVi × CFi × Oi × (1) 4412 , 1 Ei LCVi CFi Oi ERCE i= , (1) 12 i 1 where ERCE represents the total energy-related CO2 emissions (million tons), Ei is the total energy consumption of fuel i (million tons), LCVi represents lower calorific i, CF unit emissions (millionvalue tons),ofEfuel i is the total energy where ERCE represents the total energy-related CO2the i is the calorific valueofoffuel the iith kind oftons), fuel in terms of carbon Oi is thevalue oxidation ofi is fuel and consumption (million LCV i represents thecontent, lower calorific of fuelrate i, CF thei, unit LCV × CF × Oofcontains the emission Allcontent, emission for fuel combustion this calorific value the ith kind of fuel infactors terms [32–34]. of carbon Oi factors is the oxidation rate of fuel in i, and study× were from et al. [35], and [32–34]. 44/12 is All the emission ratio of the molecular weights of CO2 in and C. LCV CF × obtained O contains theMi emission factors factors for fuel combustion this study were obtained from Mi et al. [35], and 44/12 is the ratio of the molecular weights of CO2 and C. 2.2.2. STIRPAT Model
2.2.2.The STIRPAT Model IPAT (Impact = Population × Affluence × Technology) model was first well-known established by Ehrlish and early 1970s× toAffluence detect the×driving forces of environmental The well-known IPATHoldren (Impactin=the Population Technology) model was first impact; the by model canand be described asthe follows: I = PAT I represents established Ehrlish Holdren in early 1970s to [36]. detectHere, the driving forcesthe of environmental environmental pressurethe (i.e., water use energy-related CO in ourI case study),the P environmental represents the impact; model can be and described as follows: I 2= emissions PAT [36]. Here, represents population size, A is affluence, and T refers to the technology level. The IPAT equation assumes pressure (i.e., water use and energy-related CO2 emissions in our case study), P represents the that I is affected byisthe three driving P,the A, and T, and that proportionality existsassumes betweenthat the population size, A affluence, and T factors refers to technology level. The IPAT equation variables, which limits the application of the model in nonproportional scenarios. To overcome this I is affected by the three driving factors P, A, and T, and that proportionality exists between the constraint,which Dietzlimits and Rosa proposed the STIRPAT which has a scenarios. stochastic To form that canthis be variables, the application of the model model, in nonproportional overcome expressed as follows constraint, Dietz and[37]: Rosa proposed the STIRPAT model, which has a stochastic form that can be I = aP b Ac T d e, (2) expressed as follows [37]: where a is the model constant; b, c, and d are the indexes c d of P, A, and T, respectively; and e is the error (2) I aPb AT e, term. Equation (2) is often converted to logarithmic form in empirical studies, as follows: where a is the model constant; b, c, and d are the indexes of P, A, and T, respectively; and e is the error ln I = ln + b ln P + c form ln A +indempirical ln T + ln estudies, as follows: (3) term. Equation (2) is often converted toalogarithmic
(3) ln I a b ln P c ln A the d lnSTIRPAT T ln e model to analyze their impact Additional driving factors can belnincorporated into on environmental pressure. To can obtain a deep understanding of the driving of water and Additional driving factors be incorporated into the STIRPAT modelfactors to analyze theiruse impact energy-related COpressure. Beijing, the understanding urbanization rate, which is defined proportion 2 emissions on environmental To in obtain a deep of the driving factorsas of the water use and energy-related CO2 emissions in Beijing, the urbanization rate, which is defined as the proportion of
Sustainability 2018, 10, 3155
5 of 16
of the total population living in the urban area, was introduced into the model to better reflect the population factor. The real per capita GDP was used to represent the affluence factor. The added value of tertiary industry relative to the real GDP was added to the model to reflect the impact of changes in service level on water use and CO2 emissions. Finally, the technology level factors included the water use intensity and energy intensity. The extended STIRPAT model can be described as follows: ln WU = ln a0 + a1 ln P + a2 ln UR + a3 ln A + a4 ln ST + a5 ln TW + ln e1 ,
(4)
ln ERCE = ln b0 + b1 ln P + b2 ln UR + b3 ln A + b4 ln ST + b5 ln TE + ln e2 ,
(5)
where WU represents the total water use (million m3 ), P is the population size, ERCE is the energy-related CO2 emissions (million tons), UR is the urbanization rate, A is affluence in terms of per capita GDP (104 USD), ST is the proportion of added value from tertiary industry, and TW and TE are the water use intensity and energy intensity, which are expressed as water use and energy consumption per unit of GDP, respectively (m3 /104 USD, tons of standard coal per 104 USD). 2.2.3. Partial Least Squares (PLS) Regression PLS regression is regarded as one of the most effective methods for eliminating the correlation between variables and is used for modeling under the condition of multicollinearity [38]. The steps of PLS are as follows [39]: (1) Normalize the dependent variable Y and independent variable X, and denote the resulting terms as F0 and E0 , respectively; (2) extract the first components t1 and u1 , which must carry the most variation information to represent X and Y as best as possible; and (3) establish a regression model such that t1 and u1 are the linear combination of x1 , x2 , . . . , xp and y1 , y2 , . . . , y3 . The calculation is ended when the prediction sum of squares (PRESSt ) achieves a minimum score, and the extracted t involves the optimal number of components. The variable important in projection (VIP) value is adopted to reflect the explanatory potential of each independent variable for each dependent variable, and can be calculated as follows [40]: s VIP j =
m p R ( I; th )w2h j ∑ Rd ( I; (t1 , · · · , tm ) h=1 d
(6)
where VIPj represents the VIP of xj (j = 1, 2, . . . , p), p is the number of independent variables, and w is the jth component of the wh -axis, which can be used to measure the marginal contribution of xj to tj , k
0
where ∑ w2hj = wh wh = 1 and h = 1, 2, . . . , m. j
2.3. Data The annual total population (P), per capita GDP (A), urbanization rate (UR), water use intensity (TW), energy intensity (TE), and percentage of added value from tertiary industry (ST) data were collected or calculated from the National Bureau of Statistics of China, Beijing Statistical Yearbook, and Beijing Energy Statistics Yearbook [23,41,42]. GDP was corrected for inflation to remove the factors of price changes in calculating economic aggregates, to facilitate the comparison of aggregates over time [43]. 3. Results and Discussion 3.1. Estimating Energy-Related CO2 Emissions in Beijing As shown in Figure 2, the total energy consumption in Beijing ranged from 37.35 to 69.62 million tons of standard coal from 1996 to 2016. The change trend of total energy consumption was mainly manifested in two stages. From 1996 to 2011, the total energy consumption increased relatively quickly, with an annual growth rate of 3.6%, showing a slight upward trend, while the growth rate
Sustainability 2018, 10, 3155 Sustainability 2018, 10, x FOR PEER REVIEW Sustainability 2018, 10, x FOR PEER REVIEW
6 of 16 6 of 16 6 of 16
of energy consumption gradually leveled off, with an average annual growth rate of 1.6% from 2012. of behavior energy consumption gradually leveled off, an average annual growth ratecapacity. of 1.6% from 2012. This is due to the transformation andwith upgrading of Beijing’s industrial In addition, of energy consumption gradually leveled off, with an average annual growth rate of 1.6% from 2012. This behavior is due to the transformation and upgrading of Beijing’s industrial capacity. In addition, theThis economic growth sharply, ending period of of double-digit growth.capacity. According to Figure 3, behavior is duechanged to the transformation andaupgrading Beijing’s industrial In addition, the economic growth changed sharply, ending a period of double-digit growth. According to Figure thethe energy-related CO2changed emissions in Beijing increasing trend from 33.96 million tons economic growth sharply, endingshowed a periodan of double-digit growth. According to Figure 3, the energy-related CO2 emissions in Beijing showed an increasing trend from 33.96 million tons to to 3, 129.62 million tons during the study period. The energy-related CO emissions increased the energy-related CO2 emissions in Beijing showed an increasing trend from 33.96 million tons toby 2 129.62 million tons during the study period. The energy-related CO2 emissions increased by 95.66 129.62 million tons during theHowever, study period. The energy-related 2 emissions by 95.66per 95.66 million tons in 20 years. the emissions intensity, CO which refers toincreased CO2 emissions million tons in 20 years. However, the emissions intensity, which refers to CO 2 emissions per unit of 4 USD), million tons in 20 years. However, the emissions intensity, which refers to CO 2with emissions per unit of unit of GDP (million tons/10 showed a significant downward trend an annual decline GDP (million tons/104 USD), showed a significant downward trend with an annual decline rate of 4 USD), showed a significant downward trend with an annual decline rate of GDP (million tons/10 rate of 6.42%, indicating that Beijing has achieved success in building a low-carbon economy 6.42%, indicating that Beijing has achieved partialpartial success in building a low-carbon economy and 6.42%, indicating that Beijing has achieved partial success in building a low-carbon economy and and developing clean energy. developing clean energy. developing clean energy.
Figure2.2.Total Total energyconsumption consumption and growth rate 2016. Figure ratein inBeijing Beijingfrom from1996 1996to 2016. Figure 2. Totalenergy energy consumption and and growth growth rate in Beijing from 1996 toto2016.
Figure 3. Energy-related CO2 emissions and CO2 emissions intensity in Beijing from 1996 to 2016. Figure 3. Energy-related CO2 emissions and CO2 emissions intensity in Beijing from 1996 to 2016. Figure 3. Energy-related CO2 emissions and CO2 emissions intensity in Beijing from 1996 to 2016.
3.2. Regression Analysis 3.2. Regression Analysis 3.2. Regression Analysis 3.2.1. Collinearity Diagnostics 3.2.1. Collinearity Diagnostics 3.2.1. Collinearity Diagnostics A correlation test was carried out to test the collinearity between variables. There existed a A correlation test was carried out to test the collinearity between variables. There existed a relatively high correlation betweenout variables, and collinearity most of the between absolute variables. values of the correlation A correlation test was carried to test the There existed a relatively high correlation between variables, and most of the absolute values of the correlation coefficients greater than 0.9 (Tables 1 andand 2). Then, ordinary leastvalues squaresof(OLS) method relatively highwere correlation between variables, most the of the absolute the correlation coefficients were greater than 0.9 (Tables 1 and 2). Then, the ordinary least squares (OLS) method
Sustainability 2018, 10, 3155
7 of 16
coefficients were greater than 0.9 (Tables 1 and 2). Then, the ordinary least squares (OLS) method was adopted to further test whether there existed multicollinearity between a given dependent variable and the independent variables. All variance inflation factor (VIF) values were greater than 10 (Tables 3 and 4), indicating that there was substantial multicollinearity among these variables. Therefore, the regression results based on OLS were unreliable, and could not reflect the relationship between the driving factors and the associated water use and energy-related CO2 emissions in Beijing. To eliminate the multicollinearity among variables, the PLS method was adopted to model the regression analysis. Table 1. Matrix of correlation between variables (water use).
lnWU lnP lnA lnUR lnTW lnST
lnWU
lnP
lnA
lnUR
lnTW
lnST
1 −0.512 * −0.623 ** −0.629 ** 0.652 ** −0.643 **
1 0.973 ** 0.953 ** −0.978 ** 0.933 **
1 0.974 ** −0.997 ** 0.979 **
1 −0.975 ** 0.935 **
1 −0.972 **
1
* Correlation is significant at the 0.05 level (2-tailed). ** Correlation is significant at the 0.01 level (2-tailed).
Table 2. Matrix of correlation between variables (energy-related CO2 emissions).
lnERCE lnP lnA lnUR lnTE lnST
lnERCE
lnP
lnA
lnUR
lnTE
lnST
1 0.987 ** 0.997 ** 0.977 ** −0.990 ** 0.967 **
1 0.973 ** 0.953 ** −0.982 ** 0.933 **
1 0.974 ** −0.989 ** 0.979 **
1 −0.948 ** 0.935 **
1 −0.968 **
1
** Correlation is significant at the 0.01 level (2-tailed).
Table 3. OLS results. Variable
Coefficient
t-Statistic
Sig.
VIF
−12.760 8.316 10.927 −1.020 15.813 −2.808
0.000 0.000 0.000 0.026 0.000 0.015
78.800 296.370 24.818 293.144 110.544
0.079 0.000 0.000 0.014 0.047 0.064
69.817 287.886 51.666 131.445 356.158
1. OLS results (water use) C lnP lnA lnUR lnTW lnST R squared F-statistic Sig.
Table 4. Cumulative variance explanation of the results by PLS analysis. PLS Component
Variance of X
Cumulative Variance of X
Variance of Y
Cumulative Variance of Y
Adjusted R2
0.974 0.009 0.006 0.010 0.001
0.974 0.983 0.989 0.999 1.000
0.377 0.332 0.100 0.040 0.126
0.377 0.709 0.809 0.848 0.975
0.342 0.674 0.773 0.808 0.966
0.972 0.986 0.991 0.998 0.999
0.994 0.003 0.001 0.000 0.000
0.994 0.998 0.998 0.999 0.999
0.994 0.997 0.998 0.999 0.999
1. Water use t1 t2 t3 t4 t5
2. Energy-related CO2 emissions t1 t2 t3 t4 t5
0.972 0.013 0.005 0.007 0.001
3.2.2. PLS Regression of the STIRPAT Model The PLS method was adopted to correct the STIRPAT model in the presence of multicollinearity among variables. By PLS theory, R2 X is the ability of the extracted principal components to interpret the independent variables X, and R2 Y is the ability to explain the dependent variable Y. When water use was the dependent variable and the number of principal components equaled 5, maximum values of R2 X (cum) = 1.000, R2 Y (cum) = 0.975 and adjusted R2 = 0.966 were attained, indicating that this scenario represented the best explanation of both the dependent and independent variables (Tables 4 and 5). Additionally, when energy-related CO2 emissions were the dependent variable and the number of principal components equaled 5, maximum values of R2 X (cum) = 0.998, R2 Y (cum) = 0.999 and adjusted R2 = 0.999 were found, indicating that this scenario represented the best interpretation of both the dependent and independent variables (Tables 4 and 5). Thus, both the independent variables and dependent variables could be interpreted by the principal components with a satisfactory regression. We can conclude from this result that the future total water use and energy-related CO2 emissions could be estimated based on the PLS-STIRPAT model (Table 5). The associated regression models can be defined as follows: ln WU = −18.390 + 0.975 ln P + 1.017 ln A − 0.194 ln UR − 0.215 ln ST + 0.965 ln TW
(7)
ln ERCE = −1.812 + 0.702 ln P + 0.748 ln A + 0.242 ln UR − 0.130 ln ST + 0.096 ln TE
(8)
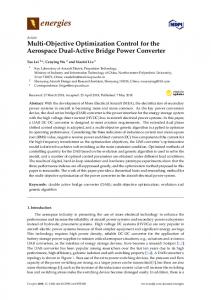
The VIP values, which reflect the importance of the independent variables to a dependent variable, are shown in Figure 4. These factors demonstrated similar importance in energy-related CO2 emissions, for which all the VIP values ranged within 0.985–1.019. The influences of the factors on energy-related CO2 emissions in Beijing were ranked as follows: lnP (1.019) = lnA (1.019) > lnTE (1.007) > lnUR (0.992) > lnST (0.985). However, when water use was considered as the dependent variable, the VIP values of the independent variables were distinct and ranged within 1.554−0.884. The influences of the factors on water use in Beijing were ranked as follows: lnTW (1.554) > lnP (1.152) > lnA (1.012) > lnST (0.894) > lnUR (0.880). The VIP values of the independent variables were all greater than 0.8, indicating that those variables were significant in explaining the dependent variable [44].
Sustainability 2018, 10, 3155 Sustainability 2018, 10, x FOR PEER REVIEW
9 of 16 9 of 16
Figure 4. VIP values. Figure 4. VIP values. Table Table 5. 5. Overview Overview of of the the PLS PLS regression regressionresults. results.
Variable Water UseUse (lnWU) CO 2 Emissions (lnERCE) Variable Water (lnWU) Energy-Related Energy-Related CO 2 Emissions (lnERCE) Constant −18.390 −1.812 Constant −18.390 −1.812 lnP 0.975 0.702 lnP 0.975 0.702 lnA 1.017 0.748 lnA 1.017 0.748 lnUR − 0.194 0.242 lnUR −0.194 0.242 lnTW/lnTE 0.965 0.094 lnTW/lnTE 0.965 0.094 lnST −0.215 −0.130 −0.215 −0.130 1.000 0.998 R2lnST X (cum) 2 Y(cum) RR2X 1.000 0.998 0.975 0.999 (cum) 2Y (cum) 0.966 0.999 Adjusted R2 R 0.975 0.999 Adjusted R2 0.966 0.999 3.3. Model Verification 3.3. Model Verification To further test the robustness of the STIRPAT model, both total water use and energy-related CO2 emissions from 2011 were calculated based on model, Equations (7)total and water (8), anduse compared with actual To further test to the2016 robustness of the STIRPAT both and energy-related values. The estimated values were almost equal to the actual values, and the average relative errors of CO2 emissions from 2011 to 2016 were calculated based on Equations (7) and (8), and compared with water and energy-related CO2 emissions wereequal 0.99%toand 6). Therefore, actualuse values. The estimated values were almost the1.29%, actualrespectively values, and (Table the average relative the PLS-STIRPAT model could be adopted forecast future total water use and energy-related CO6). errors of water use and energy-related CO2toemissions were 0.99% and 1.29%, respectively (Table 2 emissions Beijing. Therefore,inthe PLS-STIRPAT model could be adopted to forecast future total water use and energyrelated CO2 emissions in Beijing. Table 6. Comparison between actual values and estimated values of water use and CO2 emissions from to 2016 in Beijing. Table2011 6. Comparison between actual values and estimated values of water use and CO2 emissions from
2011 to 2016 in Beijing. Year
Year
Water Use
Water Use Estimated
Actual Values Values Actual (Million m3 ) Estimated (Million m3 )
Energy-Related CO2 Emissions
Energy-Related CO2 Emissions Relative Estimated Actual Values Relative Error Values (Million Actual (Million tons) Error (%) Estimated (%) Tons) Relative Relative Values
Values 97.23 99.84 2.65% (%) Error (Million (Million Tons) 0.61% 105.49 106.06 0.54% tons) 3608 0.83% 109.05 109.17 0.11% 3575 0.59% 97.23 99.84 2.65% 3711 1.01% 114.31 114.58 0.24% 3566 0.61% 105.49 106.06 0.54% 3855 1.70% 121.5 119.33 1.73% 3608 0.83% 109.05 109.17 0.11% 3832 1.21% 129.62 126.45 2.45% 2014 3749 3711 1.01% 114.31 114.58 0.24% 2015 3820 3855 of Water Use 1.70% 121.5 CO2 Emissions 119.33in Beijing 1.73% 3.4. Scenario Analysis and Prediction and Energy-Related 2016 3880 3832 1.21% 129.62 126.45 2.45% Scenarios aimed at estimating future water use and energy-related CO2 emissions were designed based on the PLS-STIRPAT model. Generally, population factors and affluence factors may lead to Values
3.4. Scenario Analysis and Prediction of Water Use and Energy-Related CO2 Emissions in Beijing Sustainability 2018, 10, 3155
10 of 16
Scenarios aimed at estimating future water use and energy-related CO2 emissions were designed based on the PLS-STIRPAT model. Generally, population factors and affluence factors may lead to anincreasing increasingtrend trendinintotal totalwater wateruse useand andCO CO emissions,while whiletechnology technologyfactors, factors,such suchas asenergy energy an 2 2emissions, intensity,water water intensity, service are negative factors have ainfluence negative intensity, useuse intensity, and and service level, level, are negative factors that maythat havemay a negative influence on dependent variables. Therefore, wethese divided these into variables into two and assumed on dependent variables. Therefore, we divided variables two parts, andparts, assumed that the that the trends of in variation in driving factors would bewithin consistent within each part. Additionally, trends of variation driving factors would be consistent each part. Additionally, considering considering that the rate urbanization Beijing has been high and remained almost stable that the urbanization of Beijingrate has of been relatively highrelatively and remained almost stable from 2010 to fromthe 2010 to 2016, the urbanization rate isinnot in thistrends study.ofThe future trends each 2016, urbanization rate is not considered thisconsidered study. The future each driving factorofwere drivinginto factor were dividedwith intodiverse three situations with diverse speeds: low high (L), medium and high divided three situations speeds: low (L), medium (M), and (H). The (M), combination The combination of these factors which formedare eight scenarios, Table 7,rates and the of(H). these factors formed eight scenarios, shown in Tablewhich 7, andare theshown annualinvariation of annual variation ratesinofTable each 8. factor are shown in Table 8. each factor are shown Thepredicted predictedtotal total water water use and from 2016 to to 2030 are The and energy-related energy-relatedCO CO2 2emissions emissionsininBeijing Beijing from 2016 2030 displayed in Figures 5 and 6. The total water use and CO 2 emissions will clearly continuously increase are displayed in Figures 5 and 6. The total water use and CO2 emissions will clearly continuously over theover nextthe fifteen scenario-specific total water usewater in 2030 ranked in ranked increasing increase nextyears. fifteenThe years. The scenario-specific total usecan in be 2030 can be in order as “S5”, “S4”,“S7”, “S6”,“S4”, “S2”,“S6”, “S1”,“S2”, “S3”,“S1”, and “S8”, corresponding values are 4432.13, increasing order“S7”, as “S5”, “S3”,and andthe “S8”, and the corresponding values 5236.39, 5576.53, 5956.89, 6194.79, 7047.16, 7794.33, and7794.33, 8866.78and million m3, million respectively. In addition, are 4432.13, 5236.39, 5576.53, 5956.89, 6194.79, 7047.16, 8866.78 m3 , respectively. energy-related CO2 emissions 2030 canin be2030 ranked as “S7”, “S5”, “S6”,“S5”, “S2”, Inthe addition, the energy-related CO2in emissions canin beincreasing ranked in order increasing order as “S7”, “S1”, “S4”, “S3”, and “S8”, which is a different order from that of predicted water use; the “S6”, “S2”, “S1”, “S4”, “S3”, and “S8”, which is a different order from that of predicted water use; corresponding values areare 162.36, 173.64, 182.32, 195.19, 206.59, 215.40, 230.72, and and 242.52 million tons, the corresponding values 162.36, 173.64, 182.32, 195.19, 206.59, 215.40, 230.72, 242.52 million respectively. tons, respectively.
Figure5.5.Predicted Predictedwater wateruse usein inBeijing Beijingfrom from2017 2017toto2030. 2030. Figure
Sustainability 2018, 10, 3155 Sustainability 2018, 10, x FOR PEER REVIEW
11 of 16 11 of 16
6. Predicted energy-related CO2 emissions in Beijing from 2017 to 2030. FigureFigure 6. Predicted energy-related CO2 emissions in Beijing from 2017 to 2030.
In the business-as-usual (BAU) scenario of S1, the total water use and energy-related CO2 3 and 206.59 million tons in 2030, respectively, will rise quickly(BAU) to 7047.16 millionofmS1, In emissions the business-as-usual scenario the total water use and energy-related CO2 3 representing a 78.96% and 59.39% increase, respectively, the valuestons in 2016. S2, with an emissions will rise quickly to 7047.16 million m andrelative 206.59to million in In 2030, respectively, emphasis on adopting innovative technology to improve water efficiency and energy efficiency, and representing a 78.96% and 59.39% increase, respectively, relative to the values in 2016. In S2, with an an increased focus on industrial restructuring, the total water use and energy-related CO2 emissions emphasis on adopting innovative technology to improve water efficiency and energy efficiency, and will reach 6194.79 million m3 and 195.19 million tons in 2030, respectively, or 13.8% and 5.8% less an increased focus on industrial restructuring, the situation total water use and energy-related CO2 emissions than the values for S1. Under a hypothetical with developing social and economic 3 will reach 6194.79 and million and 195.19 million tons 2030, respectively, or 13.8% andCO 5.8% less than prosperity rapidmpopulation growth in S3, theintotal water use and energy-related 2 may inevitably to rapid urban development. Thedeveloping predicted totalsocial water and use ineconomic 2030 is 7794.33 the values for S1.increase Underdue a hypothetical situation with prosperity million m3, which growth is a 25.8%inincrease relative that inuse S2, while the energy-relatedCO CO2 emissions and rapid population S3, the total towater and energy-related 2 may inevitably will be 230.72 million tons, a 10.35% increase over S2. In S4, the government of Beijing continues to increase due to rapid urban development. The predicted total water use in 2030 is 7794.33 million m3 , pursue prosperity in terms of social and economic development, while paying more attention to which iscontrolling a 25.8% the increase relativepressure to thaton inwater S2, while theand energy-related COwater 2 emissions environmental resources energy. The total use will will be 230.72 million tons, a 10.35% increase over S2. In S4, the government of Beijing continues decrease by 39.8%, while the CO2 emissions will be reduced by 7.1% relative to the values in S3.to In pursue S5, with a medium increase population and per capita while GDP, high technological innovation and prosperity in terms of social andin economic development, paying more attention to controlling 3 in 2030, which high industrialpressure structure on optimization, the total water use will beThe 4432.13 the environmental water resources and energy. totalmillion watermuse will decrease by is the minimum amongwill the eight scenarios, energy-related CO2 emissions be with a 39.8%, while the CO2 value emissions be reduced bywhile 7.1%the relative to the values in S3. will In S5, 173.64 million tons, which is the second-lowest value. Although the minimum energy-related CO2 medium increase in population and per capita GDP, high technological innovation and high industrial emissions appear in S7 with a value of 162.36 million tons, this scenario may be unacceptable, due to structure the total development, water use will be 4432.13 million the m3 annual in 2030, which is the minimum theoptimization, low speed of economic which cannot approach growth rate of 6.5% value among the eight while thePlan energy-related will million established in the scenarios, Thirteenth Five-Year (2016–2020) of CO Beijing as closely as S6 be can.173.64 S8 shows an tons, 2 emissions social development that focuses on rapid economic growth population which isextensive the second-lowest value.mode Although the more minimum energy-related COand emissions appear 2 expansion, investment and industrial Consequently, the total in S7 with a valueand ofneglects 162.36 technological million tons, this scenario may beadjustment. unacceptable, due to the low speed water use and energy-related-CO2 emissions in S8 reach their peak values among the eight scenarios. of economic development, which cannot approach the annual growth rate of 6.5% established in From this analysis, positive technology innovation and industrial restructuring have a significant the Thirteenth Five-Year Plan (2016–2020) of Beijing as closely as S6 can. S8 shows an extensive impact on reducing the total water use, while controlling economic growth and population expansion social development focuses more rapid economic growthis and population can effectivelymode controlthat energy-related CO2on emissions. This conclusion inconsistent with expansion, the and neglects technological investment and industrial Consequently, the total water use calculated VIP values. In general, socioeconomic statusadjustment. and population grow in the medium-increase mode, and high growth rates in in theS8 technology and peak servicevalues levels correspond to eight the most suitable From and energy-related-CO reach their among the scenarios. 2 emissions urban development mode under the dual control of water use and energy-related CO 2 in Beijing. In this analysis, positive technology innovation and industrial restructuring have a significant impact this urban development mode, the total water use will be 4432.13 million m3, and the energy-related on reducing the total water use, while controlling economic growth and population expansion can CO2 emissions will be 173.64 million tons in 2030, representing reductions of 37.1% and 18.9%, effectively control energy-related CO 2 emissions. respectively, relative to the BAU scenario in S1. This conclusion is inconsistent with the calculated VIP values. In general, socioeconomic status and population grow in the medium-increase mode, and high growth rates in the technology and service levels correspond to the most suitable urban development mode under the dual control of water use and energy-related CO2 in Beijing. In this urban development mode, the total water use will be 4432.13 million m3 , and the energy-related CO2 emissions will be 173.64 million tons in 2030, representing reductions of 37.1% and 18.9%, respectively, relative to the BAU scenario in S1.
Sustainability 2018, 10, 3155
12 of 16
Table 7. Future development scenarios for the city of Beijing. Scenario
Scenario Description
Affluence (A)
Population Size (P)
Technology Level (TW/TE)
Service Level (ST)
S1 (BAU)
This scenario is set as the basic situation. We assume that economic growth can meet the projections in the Thirteenth Five-Year Plan (2016–2020) and that the growth rate is slowly decreasing. Population growth has been consistent for the past five years and will gradually slow in the next decade. The technology level can meet the resource-saving targets, while the industrial structure follows the current development trend.
M
M
L
L
S2
S2 is based on S1, and emphasizes faster technical progress and an adjustment of the industrial structure to target resource saving.
M
M
M
M
S3
This scenario is based on S2 and focuses more on rapid development of the economy and population.
H
H
M
M
S4
The driving factors of per capita GDP and population remain high, and the CO2 emissions are controlled due to the application of energy-saving or water-saving technology.
H
H
H
H
S5
Relative to S4, medium economic-development and population-growth modes are adopted to reduce energy-related CO2 emissions.
M
M
H
H
S6
Risks and challenges lead to a decline in economic and population growth. Furthermore, the development of technology moves slowly.
L
L
L
L
S7
Relative to S6, S7 focuses more on environmentally friendly industries.
L
L
M
M
S8
This scenario attaches excessive importance to economic development and population growth while largely ignoring the pressure on the environment. This social development mode is unsustainable, and may lead to a waste of resources.
H
H
L
L
Sustainability 2018, 10, 3155
13 of 16
Table 8. Annual change rates for each factor in the L, M, and H scenarios (%). Years Variable
Scenario
P
2017–2020
2020–2025
2025–2030
L M H
0.5 1 2
0.25 0.5 1
0.15 0.25 0.5
A
L M H
5.5 6.5 7.5
3.5 4.5 5.5
1.5 2.5 3.5
TW
L M H
−5 −6 −7
−2.5 −3 −3.5
−1 −1.5 −2.5
TE
L M H
−3 −4 −5
−1.5 −2 −2.5
−1 −0.5 −1.5
ST
L M H
0.9 1.0 1.1
0.8 0.9 1.2
0.7 0.8 1.3
3.5. Uncertainty Analysis In the 2006 IPCC Guidelines for National Greenhouse Gas Inventories, two kinds of calculation methods were advanced for energy-related CO2 emissions: the reference method and the sectoral method. The reference method is a top-down approach that focuses on terminal energy consumption, and multiplies the associated factors by the emission factors of different fuels to obtain the total energy-related CO2 emissions, while the sectoral method is a bottom-up approach in which each department calculates the total carbon emissions and sums them to obtain the total carbon emissions. In this study, the energy-related CO2 emissions were calculated from terminal consumption of different fuel types, rather than aggregated from all economic sectors. The results of the two various calculation method may include gaps. Furthermore, we used the emission factors, which play a vital role in calculating carbon emissions, provided by Mi et al. [35]. In their study, they proposed that the default values recommended by IPCC overestimated China’s CO2 emissions. Therefore, uncertainties may exist in the calculated energy-related CO2 emissions. 4. Conclusions and Policy Implications In this study, the PLS-STIRPAT model was established to explore future development modes in Beijing under the dual control of water resources and energy-related CO2 emissions. The population, per capita GDP, urbanization rate, water (or energy) intensity, and the proportion of added value from tertiary industry were selected as the driving factors to predict the total water use (or energy-related CO2 emissions). The VIP values of all factors indicated that all these factors are important in influencing the total water use and energy-related CO2 emissions. Additionally, the scenario analysis results showed that the total water use and CO2 emissions will continuously increase over the next fourteen years. Additionally, under the dual control of water use and energy-related CO2 emissions, the most suitable urban development mode will enable the socioeconomic status and population to grow at a medium pace, and a high growth rate will be observed in the technology and service sectors. By 2030, the total water use will be 4432.13 million m3 , and the energy-related CO2 emissions will be 173.64 million tons. With its high-speed economic and urbanization development, Beijing will inevitably face pressures involving increased water demand and energy consumption. It is of prime importance to balance city economic development, water and energy security, and environmental sustainability. Based on our analysis, several suggestions are presented:
Sustainability 2018, 10, 3155
(1)
(2)
(3)
(4)
14 of 16
The per capita GDP is the most significant factor influencing Beijing’s energy-related CO2 emissions, and has a significant influence on water use. Economic growth is necessary to achieve the basic goal of national survival and development, but inevitably applies environmental pressure. To fulfil targets of water and energy security and environment sustainability, Beijing needs to consider controlling the economic growth within a reasonable range, and change the strategies of economic growth to incorporate high-quality patterns. Moreover, it is essential to establish related regulations and laws on resource production to balance economic development, and water and energy security. In terms of goals for cutting CO2 emissions and water security, population is another vital factor. Hence, it is recommended to continue to control the population size and attach importance to optimizing the population structure and quality in Beijing. Furthermore, the relevant authorities are suggested to enact efforts to raise people’s environmental awareness and encourage households to maintain sustainable consumption patterns. The technology factors, including energy consumption intensity and water use intensity, play prominent negative impacts on energy-related CO2 emissions and the total water use, respectively. Therefore, Beijing needs improved energy efficiency in energy-intensive industries, and to establish target-oriented responsibility systems and adopt low-carbon technology. Furthermore, it is recommended that government control be strengthened, and priority given to water conservation. Examples include adjusting crop configurations and promoting water-saving irrigation to improve water efficiency for agriculture, and improving the efficiency of cooling water (and reducing its use) to realize industrial water saving. In addition, the authorities concerned need to bring functions into full play to improve society’s independent innovation ability. For example, it is suggested that increasing investment in science and supporting multiple enterprises with independent intellectual property rights and independent innovation capabilities will vigorously develop water-saving and low-carbon technologies, and improve economic growth’s reliance on scientific-technical progress in Beijing. Water and energy are essential to human beings. However, policymaking efforts regarding optimization of the industrial structure, and ensuring water and energy security, are isolated from each other. It is of great important to improve policy integration related to these two resources. However, the research is still preliminary, and lacks specific energy use figures for the water sector. The preparation of the projections of energy use figures for the water sector are needed in the future. This study provides a theoretical foundation for Beijing to explore its city development mode under the dual control of water resources and energy-related CO2 emissions, and provides a new perspective for establishing water and energy security integrally in formulating long-term policies for policymakers in other cities or countries.
Author Contributions: W.X. conceived the idea and designed the study. Y.W. (Yan Wang) performed the analyses and wrote the paper. Y.W. (Yicheng Wang) helped with language editing. B.H. helped revise the paper; H.Y., X.Z. and M.Y. helped collect the data and conduct analyses; and L.Z. produced the figures. Funding: This research was financially supported by the National Key Research and Development program of China (2016YFE0102400) and the National Key Research and Development Program during the 13th Five-Year Plan, Ministry of Science and Technology, PRC (2016YFA0601500). Acknowledgments: The authors are grateful to Sylvia Guo and anonymous reviewers for their detailed comments, which have significantly improved the presentation of this work. Conflicts of Interest: The authors declare no conflict of interest.
References 1.
Gu, A.; Teng, F.; Lv, Z. Exploring the nexus between water saving and energy conservation: Insights from industry sector during the 12th Five-Year Plan period in China. Renew. Sustain. Energy Rev. 2016, 59, 28–38. [CrossRef]
Sustainability 2018, 10, 3155
2. 3. 4. 5. 6. 7. 8.
9. 10. 11.
12. 13. 14. 15. 16. 17. 18.
19. 20. 21. 22. 23. 24. 25. 26.
15 of 16
World Water Assessment Programme. The United Nations World Water Development Report 5: Water and Energy; United Nations Educational, Scientific and Cultural Organization: Paris, France, 2012. Liu, J.; Zang, C.; Tian, S.; Liu, J.; Yang, H.; Jia, S.; You, L.; Liu, B.; Zhang, M. Water conservancy projects in China: Achievements, challenges and way forward. Glob. Environ. Chang. 2013, 23, 633–643. [CrossRef] Zhang, X.; Hu, H.; Zhang, R.; Deng, S. Interactions between China’s economy, energy and the air emissions and their policy implications. Renew. Sustain. Energy Rev. 2014, 38, 624–638. [CrossRef] Dhakal, S. Urban energy use and carbon emissions from cities in China and policy implications. Energy Policy 2009, 37, 4208–4219. [CrossRef] Yang, S.; Liu, C.; Dong, W.; Chou, J.; Tian, D.; Wei, T.; Tian, Y. Quantifying the climate impact of the U.S. policy choices using an economic and earth system model. Sustainability 2018, 10, 1884. [CrossRef] Pan, X.; Chen, W.; Clarke, L.E.; Wang, L.; Liu, G. China’s energy system transformation towards the 2 ◦ C goal: Implications of different effort-sharing principles. Energy Policy 2017, 103, 116–126. Feyera, H.; Simon, D.; Ellen, D.; Emily, B.; Katrina, C.; Robert, H. Sustainable water use and management options in a water-stressed river basin in Kenya. In Proceedings of the 19th EGU General Assembly 2017, Vienna, Austria, 23–28 April 2017; p. 19151. Yeh, J.-C.; Liao, C.-H. Impact of population and economic growth on carbon emissions in Taiwan using an analytic tool STIRPAT. Sustain. Environ. Res. 2017, 27, 41–48. [CrossRef] Ibrahim, S.S.; Celebi, A.; Ozdeser, H.; Sancar, N. Modelling the impact of energy consumption and environmental sanity in Turkey: A STIRPAT framework. Procedia Comput. Sci. 2017, 120, 229–236. [CrossRef] Wang, C.; Wang, F.; Zhang, X.; Yang, Y.; Su, Y.; Ye, Y.; Zhang, H. Examining the driving factors of energy related carbon emissions using the extended STIRPAT model based on IPAT identity in Xinjiang. Renew. Sustain. Energy Rev. 2017, 67, 51–61. [CrossRef] Pao, H.T.; Tsai, C.M. Modeling and forecasting the CO2 emissions, energy consumption, and economic growth in Brazil. Energy 2011, 36, 2450–2458. [CrossRef] Meng, M.; Niu, D.; Shang, W. A small-sample hybrid model for forecasting energy-related CO2 emissions. Energy 2014, 64, 673–677. [CrossRef] Liddle, B. What are the carbon emissions elasticities for income and population? Bridging STIRPAT and EKC via robust heterogeneous panel estimates. Glob. Environ. Chang. 2015, 31, 62–73. [CrossRef] Chenoweth, J. Will the water resources of Israel, Palestine and Jordan remain sufficient to permit economic and social development for the foreseeable future? Water Policy 2011, 13, 397–410. [CrossRef] Wang, W.; Zeng, W.; Yao, B.; Wei, J. A simulation impact evaluation of social-economic development on water resource use. J. Water Reuse Desalin. 2014, 4, 137–153. [CrossRef] Jason Scott, H.; Andrew James, P.; Max, D. Managing water scarcity to encourage sustainable economic growth and social development in South Africa. Int. J. Water Resour. Dev. 2008, 24, 357–369. Zhao, C.; Chen, B.; Hayat, T.; Alsaedi, A.; Ahmad, B. Driving force analysis of water footprint change based on extended STIRPAT model: Evidence from the Chinese agricultural sector. Ecol. Indic. 2014, 47, 43–49. [CrossRef] Olsson, G. Water, energy and food interactions—Challenges and opportunities. Front. Environ. Sci. Eng. 2013, 7, 787–793. [CrossRef] He, G.; Zhao, Y.; Wang, J.; Li, H.; Zhu, Y.; Jiang, S. The water–energy nexus: Energy use for water supply in China. Int. J. Water Resour. Dev. 2018, 1–18. [CrossRef] Sun, L.; Pan, B.; Gu, A.; Lu, H.; Wang, W. Energy–water nexus analysis in the Beijing–Tianjin–Hebei region: Case of electricity sector. Renew. Sustain. Energy Rev. 2018, 93, 27–34. [CrossRef] Lam, K.L.; Kenway, S.J.; Lant, P.A. Energy use for water provision in cities. J. Clean. Prod. 2017, 143, 699–709. [CrossRef] People’s Government of Beijing Municipality. The Thirteen Five-Year Plan for Economic and Social Development of Beijing; Social Sciences Academic Press: Beijing, China, 2016. Beijing Bureau of Statistics. Beijing Statistical Yearbook 2016; China Statistic Press: Beijing, China, 2016. National Bureau of Statistics of China. China Energy Statistical Yearbook 2016; China Statistic Press: Beijing, China, 2016. Wu, J. The connotation and situation to build the national science and technology innovation center. Frontline 2014, 10, 91–93. (In Chinese)