Dec 21, 2011 - Welcome ... About; â¢; Contact Us; â¢; Alerts; â¢; Help · Visit us on Facebook · Visit us on YouTube · Visit us on Linked In · Follow us on Twitter.
Please cite this paper as:
Fleche, S., C. Smith and P. Sorsa (2011), “Exploring Determinants of Subjective Wellbeing in OECD Countries: Evidence from the World Value Survey”, OECD Economics Department Working Papers, No. 921, OECD Publishing. http://dx.doi.org/10.1787/5kg0k6zlcm5k-en
OECD Economics Department Working Papers No. 921
Exploring Determinants of Subjective Wellbeing in OECD Countries EVIDENCE FROM THE WORLD VALUE SURVEY
Sarah Fleche, Conal Smith, Piritta Sorsa
JEL Classification: A13, I3, P52
Unclassified
ECO/WKP(2011)90
Organisation de Coopération et de Développement Économiques Organisation for Economic Co-operation and Development
21-Dec-2011 ___________________________________________________________________________________________ English - Or. English ECONOMICS DEPARTMENT
ECO/WKP(2011)90 Unclassified EXPLORING DETERMINANTS OF SUBJECTIVE WELLBEING IN OECD COUNTRIES - EVIDENCE FROM THE WORLD VALUE SURVEY ECONOMICS DEPARTMENT WORKING PAPER No. 921
by Sarah Fleche, Conal Smith and Piritta Sorsa
All Economics Department Working papers are available through the OECD's internet website at www.oecd.org/eco/workingpapers English - Or. English
JT03313770
Document complet disponible sur OLIS dans son format d'origine Complete document available on OLIS in its original format
ECO/WKP(2011)90
ABSTRACT/RÉSUMÉ Exploring Determinants of Subjective Wellbeing in OECD Countries – Evidence from the World Value Survey The paper explores issues with assessing wellbeing in OECD countries based on self-reported life satisfaction surveys in a pooled regression over time and countries, at the country level and the OECD average. The results, which are in line with previous studies of subjective wellbeing, show that, apart from income, the state of health, not being unemployed, and social relationships are particularly important for wellbeing with only some differences across countries. The results also show that cultural differences are not major drivers of differences in life satisfaction. Correlations between the rankings of measures of life satisfaction and other indicators of wellbeing such as the Human Development Index and Better Life Index are also relatively high. Measures of subjective wellbeing can play an important part in informing policy makers of progress with wellbeing in general, or what seems to matter for wellbeing— health, being employed and social contacts-- beyond income. JEL codes:A13, I3, P52 Keywords: Wellbeing, comparative studies, welfare, health
+++++++ Examen des déterminants subjectifs du bien-être dans les pays de l'OCDE : une caractérisation basée sur le World Values Survey Ce document examine les questions liées à l’évaluation du bien-être dans les pays de l'OCDE à partir d’enquêtes de satisfaction de la vie auto-déclarée dans une régression sur un panel de pays avec une dimension temporelle, au niveau des pays et de la moyenne de l'OCDE. Les résultats, similaires à ceux d’études antérieures sur le bien-être subjectif, montrent que, en dehors de revenu, l'état de santé, ne pas être au chômage, et les relations sociales sont particulièrement importantes pour le bien-être, avec des différences limitées entre les pays. Les résultats montrent également que les différences culturelles ne sont pas les principaux facteurs de différences dans la satisfaction de la vie. Les corrélations entre les classements des mesures de satisfaction de la vie et d'autres indicateurs de bien-être tels que l'Indice de développement humain et l'Indice Vivre mieux sont également relativement élevées. Les mesures du bienêtre subjectif peuvent jouer un rôle important en informant les décideurs sur les progrès en termes de bienêtre en général, ou sur ce qui semble contribuer au bien-être – la santé, être employé et les contacts sociaux – au-delà des revenus. Classification JEL : A13, I3, P52 Mots-clés : Bien etre, etudes comparatives, sante Copyright © OECD, 2011. All rights reserved. Application for permission to reproduce or translate all, or part of, this material should be made to: Head of Publications Service, OECD, 2 rue André-Pascal, 75775 PARIS CEDEX 16, France.
2
ECO/WKP(2011)90 TABLE OF CONTENTS
EXPLORING DETERMINANTS OF SUBJECTIVE WELLBEING IN OECD COUNTRIES - EVIDENCE FROM THE WORLD VALUE SURVEY ...........................................5 Introduction ..................................................................................................................................................5 Measuring subjective wellbeing ..................................................................................................................7 Determinants of subjective wellbeing..........................................................................................................8 Income ......................................................................................................................................................8 Other determinants of subjective wellbeing .............................................................................................9 What drives subjective wellbeing empirically? .........................................................................................11 Pooled cross-country regressions ...........................................................................................................14 Comparisons across countries ................................................................................................................17 How sensitive are country rankings to variations in the determinants of life satisfaction? .......................22 Methodology ..........................................................................................................................................22 OECD average as reference ...................................................................................................................23 Other reference countries .......................................................................................................................26 Do the differences matter? .....................................................................................................................29 Conclusions ................................................................................................................................................31 BIBLIOGRAPHY .........................................................................................................................................32 ANNEX 1: DESCRIPTION OF THE VARIABLES .....................................................................................36 ANNEX 2: CORRELATIONS BETWEEN EXPLANATORY VARIABLES .............................................38 ANNEX 3: DESCRIPTIVE STATISTICS ....................................................................................................39
Tables 1. Selected wellbeing indicators.................................................................................................................13 2. Summary regression on determinants of life satisfaction ......................................................................15 3. Cross country comparisons of regressions coefficients with the OECD average, 1981-2008 ...............18 4. Correlation between predicted life satisfaction and other wellbeing indexes ........................................25 5. Changes in country rankings with different country coefficients ..........................................................26 6. Comparisons between different predicted life satisfactions and ranking of countries ...........................30
Figures 1. Changes in income and the Gini coefficient ............................................................................................6 2. Life satisfaction and GDP per capita across OECD countries, 2008¹ ......................................................9 3. Life satisfaction by country....................................................................................................................12 4. Predicted life satisfaction by country .....................................................................................................24 5. Survey life satisfation versus predicted life satisfation ..........................................................................28 A3.1. Descriptive statistics of some explanatory variables........................................................................39
3
ECO/WKP(2011)90
Boxes Box 1. Subjective wellbeing analysis is facilitated by improving data and methods ................................11
This document and any map included herein are without prejudice to the status of or sovereignty over any territory, to the delimitation of international frontiers and boundaries and to the name of any territory, city or area.
The statistical data for Israel are supplied by and under the responsibility of the relevant Israeli authorities. The use of such data by the OECD is without prejudice to the status of the Golan Heights, East Jerusalem and Israeli settlements in the West Bank under the terms of international law.
4
ECO/WKP(2011)90
EXPLORING DETERMINANTS OF SUBJECTIVE WELLBEING IN OECD COUNTRIES - EVIDENCE FROM THE WORLD VALUE SURVEY
by Sarah Fleche, Conal Smith and Piritta Sorsa 1 Introduction A fundamental concern of any government is the wellbeing of its citizens. To a large degree questions of public policy are either directly concerned with improving the wellbeing of citizens, or more indirectly with creating the conditions in which citizens are able to pursue their own conceptions of wellbeing. For the past 60 years wellbeing has been largely assessed through the lens of aggregate income, typically measured by GDP. However, there is now clear and compelling evidence that, for relatively wealthy countries, income is progressively less effective as a way of increasing wellbeing, and that many of the most significant drivers of wellbeing are unrelated to income. GDP measures the value of the goods and services produced within a country. It has long been acknowledged that this is inadequate, even as a measure of economic resources. Income flows due to assets held off-shore and payments to asset owners living off-shore, as well as the impact of transactions taking place outside the formal economy mean that GDP can differ significantly from the total income accruing to people living in a country. While some alternative national accounts aggregates can provide a better measure of the income accruing to a country2, the fact remains that such measures are inherently focused on total income. This omits the potentially significant impact of changes in the distribution of income (Figure 1) on wellbeing and, beyond this, the impact of a wide range of non-income related factors: nonmarket production, leisure, health, the state of the environment and the level of social cohesion which all impact on the wellbeing of people living in a society.
1.
Sarah Fleche was a Consultant in the Economics Department in 2010, Conal Smith is Economist in the Statistics Department and Piritta Sorsa is Head of Division in the Economics Department of the OECD. The authors would like to thank R. Boarini, Z. Brown, A. Dean, C. Exton, B. Ford, and M. Mira d’Ercole for valuable comments, Ane Kathrine Christensen for excellent statistical assistance and Olivier Besson and Deirdre Claassen for excellent secretarial assistance. The views expressed in this paper are not necessarily those of the OECD or its member governments.
2.
Gross National Disposable Income (GNDI) is a measure of the income accruing to people living within a country as opposed to the value of goods and services produced in a country (GDP).
5
ECO/WKP(2011)90 Figure 1. Changes in income and the Gini coefficient
Source: OECD calculations.
A range of alternative measures of wellbeing have been proposed to help assess progress and inform policy decisions. These include outcome based measures such as systems of key national indicators, composite measures such as the Human Development Index (HDI) (which is calculated as an average of log income, health outcomes, and educational outcomes) and various measures of “adjusted GDP” that attempt to revise GDP to take account of non-monetary factors that affect wellbeing 3. While these measures attempt to compensate for some of the shortcomings of GDP as a measure of wellbeing by taking a broader range of outcomes into consideration, they are open to criticism in that there is no clear empirical method for identifying the ‘correct’ weights to attach to each outcome area. Decisions about which measures to include and the relative weights to assign them are, in these cases, necessarily subjective, and are dependent on the assumptions of the index developers about what is important 4. Over the last decade measures of subjective wellbeing have been receiving more attention from economists 5. This reflects increasing evidence that such measures are valid and meaningful, and the fact that measures of subjective wellbeing provide an empirical way of looking at what is important to wellbeing that is grounded in individual preferences. Recently the Report by the Commission on the Measurement of Economic Performance and Social Progress, chaired by Joseph Stiglitz, Amartya Sen and Jean-Paul Fitoussi strongly reinforced this view, arguing that “subjective wellbeing should be measured separately to derive a more comprehensive measure of people’s quality of life and to allow a better understanding of its determinants (including people’s objective conditions)”.6 The high level of academic interest in measures of subjective wellbeing over the past decade combined with the increasing availability of better datasets have resolved many of the concerns that a sceptical mind might raise about the validity of measures of subjective wellbeing. However, there are some issues that remain unresolved. One potential criticism of measures of subjective wellbeing is that different 3.
e.g. The ‘Measure of Economic Welfare’ developed by James Tobin and William D. Nordhaus in 1972.
4.
This criticism applies to GDP also as a measure of wellbeing. In using GDP as a measure of wellbeing, one is essentially applying a weight of zero to all factors that don’t improve in line with aggregate income
5.
During the 1990s there was an average of less than five articles on happiness or related subjects each year in the journals covered by the Econlit database. By 2008 this had risen to over fifty each year.
6
Stiglitz, J. E., A. Sen and J.P. Fitoussi (2009), p216.
6
ECO/WKP(2011)90 cultural norms and values might make it impossible to meaningfully compare responses from one country with those in another. For example, it might be argued that the French culture of reflective self–criticism might result in a more “negative” set of responses than the same set of objective conditions would elicit elsewhere. Alternatively, even if response styles do not vary much between countries, it might be the case that the determinants of wellbeing are fundamentally different across countries. If either of these possibilities is true, one might be reluctant to use measures of subjective wellbeing as the basis for international comparisons. This paper briefly summarises the evidence in favour of the validity of measures of subjective wellbeing and then reviews what is currently known about the determinants of subjective wellbeing. Empirical estimates of the determinants of subjective wellbeing are then derived using data from the World Values Survey, and the relative size of the different factors driving wellbeing is discussed. The available evidence underscores that while income is clearly one of the factors that drives wellbeing, it is neither the only factor, nor necessarily the most significant. Following this, the paper considers the degree to which country rankings of average subjective wellbeing are sensitive to differences in the relative importance of the determinants of wellbeing across countries. This is achieved by calculating the expected level of subjective wellbeing for a range of OECD countries based first on regression coefficients derived from the OECD as a whole, and then on coefficients from country-specific regressions, and considering the degree to which there is a change in the rank order of countries by expected wellbeing. Measuring subjective wellbeing Although sometimes characterised as concerned with “happiness”, subjective wellbeing comprises several distinct concepts. In particular, an important distinction is usually made between evaluative measures of wellbeing that reflect some cognitive reflection on the part of the respondent and measures of affect, that capture the respondent’s emotional state at a particular point in time. Affect, in turn, has distinct positive (joy, happiness, contentment) and negative (sadness, anxiety, anger) components 7. While these concepts are correlated with each other and with evaluative measures in the expected way, the correlations are significantly less than 1 (Clark and Senik, 2011). The main focus of this paper is on life satisfaction, which is the most commonly used evaluative measure of wellbeing. Life satisfaction is of interest in this case both because it captures the same sort of evaluations that people use to make decisions about their lives (Kahneman, 1999), and also because of the existence of good international datasets8. Life satisfaction is typically measured via a question similar to the following from the World Values Survey: All things considered, how satisfied are you with your life as a whole these days? Using this card in which 1 means you are “completely dissatisfied” and 10 means you are “completely satisfied” where would you put your satisfaction with your life as a whole? 1
2
3
4
5
6
7
8
9
10
At a very general level, questions on subjective wellbeing have a degree of intuitive plausibility in that concepts such as “satisfaction” and “happiness” are subjects that people can easily relate to. In support of this, there is much evidence that people find it easy to respond to questions on subjective wellbeing. For example, subjective questions have lower non-response rates than in the case for many objective measures 7.
A fourth component, labelled eudaimonic wellbeing is also sometimes distinguished. Eudaimonic wellbeing captures notions of flourishing, meaning, and vitality distinct from satisfaction or current mood.
8.
These include the World Values Survey, the Gallup World Poll, the German Socio-Economic Panel, and the British Household Panel Study.
7
ECO/WKP(2011)90 such as income or consumption expenditure (Rässler and Riphahn, 2006). Similarly, people generally give similar answers to questions if they are repeated at another time (Krueger and Schkade, 2007). Measures of subjective wellbeing have been tested against a wide range of indirect measures of wellbeing, and generally show the expected relationship. For example, measures of subjective wellbeing correlate well with frequency of expression of positive emotions and with frequency of smiles – particularly ‘unfakeable’ or ‘Duchenne’ smiles (where the skin around the subject’s eyes ‘crinkles’ in response to automatic and largely involuntary muscle contractions). Biological measurements, including left/right brain activity, and levels of the stress hormone cortisol show a consistent relationship with selfratings of wellbeing. Finally, there is good evidence to suggest that subjective wellbeing predicts behaviour in a meaningful way. Subjective wellbeing measures predict risks of suicide, sociability, extroversion, quality of sleep, and happiness of close relatives (Diener and Tov, 2005). There is also evidence that these measures change in response to changed circumstances. For example, it has been shown that becoming disabled has a large and lasting impact on life satisfaction, and that the severity of this impact increases with the severity of the disability (Lucas, 2007). Determinants of subjective wellbeing From a policy perspective one of the key values of measures of subjective wellbeing is that they enable an empirical examination of the factors that drive it. Some authors have gone so far as to argue that these measures can be considered a proxy for an economist’s notion of utility (Helliwell and Leigh, 2010; Kahneman, Wakker, and Sarin, 1997), while others are more cautious (Becker and Rayo 2008). Regardless of whether one accepts that measures of subjective wellbeing are valid measures of utility, however, it is undeniable that they capture the impact of a broader range of outcomes than does looking income alone. For this reason measures of subjective wellbeing are valuable in that they provide a potential common metric for assessing the relative contribution of different factors, monetary and non-monetary 9. Income Much of the literature on subjective wellbeing focuses on the relationship between subjective wellbeing and income, as this is an area of obvious policy interest. This dates back to Richard Easterlin’s 1974 paper on the relationship between economic growth and happiness. In this paper he noted that, while richer individuals were happier than those with lower incomes, there is no evidence to suggest that average happiness increases over time in line with rises in GDP. This is the so-called “Easterlin Paradox”. Subsequent papers have largely confirmed and strengthened some of the key empirical observations underlying the paradox, but there remains fierce debate on how this empirical picture should be interpreted. There is a robust relationship between life satisfaction and log income at both the individual and cross country level (Sacks, Stevenson, and Wolfers, 2010, Helliwell, 2008), and this relationship is of a similar magnitude at both levels (a coefficient of approximately 0.3 on log income). There is less consensus, however, on whether an increase in income leads to an increase in life satisfaction over time, in part because of the relative paucity of sufficiently long time series on life satisfaction.
9.
Subjective wellbeing does not need to be a measure of utility as such to be valuable as a metric for assessing the relative importance of different outcomes. Although few economists would argue that income is a measure of utility as such, incomes can provide information on the relative weightings individuals attach to different goods or services traded in the market. Similarly, analysis of measures of subjective wellbeing can be used in a similar way to provide information on the relative weightings individuals attach to goods and services whether or not these are traded in the market.
8
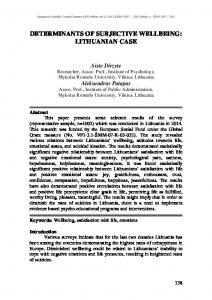
ECO/WKP(2011)90 A number of explanations have been advanced for the Easterlin paradox. Some authors have argued that the paradox arises because it is relative income that is important rather than absolute income. This would account for why richer individuals tend to have higher levels of life satisfaction than those with lower incomes, but increases in the overall wealth of society do not raise life satisfaction. A related idea is the possibility that people adapt to higher incomes over time. Thus, while increases in an individual’s income might have a short term impact on wellbeing, there is no long term impact. More recently it has been argued that the Easterlin paradox may partly be due to differences between evaluative measures such as life satisfaction and measures of affect, such has happiness. While there is a robust empirical relationship between life satisfaction and GDP per capita across countries (Figure 2), this relationship is much weaker for measures of affect (Diener, Kahneman, Tov and Arora, in Diner, Helliwell, and Kahneman, 2010). Richard Easterlin’s original 1974 article focused on measures of happiness, which are conceptually closer to affect than life satisfaction. Similarly, much of the subsequent literature has used measures of happiness to examine trends over time rather than measures of life satisfaction. It may be that life satisfaction increases with income, but that measures of affect- such as happiness do not. Figure 2. Life satisfaction and GDP per capita across OECD countries, 2008¹
1.
Life satisfaction is measured on an index scale from 0 to 10 of a person's satisfaction with life, from least to highest life satisfaction.
Source: Gallup World Poll, 2008 and OECD Economic Outlook 88 database.
Other determinants of subjective wellbeing Another possible reason for the lack of the expected relationship between income and life satisfaction over time is the potential impact of other confounding variables. While there is no doubt that an increase in income causes an increase in life satisfaction at the individual level (even if only for a while), it is clear that income is not the only, or even most significant driver of wellbeing. A number of other factors are equally, or more important(Helliwell, 2009). The most significant factors driving life satisfaction include health, employment status, and social contact. Health status has a major impact on life satisfaction, with the effect generally being stronger for measures of mental health than physical health (Dolan, Peasgood, and White, 2008). However physical ill-health is also important. Becoming disabled has been shown to have a large negative impact on life satisfaction that is not subject to adaptation over time (Lucas, 2007). While being employed, as opposed to retired or looking after a family is not associated with a strong effect on life satisfaction, being unemployed has a large, negative, and lasting impact on both life satisfaction and affect. This effect is much larger than that due to the loss of income associated with unemployment (Winkelman and Winkelman, 1998). At an aggregate level the unemployment rate has a negative effect on life satisfaction within countries at least half of that of the inflation rate (Di-Tella, 9
ECO/WKP(2011)90 MacCulloch and Oswald, 2001). Social contact is also strongly correlated with higher levels of life satisfaction and affect. Living in a stable relationship has an effect roughly a half to a third as large as that of being unemployed, although in the opposite direction. Other measures of social support and trust in others are also positively associated with life satisfaction (Helliwell, 2008). In addition to the relatively large effects associated with health, unemployment, social contact, and income, there are a range of other factors that correlate less strongly with subjective wellbeing. These include, but are not limited to, quality of governance (Helliwell, 2008), the extent of democratic engagement (Frey and Stutzer, 2000), low inflation rates (Di-Tella, MacCulloch and Oswald, 2001), and safety (Dolan, Peasgood, and White, 2008). In general, the range of factors identified as driving life satisfaction empirically are similar to the sorts of dimensions commonly identified as comprising wellbeing or quality of life. 10 That measures of subjective wellbeing, such as life satisfaction, largely reinforce our intuitions about what is important for wellbeing is reassuring both for the use of life satisfaction as a measure, but also with respect to the validity of objective indicators of wellbeing. While there is a substantial literature looking at the determinants of life satisfaction, the relationship between culture and subjective wellbeing is not yet well understood. Studies show that subjective wellbeing questions are understood in a similar way across cultures (Diener and Tov, 2005), and some authors have looked at whether the determinants of subjective wellbeing vary between countries. In particular, Helliwell (2010) examines this issue using data from the Gallup World Poll and World Values Survey, and concludes that while there are some differences between developing and developed nations, variation between individual countries is less significant. The country specific focus of this study, therefore, aims to answer the more precise question: how much do those differences between countries in the determinants of life satisfaction impact on how countries rank in terms of wellbeing.
10.
For example, the Sen/Stiglitz/Fitoussi commission identifies health, education, leisure time, political voice and governance, social connections, personal and economic security, material conditions, and the environment as elements of wellbeing.
10
ECO/WKP(2011)90 What drives subjective wellbeing empirically? The first step in understanding the differences in the determinants of subjective wellbeing across countries is to estimate their impact for the countries concerned. The empirical analysis relies on a dataset derived from the World Values Survey (WVS) and the European Values Study (EVS) covering 92338 respondents from 32 countries over the time period between 1994 and 2008. Apart fromthe dependent variable (life satisfaction) the data include: gender, age, income, marital status, education level, employment status, the number of children, perception of inequality, feeling of freedom, trust in people, self reported health status, and the importance of friends in life. The World Values Survey in collaboration with the European Values Study provides data for 87 countries for 5 waves of data (surveys undertaken between 1981-84, 1989-93, 1994-99, 1999-2004, 2005-08). Here, the sample includes 32 OECD countries in an unbalanced panel, as not all countries have data for all the waves (Box 1). We have omitted Chile and Mexico from the OECD sample, as notes to the WVS point out that some of the surveys in these two countries may not have included a representative sample of the country as they were largely collected in higher income cities. Box 1. Subjective wellbeing analysis is facilitated by improving data and methods Cross-country comparisons are facilitated by an increasing number of countries participating in international wellbeing surveys. The World Values Survey in collaboration with the European Values Study provides evidence on what people want out of life and what they believe in. To monitor these changes, the EVS/WVS has carried out five waves of surveys from 1981 to 2008. Representative national samples of each society’s public are interviewed, using a standardized questionnaire that measures changing values concerning religion, gender roles, work motivations, democracy, good governance, social capital, political participation, tolerance of other groups, environment protection and subjective wellbeing. Life satisfaction is defined by answers to questions like “all things considered, how satisfied are you with life as a whole these days?” on a scale from 1 to 10 with data on social characteristics of the respondents. The World Values Study does have some significant limitations. In particular, the sample size is relatively small for each country/wave, and the collection mode varies between countries and waves. Response rates for some country/waves are very low, raising concerns about non-response bias. Nonetheless, extensive analysis of the data over a period of more than a decade indicates that, despite these shortcomings, the picture provided by the World Values Survey is largely consistent with other available data sources.
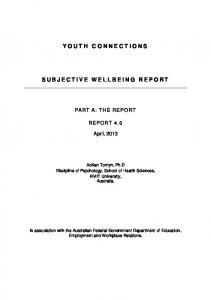
Life satisfaction varies a lot among the 32 countries in the sample across the time period from 1994 to 2008 (Figure 3). Denmark is clearly identified as the country where people are on average most satisfied with their lives with an average value of 8.2 on a scale that runs from 1 to 10. At the lower end of the distribution are Estonia, South Korea, Hungary, Slovakia, Spain and Turkey with averages between 5 and 6.5. The order in which the countries appear in the bar chart is quite stable over time and across other surveys such as the Eurobarometer or the Gallup World Poll.
11
ECO/WKP(2011)90 Figure.3. Life satisfaction by country
Source: WVS and OECD calculations.
The empirical analysis in this article is structured around the broad outcome domains used in the OECD’s How is Life? publication. This index reports on quality of life in 11 broad domains (Housing, Income, Jobs, Community, Education, Environment, Governance, Health, Safety, Work-Life Balance, life satisfaction) which, in turn, draws on the framework proposed by the Commission on the Measurement of Economic Performance and Social Progress. Individual level indicators are drawn from the World Values Survey dataset, and are supplemented by national level indicators from OECD databases where relevant. The national level variables used include unemployment rates as well as a measure of generalised trust in others, which is computed by averaging individual data on whether “most people can be trusted”.11 Income inequality is measured as the country average of perceived income inequality. Freedom of choice and control is also a country average as variation at an individual level does not capture meaningful information about the level of freedom and choice available in a society. In addition, the political and institutional environment is likely to affect wellbeing. The variable of interest is corruption which is measured by means of the Corruption Perception Index (CPI) and for which data is available on an annual basis. In the original dataset a value of 10 indicates that there is no corruption. However, to facilitate the interpretation of the slope coefficients in the estimations we rescale this measure as Corruption=10-CPI score. The last macroeconomic variable, which is included, is a measure of the state of the environment given that the environment can affect directly and indirectly wellbeing. This measure is collected from the World Bank’s World Development Indicators (WDI) emissions of air pollutants index (Table 1).
11.
In the original data set answer 1 is for “most people can be trusted” and 2 for “can’t be too careful”. However, to facilitate the interpretation of the slope coefficient in the estimations these measures were rescaled as 1 for ‘can’t be too careful and 2 for “most people can be trusted”. The national average is used as generalised trust in others is likely to be most useful in a social context where other people are also trusting rather than as an individual “good”.
12
ECO/WKP(2011)90 Table 1. Selected wellbeing determinants Domains / categories
Variables
Sources
Obs
Mean
Min
Max
1. Income
Log Income (ind) Income inequality (avg)
WVS WVS
80028 84508
1.4 5.3
0 3.6
2.3 6.8
2. Health
State of health (ind)
WVS
65767
2.1
1
5
3. Jobs
To be unemployed (ind) Unemployment rates (avg)
WVS OECD
94747 83863
0.1 7.3
0 1.9
1 20
4. Education
Educational level (ind)
WVS
91937
4.6
1
8
5. Environment
Environmental index (avg)
OECD
83069
100.0
72.7
146.4
6. Personal activities
Freedom of choice and control (avg)
WVS
89561
6.9
4.8
8.4
7. Community
Important in life: friends (ind) Trust in people (avg)
WVS WVS
66947 94255
1.6 1.7
1 1.3
4 2.0
8. Governance
CPI index (avg)
Transparency International
82518
3.1
0
7
9. Life satisfaction
Life satisfaction (ind)
WVS
92338
7.2
1
10
10. Individual controls
Gender (ind) Age (ind) Age squared / 100 (ind) Divorce Number of children
WVS WVS WVS WVS WVS
94152 93962 93962 94747 90612
1.5 44.0 22.3 0.1 1.7
1 15 2.3 0 0
2 101 102.0 1 20
Notes : Based on the domain/categories in OECD 2011a, the study selected relevant variables from the World Values Survey. See Annex 1 for details of the variables used.
We test the above determinants (health, employment status, social contact, quality of governance etc…) on life satisfaction, as proxy of wellbeing. Therefore the regression model that is best suited to this analysis is an ordered probit response model where the dependent variable – people’s observable satisfaction with life – is discreet and defined on a finite ordinal scale, i.e. Life satisfaction ∈ (1….10). The model is as follows: Life satisfaction itc =α + β individual itc +γ macro tc + wt + ε itc where the subscripts represent individuals, time periods and countries. Individuals includes a number of characteristics of the respondents such as gender, age, income, marital status, education level, employment status, the number of children, health status and contact with friends, while epsilonitc represents the error term which we assume to be i.i.d and normally distributed. At the country level, Macrotc includes unemployment rates, generalised trust in others, income inequality, freedom, CPI index, and an environment index. In addition, the results control for robust standard errors and include wave fixed effects wt to reduce the chance that macroeconomic shocks are driving the correlations. There is also risk for some endogeneity bias in the data, as for example income and educational levels can be correlated with each other which could introduce some downward bias to the estimates (Annex 2). Since aggregate variables are introduced into individual level regressions, standards errors are clustered by wave (Moulton B. 1990). Both Ferrer-i-Carbonell and Frijters (2004) and Stevenson and Wolfers (2008) point out, the choice of ordered probit or least squares make little difference when applied to life satisfaction data. Weighted Least squares are therefore estimated and WLS are used as basis for our analysis since the coefficients are easier 13
ECO/WKP(2011)90 to interpret intuitively. The WLS weights correspond to the variable (s 018 equilibrated weight – 1000) provided by the World Values Survey. The explanatory power of each determinant of life satisfaction is then compared with that of (the log) income to shed light on the relative importance of various dimensions for life satisfaction. The significance of these compensating differentials, computed as the ratio of the WLS estimated coefficients of each determinant over log income, is tested statistically at 5% level (for similar test see Diener et al 2009 or Hagerty et al 2001). Finally, the regressions are also run with countries rather than individuals as the unit of analysis (see Helliwell et al 2009 for similar methodology). It is of high importance to notice that while providing insights on determinants of wellbeing, this method cannot explain wellbeing developments over time nor demonstrate causality. Pooled cross-country regressions The empirical analysis is subdivided into three main parts: estimations for OECD countries as a group, individual country regressions for the 32 countries of the sample, and an analysis of the sensitivity of country rankings to different weightings on determinants. The results of the pooled cross-country regressions are summarized in Table 2. Both columns 1 and 2 include a mix of individual and country level data. Column 3 displays weighted least squares regression using country average data only. The results are relatively robust for different specifications and in most cases significant, while the signs are largely in line with our expectations and those in the literature. In and of themselves, probit coefficients have no straightforward interpretation in microeconomic estimations. The usual procedure is to calculate marginal effects, which for instance summarize how an increase in income affects a person’s probability to be “very satisfied” with his or her life. However, for the reasons outlined earlier, we abstain from making these calculations and resort to the coefficients of the Weighted Least Square estimations which are easier to interpret.
14
ECO/WKP(2011)90 Table 2. Summary regression on determinants of life satisfaction World Values Survey, 1994-2008 Ordered probit regression, micro data, OECD countries, 1994-2008
WLS regression, micro data, OECD countries, 1994-2008
WLS regression, average data, OECD country averages, 1981-2008
Compensating differentials (with respect to log income), OECD countries, 1994-2008
0.200 (0.012)**
0.391 (0.019)**
0.233 (0.092)**
--
-0.343 (0.064)**
-0.303 (0.133)**
-0.030 (0.033)
0.77 (0.016)**
0.413 (0.009)** -0.315 (0.030)** 0.062 (0.015)
0.689 (0.013)**
0.211 (0.173)
1.76 (0.012)**
-0.576 (0.047)**
--
1.47 (0.065)**
0.072 (0.028)**
-0.030 (0.008)**
0.18 (0.004)**
0.002 (0.003)
0.010 (0.005)**
0.235 (0.031)**
0.02 (0.012)**
-0.005 (0.001)**
0.002 (0.003)
-0.002 (0.003)
0.01 (0.005)**
0.190 (0.047)**
0.509 (0.071)**
0.044 (0.064)
1.30** (0.006)
Trust in People (avg)
0.142 (0.013)**
0.267 (0.022)**
0.379 (0.251)
0.68 (0.005)**
Friends (ind)
0.113 (0.011)**
0.199 (0.017)**
2.389 (0.329)**
0.50 (0.042)**
CPI index (avg)
-0.283 (0.044)**
-0.416 (0.082)**
-0.150 (0.023)**
1.06 (0.005)**
Gender (ind)
0.067 (0.012)**
0.120 (0.020)**
0.082 (0.020)
--
Age (ind)
-0.017 (0.002)**
-0.031 (0.003)**
-0.020 (0.003)**
--
Squared age /100 (ind)
0.026 (0.002)**
0.043 (0.003)**
0.020 (0.003)**
--
Divorce (ind)
-0.294 (0.026)**
-0.487 (0.044)**
Number of children (ind)
0.024 (0.005)**
0.039 (0.008)**
-0.723 (0.044)** 0.025 (0.008)**
Log income (ind) Perceived income inequality (avg) State of health (subjective) (ind) To be unemployed (ind) Unemployment rates (avg) Educational level (ind) Environmental index (avg) Freedom of choice and control (avg)
Wave dummies R-Squared Number of Obs
Yes 0.0582 27455
Yes
---
Yes
0.2201
0.0832
27457
32477
Notes: Dependent variable is individual life satisfaction (1-10 scale). Estimation is with clustered standard errors. Entries are regression coefficients (standards errors)** significant at 0.05 level
The WLS results tell us about the magnitude and the relative weights of all these selected determinants of wellbeing. Firstly, income has a significant positive impact on subjective wellbeing (Table 2, column 2), and the effect of log income on wellbeing is around 0.3. Hence all else equal a doubling of income is associated with a higher average wellbeing by 0.3 units. At the individual level, the state of health has a significant positive and large impact on wellbeing (Table 2, column 2). Healthier people are more satisfied with their lives: a one point increase in the state of health on a 1-5 scale (for instance, move from good health to very good health) is associated with an increase in life satisfaction of 0.7 on a 1-10
15
ECO/WKP(2011)90 scale. This is twice the coefficient on income, and we can therefore compare a one point improvement in subjective health status with a quadrupling of income. Being unemployed has also a large negative and significant coefficient of 0.6. This is in line with other similar studies (Clark and Oswald, 1994; Winkelmann and Winkelmann 1998). Being unemployed decreases wellbeing two times more than a halving of income. Being divorced also strongly decreases life satisfaction. The coefficient for divorce is a little lower than that for unemployment at around 0.5. This means that all else equal, a divorced individual experiences life satisfaction that is on average 0.5 units lower than for a married individual. People’s gender and age also have a significant impact on subjective wellbeing (Table 2, column 2). In particular, the effect of age on happiness is decreasing at the start, but recovers later (minimum about 40-45). The effects of gender and children, while both significant, are comparatively small. Having a higher educational level does not have a major direct impact on life satisfaction at the micro level, but is highly significant and has a relatively large coefficient in the country-level regression. This is broadly consistent with the literature (Dolan, Peasegood, and White, 2008), and suggests that education impacts life satisfaction by improving access to employment, contributing to higher incomes, and enhancing the opportunity to participate in economic and social activities. Having friends to count on increases life satisfaction about half as much as a doubling of income. This is also consistent with the literature suggesting social relationships and participation in community life are important both for their direct impact on life satisfaction (we enjoy the time we spend with friends) (Helliwell et al, 2009). With regards to the variables at the country level, other significant factors of wellbeing relate to the personal, social and institutional environment in which people live (Table 2, column 2). In that sense, life satisfaction depends broadly on social life and leisure time, as much as material living conditions. “Trust in people” has a coefficient of 0.3 according to the WLS estimations. A one standard deviation change in the average level of trust would therefore increase subjective wellbeing by 0.36. Research on “social capital” has stressed the importance of social relationships for subjective and community wellbeing, and of well functioning democratic institutions for economic growth (Australian Bureau of Statistics, 2002). People with more social connections report higher life-evaluations, as many of the most pleasurable personal activities involve socialising. The benefits of social connections extend to people’s health and to the probability of finding a job, as well as to several characteristics of the neighbourhood where people live. Personal activities have also an important impact on life satisfaction. A one standard deviation increase in the average value of“Freedom of choice” increases wellbeing by around 0.19 on a 1-10 scale. Freedom of choice can be linked with the idea that more generally, people do not always “choose” among the everyday activities (walking, exercise, playing, watching TV, preparing food, housework, shopping etc…) in the same way as they allocate their budget among various goods, due to a lack of effective alternatives. Thus, freedom of choice measures people’s capacity to choose among the everyday activities. On the negative side, indicators of political corruption, and unemployment decrease wellbeing. Corruption has a large negative impact on life satisfaction with a 1 point change on the corruption perception index associated with a change of around 0.4 in life satisfaction. This is in line with the results reported by Hudson (2006) and Wagner et al (2009), which state that, political and institutional environment related to the efficient satisfaction of voters’ preferences is likely to affect wellbeing. Perceived income inequality decreases life satisfaction by 0.3 on average in the WLS regression. This is broadly consistent with other findings (Alesina, Di Tella and MacCulloch, 2004; Di Tella and MacCulloch, 2006). The positive coefficient on unemployment at the country level, although counter-intuitive at first sight, may reflect the fact that the unemployed feel less worse off in a society where there are others like them (i.e. a reference group effect). The direct negative impact of unemployment on life satisfaction is already captured by the individual level variable
16
ECO/WKP(2011)90 The state of the current and future environment is the last determinant included in the regressions. The environmental index has a significant coefficient, but the absolute magnitude of the effect is extremely small at around 0.002. Although this coefficient may seem surprisingly small, it must be kept in mind that the air quality index used as a proxy for environmental conditions is highly imperfect and captures, at best, only one aspect of how the environment impacts on life satisfaction. Comparisons across countries This section presents comparisons of the above discussed determinants of life satisfaction across countries. Do the relative weights of these determinants vary a lot between OECD countries? While we want to estimate the impact of health, unemployment, quality of governance etc… on life satisfaction, for each OECD country, the regression model that is best suited to this analysis is as follows, run for each of the 32 countries: Life satisfaction it =α + β individual it +γ macro t + wt + ε it where the subscripts represents individuals and time periods. Individualit includes a number of characteristics of the respondents such as gender, age, income, marital status, education level, employment status, state of health and the number of children, but also perceived income inequality, social trust, freedom, interest in politics, corruption, and friends. Indeed, as the WVS is collected by waves, there are too few average variables by country for these last determinants of wellbeing (income inequality, social trust, freedom etc…). Therefore, we need, this time, to introduce them at individual level in the country regressions in contrast with the previous regressions. Lastly, macrot represents the environmental index, which is, in this case, available for more years than the other variables, as this measure is provided from OECD databases. When data are available for more than one wave in WVS, regressions include wave fixed effects wt. We are directly estimating weighted least squares, as there are little differences with the results from an ordered probit model. Country regressions of life satisfaction and the OECD average (Table 3) confirm largely the main results from the baseline estimations (cross country regression) (Table 2). The most important determinants of life satisfaction are trust, health, unemployment, income, marital status and freedom. People’s gender, age, education level, employment status, and the number of children also have a significant impact on subjective wellbeing. As found in previous studies; income and health are associated with increases in subjective wellbeing. Education and being a woman influence wellbeing to a lesser degree. On the other hand, being unemployed or divorced are associated with strongly decreased life satisfaction. The effect of age on wellbeing is again decreasing at the start, but recovers later (minimum about 40-45). In addition, corruption and inequality have a negative impact on wellbeing while environmental index, social trust and importance of friends generally have a significant and positive impact on wellbeing.
17
ECO/WKP(2011)90
--
--
0.370 (0.026)**
0.180 (0.025)
0.309 (0.019)** 0.151 (0.052)** 0.085 (0.056)
--
--
--
-0.032 (0.092) 0.054 (0.017)** -0.050 (0.018)** -0.730 (0.229)** -0.031 (0.038)
0.016 (0.093)** -0.020 (0.017) 0.026 (0.018)** -0.667 (0.255)** 0.076 (0.032)**
Time dummies
Yes
No
Number of Obs R squared Number of waves
2925 0.3017 2
1186 0.2871 1
Educational level Environmental index Freedom of choice and control Important in life: friends Trust in people Extent of political corruption Gender Age Age squared Divorce Children
--
--
0.274 (0.092)**
0.188 (0.089)
--
--
--
0.101 (0.129) -0.036 (0.026)* 0.053 (0.026)** -0.673 (0.366)* 0.050 (0.057)
0.130 (0.143) -0.004 (0.034) 0.018 (0.036) 0.084 (0.454) -0.077 (0.101)
0.461 (0.147)** 0.012 (0.026) -0.003 (0.027) -0.214 (0.424) -0.031 (0.075)
0.278 (0.136)** -0.086 (0.025)** 0.109 (0.027)** -0.844 (0.353)** -0.003 (0.057)
Iceland
--
To be unemployed
Hungary
--
State of health
0.269 (0.070) -0.049 (0.014) 0.590 (0.045)** -0.955 (0.120)** 0.017 (0.014) 0.006 (0.005) 0.244 (0.018)** 0.118 (0.054)** 0.376 (0.063)** -0.216 (0.060)** 0.084 (0.062)* -0.003 (0.010) 0.012 (0.010) -0.505 (0.140)** -0.016 (0.036)
Greece
--
Income inequality
Germany
3358 0.2422 2
0.139 (0.078) -0.014 (0.015) 0.581 (0.062)** -0.795 (0.215)**
0.379 (0.149)**
0.477 (0.184)** -0.039 (0.029) 0.697 (0.090)** -0.750 (0.416)*
0.229 (0.117) -0.011 (0.025) 0.361 (0.083)** -1.113 (0.271)**
--
--
--
--
--
0.546 (0.045)**
0.283 (0.036)**
0.347 (0.043)**
France
1385 0.1928 1
0.155 (0.094) -0.016 (0.015) 0.440 (0.060)** -0.852 (0.424)**
Finland
Denmark
Yes
0.221 (0.054)** -0.008 (0.012) 0.584 (0.042)** -0.112 ((0.282) -0.027 (0.018)* 0.085 (0.015)** 0.323 (0.019)** 0.166 (0.052)** 0.134 (0.057)** -0.076 (0.063) 0.052 (0.057) -0.032 (0.011)** 0.046 (0.011)** -0.547 (0.134)** 0.060 (0.024)**
Log income
Estonia
Czech Republic
No
Belgium
0.255 (0.124)** -0.083 (0.028)** 0.475 (0.088)** -0.372 (0.258)**
0.062 (0.074) 0.014 (0.014) 0.003 (0.014) -0.548 (0.233)** 0.103 (0.020)
0.365 (0.113)** -0.052 (0.020)** 0.626 (0.066)** -0.874 (0.274)** 0.047 (0.024)** 0.008 (0.002)** 0.352 (0.028)** 0.048 (0.073) 0.332 (0.094)** -0.193 (0.074)** 0.185 (0.089)** -0.070 (0.018)** 0.089 (0.018)** -0.595 (0.157)** 0.137 (0.053)
Austria
0.274 (0.054)** -0.013 (0.011) 0.455 (0.040)** -0.339 (0.116)** -0.029 (0.016)*
Australia
Canada
Table 3. Cross country comparisons of regressions coefficients with the OECD average, 1981-2008
0.849 (0.132)** -0.007 (0.029) 0.434 (0.103)** -0.374 (0.260) 0.049 (0.037)
--
--
0.257 (0.040)**
0.387 (0.097)** -0.030 (0.024) 0.549 (0.092)** -0.952 (0.384)** 0.060 (0.027)** 0.002 (0.006) 0.317 (0.036)** 0.246 (0.098)** 0.030 (0.149)
-0.019 (0.131) -0.007 (0.028) 0.017 (0.030) -0.462 (0.278) 0.007 (0.057)
0.358 (0.034)** 0.080 (0.102) 0.407 (0.159)** -0.364 (0.105)** 0.288 (0.137)** -0.074 (0.026)** 0.086 (0.029)** 0.284 (0.245) 0.018 (0.068)
0.201 (0.062)** -0.008 (0.015)* 0.520 (0.054)** -0.391 (0.124)** 0.011 (0.018) 0.006 (0.003)** 0.258 (0.028)* 0.151 (0.070)** 0.211 (0.070)** -0.010 (0.039) 0.299 (0.070)** -0.014 (0.014)** 0.022 (0.014)* -0.368 (0.115)** 0.061 (0.028)
Yes
No
No
Yes
No
Yes
No
No
No
1603 0.2984 2
767 0.2320 1
816 0.3302 1
1743 0.2638 2
705 0.3047 1
3129 0.2641 2
796 0.2523 1
847 0.2228 1
495 0.2790 1
--
-0.174 (0.130)* --
18
--
---0.576 (0.335) 0.041 (0.051)
--
--
--
0.281 (0.148)**
0.007 (0.157)
0.231 (0.125)*
High educational level
--
Environmental index
--
Freedom of choice and control
0.342 (0.035)**
--
Important in life: friends
--
--
--
Trust in people
0.175 (0.112)*
0.345 (0.173)**
0.204 (0.113)*
-0.072 (0.014)** 0.269 (0.032)**
Slovenia
-0.540 (0.277)** 0.039 (0.038) 0.007 (0.143)
Slovak Republic
--
Portugal
0.857 (0.083)** -0.065 (0.015)** 0.489 (0.056)** -0.045 (0.247) -0.014 (0.029) 0.135 (0.050)** 0.226 (0.019)** 0.126 (0.067)* 0.521 (0.079)**
Poland
0.432 (0.048)** -0.060 (0.016)** 0.479 (0.039)** -0.248 (0.367) 0.010 (0.019) 1.459 (0.217)** 0.298 (0.021)** 0.086 (0.053) 0.144 (0.059)
Norway
0.042 (0.160) -0.019 (0.021) 0.533 (0.084)** -1.477 (0.330)**
New Zealand
0.646 (0.126)** -0.013 (0.034)
Netherlands
0.153 (0.133) -0.027 (0.021) 0.524 (0.088)** -0.777 (0.289)**
Luxembourg
Korea
To be unemployed
Japan
State of health
Italy
Income inequality
Israel
Log income
Ireland
ECO/WKP(2011)90
0.177 (0.113) -0.064 (0.029)**
-0.746 (0.730) 0.041 (0.041)
0.150 (0.090) -0.095 (0.026)** 0.517 (0.078)** -1.082 (0.451)** 0.012 (0.026)**
0.193 (0.088)** -0.014 (0.019) 0.630 (0.071)** -0.378 (0.309) 0.016 (0.025)
0.281 (0.059)** -0.018 (0.016) 0.472 (0.047)** -1.275 (0.325)** -0.014 (0.017)
0.879 (0.094)** -0.004 (0.017) 0.602 (0.054)** -0.296 (0.213) 0.031 (0.039)
0.139 (0.122) -0.035 (0.023) 0.637 (0.074)** -0.075 (0.434)
0.499 (0.132)** -0.049 (0.022)** 0.501 (0.079)** -0.508 (0.242)**
--
--
--
--
--
--
--
--
0.296 (0.044)**
0.111 (0.032)** 0.171 (0.094)* 0.055 (0.110)
0.284 (0.026)** 0.244 (0.072)** 0.043 (0.088) -0.058 (0.085) 0.047 (0.070) -0.065 (0.015)** 0.072 (0.016)** -0.257 (0.153) 0.115 (0.031)**
0.243 (0.029)** 0.175 (0.067)** 0.184 (0.098)**
0.279 (0.035)**
0.476 (0.164)** -0.012 (0.024) 0.378 (0.076)** -0.425 (0.265) 0.030 (0.036) 0.007 (0.007) 0.207 (0.037)**
--
--
--
--
0.154 (0.085)** -0.017 (0.013) 0.029 (0.014)** -0.791 (0.267)** 0.141 (0.052)**
-0.106 (0.124) -0.009 (0.021) 0.002 (0.022) -0.901 (0.476)* 0.028 (0.048)
-0.094 (0.112) -0.039 (0.021)* 0.059 (0.024)** -0.420 (0.335) -0.008 (0.056)
-0.012 (0.124) -0.006 (0.217) -0.002 (0.020) -0.031 (0.384) 0.168 (0.073)**
--
0.009 (0.002)** 0.318 (0.031)** 0.020 (0.089) 0.247 (0.126)
--
--
--
--
--
--
--
-0.071 (0.113) -0.005 (0.020) 0.021 (0.020) -3.096 (0.279)** 0.007 (0.34)
0.046 (0.151) -0.058 (0.023)** 0.051 (0.024)**
-0.107 (0.110) -0.025 (0.021) 0.034 (0.023) -0.896 (0.420)* 0.021 (0.062)
0.203 (0.061)** -0.059 (0.014)** 0.081 (0.014)** -0.374 (0.185)** -0.013 (0.034)
-0.087 (0.074) 0.029 (0.019) -0.041 (0.021)** -0.936 (0.385) -0.078 (0.047)
-0.176 (0.145) -0.025 (0.025) 0.035 (0.027) 0.197 (0.327) 0.054 (0.069)
0.085 (0.104) -0.015 (0.020) 0.026 (0.022) -0.210 (0.339) -0.012 (0.043)
0.457 (0.035)** 0.024 (0.086) 0.203 (0.089)** -0.024 (0.071) 0.048 (0.090) -0.027 (0.016) 0.054 (0.016)** -0.506 (0.266) 0.041 (0.034)
Time dummies
No
No
No
Yes
Yes
No
No
Yes
Yes
Yes
No
Yes
No
Number of Obs R squared Number of waves
865 0.2974 1
836 0.0665 1
1189 0.1936 1
2973 0.2424 4
3044 0.1707 3
542 0,1834 1
711 0.1814 1
1237 0.3996 2
1947 0.2384 2
2526 0.1452 3
1021 0.1997 1
1181 0,2069 2
836 0,2028 1
Corruption Gender Age Age squared Divorce Children
---
-0.376 (0.154)**
19
-0.161 (0.137)
-0.241 (0.156)
United States 0.343 (0.077)** -0.026 (0.012) 0.410 (0.050)** -0.009 (0.162) 0.003 (0.016) 0.038 (0.032) 0.386 (0.024)** 0.181 (0.066)** 0.145 (0.067)**
--
--
--
0.559 (0.068)** -0.067 (0.013)** 0.084 (0.015)** -1.340 (0.295)** 0.004 (0.024)
-0.038 (0.110)** -0.022 (0.021) 0.032 (0.022) -0.300 (0.287) -0.075 (0.041)*
0.009 (0.067) -0.021 (0.011) 0.032 (0.011)** -0.411 (0.123)** 0.061 (0.023)**
No
Yes
No
Yes
1688
818
5618
1011
2389
25119
0.2389
0,2916
0,2635
0.1371
0,2530
0.2777
0.2196
4
2
1
3
1
3
5
0.208 (0.068) -0.022 (0.010) 0.466 (0.043)** -0.634 (0.116)** -0.017 (0.023) 0.017 (0.003)** 0.335 (0.017)** 0.103 (0.046)** 0.070 (0.062) -0.098 (0.091) 0.052 (0.055) 0.001 (0.010) -0.003 (0.010) -0.263 (0.236) 0.041 (0.024)
0,415 (0,077)** -0,026 (0,017) 0,749 (0,054)** -0,408 (0,176)** -0,072 (0,019)** 0.008 (0,002)** 0,232 (0,027)** 0.144 (0.072)** 0,129 (0,079) -0.111 (0.075) 0,085 (0.071) -0,030 (0,014)** 0,046 (0,015)** -0,246 (0,139)** 0,083 (0,033)**
0,344 (0,100)** -0.006 (0.019) 0,608 (0,090)** -1,516 (0.532)** 0,022 (0,035)
Time dummies
Yes
Yes
Number of Obs
3255
R squared Number of waves
Log income Income inequality State of health To be unemployed High educational level Environmental index Freedom of choice and control Important in life: friends Trust in people Corruption Female Age Age squared Divorce Children
-0.239 (0.034)** 0.066 (0.092) 0.367 (0.111)** 0.007 (0.092) -0.099 (0.113) -0.045 (0.020)** 0.063 (0.019)** -0.284 (0.273) 0.021 (0.050)
20
OECD average
United Kingdom 0.105 (0.110) -0.012 (0.024) 0.333 (0.067)** -0.943 (0.300)* 0.091 (0.045)** 0.009 (0.008) 0.380 (0.036)* 0.128 (0.085) -0.274 (0.105)*
Sweden
0,434 (0,065)** -0.083 (0.010) 0,845 (0,041)** -0.814 (0.147)** -0.043 (0.018) 0.050 (0.002)** 0.065 (0.011)** 0.245 (0.061)** 0.054 (0.101)
Spain
Turkey
Switzerland
ECO/WKP(2011)90
0.290 (0.020)** -0.053 (0.004)** 0.603 (0.013)** -0.517 (0.048)** -0.001 (0.006) 0.005 (0.001)** 0.242 (0.005)** 0.107 (0.013)** 0.217 (0.026)** -0.134 (0.014)** 0.130 (0.024)** -0.039 (0.004)** 0.050 (0.004)** -0.504 (0.054)** 0.064 (0.008)** Yes
ECO/WKP(2011)90 The results also tell us that the relative weights of each determinant of wellbeing are roughly similar in almost all OECD countries. In other words, among the variables measured here, the determinants of subjective wellbeing do not vary a lot between countries. This is consistent with Helliwell (Helliwell 2009), who concludes that “the international similarity of the estimated equations suggests that the large international differences in average life evaluations are not due to different approaches to the meaning of good life, but to differing social, institutional and economic life circumstances”. Although the individual country regressions can generally be characterised as showing little difference between countries (particularly taking into account the relatively small sample sizes for each country), it is interesting to look at some of the patterns observable across the different countries. The following paragraphs provide a brief and purely descriptive 12 overview of some of the key patterns that emerge:
12.
•
Log income has a significant relationship with life satisfaction in many countries, but overall, higher income has a stronger positive relationship with life satisfaction in countries with lower GDP per capita (e.g. Estonia, Israel, Korea and Poland).
•
Health is a highly significant predictor across all countries, but shows a particularly strong relationship with life satisfaction in countries with relatively higher proportion of people reporting “poor health” like Czech Republic, Hungary, Poland, and Turkey (see Annex 3)
•
Unemployment has a significant negative impact in many countries, but has a particularly strong negative association with life satisfaction in Austria, Czech Republic, France, Germany, Italy, Netherlands, and Switzerland. It is interesting to note that these are some of the Continental welfare states where unemployment benefits are large but probability of staying unemployed is also relatively high. (OECD 2011b)
•
The positive relationship between educational level and life satisfaction is stronger in France, Sweden and United Kingdom than in other countries, and in many countries it is not significant.
•
The negative relationship between income inequality and life satisfaction is stronger in Denmark, Netherlands and Turkey.
•
Freedom of choice and control has a stronger association with life satisfaction especially in several in Anglo Saxon economies: Australia, Canada, Ireland, New Zealand, United Kingdom and United States but also Austria, Czech Republic, Estonia, Iceland, France, Greece, Slovak Republic and Spain.
•
Trust in people has a stronger positive association with life satisfaction in Czech Republic, Estonia, Germany, Israel, Korea, Luxembourg and Switzerland, which have low average levels of social trust.(see Annex 3)
•
Corruption data is missing in many cases, but where available has a stronger negative association with wellbeing in Estonia, Germany and Turkey, where the CPI index is relatively high compared to Finland, Norway, and New Zealand where the CPI index is low (low perceived corruption).
None of the patterns discussed in these paragraphs have been formally tested to establish whether the differences are significant.
21
ECO/WKP(2011)90 •
Globally, women report higher levels of life satisfaction than men, except in Austria, Denmark, Ireland, Italy, Korea, Luxembourg, Portugal, Slovak Republic, Slovenia, Switzerland and United Kingdom.
•
Being divorced has a significant negative impact in a large number of countries, but the relationship with life satisfaction is particularly strong in Ireland, Italy, Korea, Portugal and Turkey.
To conclude, empirical estimates of a range of determinants of wellbeing should not be considered unduly large given the relatively small sample sizes for each country. These differences may be based on economic, social and cultural preferences due to cultural background or economic positions that lead countries to vary in terms of which determinants prove crucial for explaining patterns of life satisfaction across their populations. Alternatively, it is likely that some of the differences are simply due to measurement error associated with the small sample size for each country. How sensitive are country rankings to variations in the determinants of life satisfaction? The previous sections of this paper have looked at the main determinants of life satisfaction and how these vary across countries. However, even if the same pattern of determinants is generally found, it would be valuable to know whether the small differences that do exist make a significant difference to the conclusions that can be drawn about life satisfaction. In particular, there is a high degree of interest in the potential for measures of life satisfaction to be used in benchmarking the progress of countries. For this to be viable, there needs to be some certainty as to how sensitive the conclusions drawn about relative performance are to cultural differences in the response to questions on life satisfaction. Therefore, this section will test the sensitivity of determinants of life satisfaction measures to cultural differences. For example, does Japan’s relatively low ranking in life satisfaction reflect something unique to Japan culturally, or is it is a product of how it performs on the known the determinants of wellbeing? Methodology Testing for the impact of culture on cross-country differences in average life satisfaction is difficult, as there is no obvious simple method for distinguishing between cultural effects due to culture and those due to some other unobserved country-specific variable. However, it is possible to significantly narrow the scope of the areas that cultural bias might affect. Consider, for example, the life satisfaction equation estimated earlier: Life satisfaction it =α + β individual it +γ macro t + wt + ε it Cultural bias can affect life satisfaction in three areas: (1) the constant term α reflecting a cultural bias towards positive or negative reporting; (2) the coefficients β and γ reflecting a different preference function across the determinants of wellbeing; and (3) ε it representing an unobserved variable. Because we have country-specific estimates of β and γ we can use these to examine the degree to which cultural measurement bias due to a different preference function exists. This is accomplished by substituting the micro-data used to estimate the original regressions for each country into the equation above using the estimated coefficients for a particular country and observing whether the predicted life satisfaction scores differ significantly from the actual life satisfaction scores. In particular, we test the degree to which the rankings change if all OECD countries are calculated with a reference country. This is done by producing a ‘predicted’ life satisfaction for each OECD country by applying the coefficients from the WLS regression for a reference country to the micro data on determinants for each OECD country. This produces a predicted life satisfaction score for each country as if it had the same 22
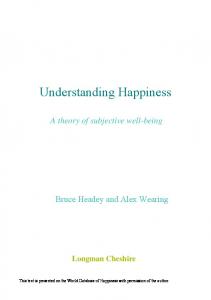
ECO/WKP(2011)90 weightings on the various determinants as the reference country. By comparing how countries rank in terms of life satisfaction when we use different reference countries it is possible to establish how sensitive life satisfaction scores are to cross-country differences in the drivers of wellbeing. A similar process can be used taking the regression on the OECD as a whole as the reference point. Although this is based on a slightly different set of determinants than the country-specific regressions, it is easy to calculate the predicted life satisfaction for each country using the OECD determinants. The following sections discuss the impact of using different reference countries as the basis for calculating predicted life satisfaction scores for OECD countries. The first section looks at the impact of using the coefficients from a regression on the OECD as a whole, and this is followed by a discussion of the impact of using France, Denmark, and Japan in turn as reference countries. OECD average as reference Overall, the predicted values are close to the measured values for life satisfaction when we use the OECD regression coefficients as the reference for calculating predicted values (Figure 5). There is also a robust relationship between predicted values using the OECD as a reference to predicted values based on country-specific regressions (Figure 5). However, predicted values based on OECD coefficients fit better the data for countries in the middle of the distribution, than countries at the top and at the lower end of the distribution. Using OECD average weights to compute predicted life satisfaction fits the data well for countries like Australia, Czech Republic, France, Germany, Great Britain, Luxembourg, Portugal, and Switzerland. However, there is a slight upward bias in the predicted wellbeing for Denmark, Estonia Iceland, Italy, Netherlands, Norway, Japan and Turkey, while there is a downward bias for Austria, Canada, Greece, Hungary, New Zealand, Poland, Spain, Sweden., United States. Looking at Table 4 it can be seen that there is a high correlation (0.77) between the predicted values using OECD coefficients, and the predicted values calculated where each country uses its own coefficients. This is below 1, but considerably higher than the correlation between the predicted values using OECD coefficients and the actual values (0.63). This suggests that variation in preferences across countries has some impact, but that this is not what is driving all of the unexplained variance.
23
ECO/WKP(2011)90 Figure 4. Predicted life satisfaction by country
1. Index scale of 0-10 from least to highest life satisfaction. Source: OECD calculations.
24
ECO/WKP(2011)90
Table 4: Correlation between average scores of predicted life satisfaction and other wellbeing indexes by country
Life satisfaction Predicted life satisfaction (country coefficients) Predicted life satisfaction (OECD coefficients) HDI Better life index (rated equally) Predicted life satisfaction (Japan coefficients) Predicted life satisfaction (Denmark coefficients) Predicted life satisfaction (France coefficients)
Life satisfaction
predicted life satisfaction (country coefficients)
predicted life satisfaction (OECD coefficients)
HDI
Better life index (rated equally)
Predicted life satisfaction (Japan coefficients)
Predicted life satisfaction (Denmark coefficients)
Predicted life satisfaction (France coefficients)
1
--
--
--
--
--
--
--
0.85
1
--
--
--
--
--
--
0.63
0.77
1
--
--
--
--
--
0.51
0.52
0.33
1
--
--
--
--
0.76
0.79
0.49
0.70
1
--
--
--
0.65
0.78
0.99
0.36
0.51
1
--
--
0.62
0.76
0.99
0.33
0.48
0.99
1
--
0.64
0.78
0.99
0.35
0.50
0.99
0.99
1
25
ECO/WKP(2011)90 Other reference countries In addition to using a regression on the OECD as a whole as a reference point, the process was repeated for Denmark (which usually scores near the top of measured life satisfaction), and France and Japan (which both have relatively low levels of life satisfaction given their developed status). Predicted values for life satisfaction using Japan, Denmark or France as a reference point, are highly correlated (0.99) with each other and with predicted values calculated using the OECD as a reference point. (Tables 5). This suggests that the differences that do exist between Denmark, France, Japan and the OECD on average in the determinants of life satisfaction (detailed in Table 3), only have a small impact on predicted wellbeing across all countries. Table 5. Changes in country rankings with different country coefficients Actual
OECD Predicted
Country Predicted
Australia Austria Belgium Canada
14 5 16 8
15 23 6 18
14 15 11 12
12 23 6 18
14 23 6 18
13 23 6 18
Czech Republic Denmark Estonia Finland
23 1 32 6
19 3 30 14
19 1 32 5
19 3 30 15
19 3 30 13
19 3 30 15
France Germany Greece Hungary
22 17 24 29
25 21 29 32
26 23 24 31
25 20 28 32
25 21 28 32
25 21 28 32
Iceland Ireland Israel Italy
3 4 20 18
1 12 10 9
2 7 18 20
2 13 11 9
2 15 8 10
1 12 11 9
Japan Luxembourg Netherlands New Zealand
25 9 12 11
11 7 4 27
22 8 16 9
10 7 4 26
11 7 4 27
10 7 4 27
Norway Poland Portugal Slovakia
10 26 19 28
2 28 8 24
4 25 13 27
1 29 8 24
1 29 9 24
2 29 8 24
Slovenia South Korea Spain Sweden
21 31 30 7
17 26 31 13
21 29 30 6
17 27 31 14
17 26 31 12
17 26 31 14
Switzerland Turkey United Kingdom United States
2 27 15 13
5 20 16 22
3 28 17 10
5 22 16 21
5 20 16 22
5 22 16 20
26
Japan Predicted
Denmark Predicted
France Predicted
ECO/WKP(2011)90
Country Australia Austria Belgium Canada
Actual vs Predicted
Predicted vs OECD
OECD vs Japan
OECD vs Denmark
OECD vs France
Actual vs OECD
0 -10 5 -4
-1 -8 5 -6
3 0 0 0
1 0 0 0
2 0 0 0
-1 -18 10 -10
4 0 0 1
0 -2 2 -9
0 0 0 -1
0 0 0 1
0 0 0 -1
4 -2 2 -8
France Germany Greece Hungary
-4 -6 0 -2
1 2 -5 -1
0 1 1 0
0 0 1 0
0 0 1 0
-3 -4 -5 -3
Iceland Ireland Israel Italy
1 -3 2 -2
1 -5 8 11
-1 -1 -1 0
-1 -3 2 -1
0 0 -1 0
2 -8 10 9
Japan Luxembourg Netherlands New Zealand
3 1 -4 2
11 1 12 -18
1 0 0 1
0 0 0 0
1 0 0 0
14 2 8 -16
Norway Poland Portugal Slovakia
6 1 6 1
2 -3 5 3
1 -1 0 0
1 -1 -1 0
0 -1 0 0
8 -2 11 4
Slovenia South Korea Spain Sweden
0 2 0 1
4 3 -1 -7
0 -1 0 -1
0 0 0 1
0 0 0 -1
4 5 -1 -6
-1 -1 -2 3
-2 8 1 -12
0 -2 0 1
0 0 0 0
0 -2 0 2
-3 7 -1 -9
Czech Republic Denmark Estonia Finland
Switzerland Turkey United Kingdom United States
27
ECO/WKP(2011)90 Nonetheless, there are some interesting differences between the predicted values based on Japan coefficients and the measured values for life satisfaction (Figure 5). Using Japan weights to compute predicted life satisfaction, fits the data well for countries like Belgium, Czech Republic, Korea, Portugal, Slovakia and Turkey. However, there is a slight downward bias in the predicted wellbeing for Denmark, Iceland, Netherlands and Norway, while there is an upward bias for the rest of OECD countries. All in all, this is explained by the fact that predicted values based on Japan coefficients fit better the data for countries that rank closer to Japan in the measured life satisfaction scale, than countries at the top of the distribution. Similar patterns can be found in the data for predicted values based on the coefficients from France and Denmark.
Figure 5. Survey life satisfation versus predicted life satisfation Index scale of 0-10 from least to highest life satisfaction
Source: OECD calculations.
28
ECO/WKP(2011)90 Do the differences matter? Looking at the correlation coefficients between predicted and actual values of life satisfaction, and between predicted values of life satisfaction based on different reference countries, shows that differences in preferences accounts for some, but not all of the cross-country variation. A key question, is whether this is a cause for concern in terms of the kind of uses for which life satisfaction data is used? One way to think about the issue is whether the use of different reference countries to calculate predicted life satisfaction affects how we rank countries. In other words, if we rank countries by predicted life satisfaction rather than actual life satisfaction, does this change anything? If so, does it matter which set of preferences we use to calculate the rankings? In short, the answers are “yes”, and “no” respectively. There is a change in the ranking of countries in going from actual measured subjective wellbeing to predicted wellbeing (Table 5, column 6), but the choice of reference country has no significant impact among the rankings of predicted life satisfaction (table 5, columns 3 to 5). Indeed, less than half of the countries have their ranking affected at all by switching from the OECD based predicted rankings to one based on a reference country, and most countries only move by 1 place in the rankings. This suggests that differences in country rankings are due not to fundamental differences in preferences but rather differences in the measured levels of those determinants (ie, the life circumstances or “stocks” of material living conditions, trust, state of the environment, quality of governance etc…) as well as country-specific fixed effects (either cultural bias in the constant or an unobserved variable). Lastly, comparing predicted life satisfaction to rankings by the Human Development Index and the new OECD index “Better life”, shows also some unity in the measures (Tables 4 and 6). There is a positive correlation between the HDI and the predicted values (0.52 and 0.33 respectively), as well as between the rankings from the Better life index and the predicted values (0.79 and 0.49 respectively). Comparing rankings between predicted life satisfaction and HDI shows that the introduction of variables like freedom of choice and control, social relationships and health which have a large impact on life satisfaction reduces the relative importance of income and emphasize the multidimensional aspect of wellbeing.
29
ECO/WKP(2011)90 Table 6. Comparisons between different predicted life satisfactions and ranking of countries Life satisfaction, World Value Survey ranking, 1981-2007 1. Denmark 2. Switzerland 3. Iceland 4. Ireland 5. Austria 6. Finland 7. Sweden 8. Canada 9. Luxembourg 10. Norway 11. New Zealand 12. Netherlands 13. United States 14. Australia 15. Great Britain 16. Belgium 17. Germany 18. Italy 19. Portugal 20. Israel 21. Slovenia 22. France 23. Czech Republic 24. Greece 25. Japan 26. Poland 27. Turkey 28. Slovakia 29. Hungary 30. Spain 31. South Korea 32. Estonia
Predicted life satisfaction, OECD avg coefficients 19812007 1. Iceland 2. Norway 3. Denmark 4. Netherlands 5. Switzerland 6. Belgium 7. Luxembourg 8. Portugal 9. Italy 10. Israël 11. Japan 12. Ireland 13. Sweden 14. Finland 15. Australia 16. Great Britain 17. Slovenia 18. Canada 19. Czech Republic 20. Turkey 21. Germany 22. United States 23. Austria 24. Slovakia 25. France 26. South Korea 27. New Zealand 28. Poland 29. Greece 30. Estonia 31. Spain 32. Hungary
Predicted life satisfaction, country coefficients, 1981-2007 1. Denmark 2. Iceland 3. Switzerland 4. Norway 5. Finland 6. Sweden 7. Ireland 8. Luxembourg 9. New Zealand 10. United States 11. Belgium 12. Canada 13. Portugal 14. Australia 15. Austria 16. Netherlands 17. Great Britain 18. Israel 19. Czech Republic 20. Italy 21. Slovenia 22. Japan 23. Germany 24. Greece 25. Poland 26. France 27. Slovakia 28. Turkey 29. South Korea 30. Spain 31. Hungary 32. Estonia
HDI ranking, 2007 1. Norway 2. Ireland 3. Germany 4. Australia 5. Iceland 6. Sweden 7. Netherlands 8. France 9. Switzerland 10. Luxembourg 11. Japan 12. Finland 13. United States 14. Spain 15. Canada 16. Austria 17. Belgium 18. Great Britain 19. Italy 20. New Zealand 21. Denmark 22. Greece 23. South Korea 24. Israel 25. Slovenia 26. Portugal 27. Czech Republic 28. Estonia 29. Slovakia 30. Poland 31. Hungary 32. Turkey
Better life indicator (all topics rated equally) 1. Australia 2. Canada 3. Sweden 4. New Zealand 5. Norway 6. Denmark 7. United States 8. Switzerland 9. Finland 10. Netherlands 11. Luxembourg 12. Iceland 13. United Kingdom 14. Austria 15. Ireland 16. Germany 17. Belgium 18. France 19. Japan 20. Israel 21. Slovenia 22. Spain 23. Czech Republic 24. Italy 25. Poland 26. Korea 27. Greece 28. Slovakia 29. Hungary 30. Portugal 31. Estonia 32. Turkey
30
Predicted life satisfaction, Japan coefficients, 1981-2007 1. Norway 2 .Iceland 3. Denmark 4. Netherlands 5. Switzerland 6. Belgium 7. Luxembourg 8. Portugal 9. Italy 10. Japan 11. Israel 12. Australia 13. Ireland 14. Sweden 15. Finland 16. United Kingdom 17. Slovenia 18. Canada 19. Czech Republic 20. Germany 21; United States 22. Turkey 23. Austria 24. Slovak Republic 25. France 26. New Zealand 27. Korea 28. Greece 29. Poland 30. Estonia 31. Spain 32. Hungary
Predicted life satisfaction, Denmark coefficients, 1981-2007 1. Norway 2. Iceland 3. Denmark 4. Netherlands 5. Switzerland 6. Belgium 7. Luxembourg 8. Israel 9. Portugal 10. Italy 11. Japan 12. Sweden 13. Finland 14. Australia 15. Ireland 16. United Kingdom 17. Slovenia 18. Canada 19. Czech Republic 20. Turkey 21. Germany 22. United States 23. Austria 24. Slovak republic 25. France 26. Korea 27. New Zealand 28. Greece 29. Poland 30. Estonia 31. Spain 32. Hungary
Predicted life satisfaction, France coefficients, 1981-2007 1. Iceland 2. Norway 3. Denmark 4. Netherlands 5. Switzerland 6. Belgium 7. Luxembourg 8. Portugal 9. Italy 10. Japan 11. Israel 12. Ireland 13. Australia 14. Sweden 15. Finland 16. United Kingdom 17. Slovenia 18. Canada 19. Czech Republic 20. United States 21. Germany 22. Turkey 23. Austria 24. Slovak Republic 25. France 26. Korea 27. New Zealand 28. Greece 29. Poland 30. Estonia 31. Spain 32. Hungary
ECO/WKP(2011)90 Conclusions The paper has explored issues with assessing wellbeing in OECD countries based on subjective selfreported life satisfaction surveys. It analyses wellbeing in a pooled regression over time and countries, at the country level and the OECD average. The results, which are in line with previous wider or narrower studies of subjective wellbeing, show that, in addition to income, the state of health, not being unemployed, and social relationships (having friends, not being divorced) are particularly important for wellbeing. Somewhat surprisingly, there is relatively little difference in the key determinants of wellbeing across countries. At the same time, there are some small country differences, for example, income and health tend to be more important in countries performing more poorly on these indicators. The paper also contributes to our understanding of the sensitivity of measures of life satisfaction to cultural differences. Cross country differences in life satisfaction could, in principle, be due to one of four causes: (1) measurement error; (2) country specific fixed effects linked to cultural differences or omitted variables; or (3) different underlying social welfare functions. The results show that, while there are significant country-specific fixed effects that might be ascribed to cultural differences or omitted variables, cultural differences in the relative importance of different determinants of wellbeing are not major drivers of differences in life satisfaction. The structure of the underlying social welfare function appears to be similar across countries. The differences in country rankings were due not to fundamental differences in the relationship between determinants and wellbeing, but rather differences in the measured levels of those determinants (ie, the life circumstances or “stocks” of material living conditions, trust, state of the environment, quality of governance etc…) as well as country-specific fixed effects. An additional point of interest is that correlations between the rankings provided from measures of life satisfaction and rankings of various other indicators of wellbeing such as the HDI and Better Life Index are relatively high. Measures of subjective wellbeing can play an important part in informing policy makers. One use is as a measure of overall progress. An additional use is to contribute to a better understanding of the social welfare function of societies, and thus the relative importance of different outcomes to overall wellbeing. The former use requires that responses to subjective questions are comparable across countries in cardinal terms, while the latter requires that the structure of preferences is relatively stable across countries. Ironically, while much of the literature on measures of subjective wellbeing focuses on the former use, the evidence is better for the latter. Without suggesting that policy makers should overlook the value of measures of subjective wellbeing as a benchmark of progress, there is clearly scope for much greater use of subjective measures to help inform policy makers on what matters for wellbeing.
31
ECO/WKP(2011)90
BIBLIOGRAPHY
Alesina, A., R. Di Tella and R. MacCulloch (2004), “Inequality and Happiness: are Europeans and Americans Different?” Journal of Public Economics, Elsevier, vol. 88, pp. 2009-2042. Alber, J. and N. Gilbert (2010) (eds.), “Comparative Social Models: Comparing Dimensions of Societal Well-Being”, Oxford University Press International Policy Exchange Series. Australian Bureau of Statistics (2002) Annual Report, ABS Australia. Boarini, R., Å. Johansson and M. Mira d’Ercole (2006),“Alternative Measures of Well-Being”, OECD Social, Employment and Migration Working Papers, No. 33. Becker, G. and L. Rayo (2008), “Economic Growth and Subjective Well-Being: Reassessing the Easterlin Paradox. Comments and Discussion”, Brookings Papers on Economic Activity. Clark, A.E., P. Frijters and M. Shield (2007), “Relative Income, Happiness and Utility: An Explanation for the Easterlin Paradox and Other Puzzles” Institute for the Study of Labor (IZA). Clark, A.E. and A.J. Oswald (1994), “Unhappiness and Unemployment”, Economic Journal, Vol. 104, pp. 648-659. Clark, A.E. and C. Senik (2011), “Is happiness different from flourishing? Cross-country evidence from the ESS”, Working Paper 2011-04, Paris School of Economics. Clark, A.E. and C. Senik (2010), “Who compares to whom? The anatomy of income comparisons in Europe”, The Economic Journal, 120, 573-594 Conseil d’Analyse Économique and Sachverstandigenrat (2010), Évaluer la performance économique, le bien être et la soutenabilité, Conseil des ministres franco-allemand, Paris. Deaton, A. (2008), “Income, Health and Well-Being Around the World: Evidence from the Gallup World Poll”, Journal of Economics Perspectives, Vol. 22, No. 2, pp. 53-72. Diener, E. (1995a), “Factors Predicting the Subjective Well-Being of Nations”, Journal of Personality and Social Psychology, Vol. 69, pp. 851-864. Diener, E. (1995b), “A Value Based Index for Measuring National Quality of Life”, Social Indicators Research, Vol. 36, pp. 107-127. Diener, E., R. Lucas, U. Schimmack and J. Helliwell, (2009), “Well-Being for Public Policy”, Oxford University Press, New York. Diener, E. and W. Tov (2006), “National Accounts of Well-being”, in K. Land (ed.), Encyclopaedia of Quality of Life.
32
ECO/WKP(2011)90
Diener, E., J.F. Helliwell and D. Kahneman (2010), International Differences in Well-Being, Oxford University Press, New York Di Tella, R., R.J. MacCulloch, A.J. Oswald (2001), “The Macroeconomics of Happiness” The Warwick Economics Research Paper, Department of Economics. Di Tella, R. and R.J. MacCulloch (2006), “Some Uses of Happiness Data in Economics”, Journal of Economic Perspectives, Vol. 20, No. I, pp. 25-46. Dolan P., T. Peasgood and M. White (2008), “Do we really know what makes us happy? A review of the economic literature on the factors associated with subjective well-being”, Journal of Economic Psychology, Vol. 29, pp 94-122. Duesenberry, J.S (1949), Income, Saving and the Theory of Consumer Behavior, Harvard University Press, Cambridge, MA. Easterlin, R. (1974), “Does Economic Growth Improve the Human Lot? Some Empirical Evidence” in P. David and M. Reder (eds.), Nations and Household in Economic growth: essays in Honor of Moses Abramovitz, New York, academic press. Easterlin, R. (1995), “Will Raising the Incomes of all Increase the Happiness of all?”, Journal of Economic Behavior and Organization, Vol. 27, pp. 35-47 Easterlin, R. (2001), “Income and Happiness: Towards a Unified Theory” Economic Journal, Vol. 111, pp. 465-484 Elster, J. and J. Roemer (1991), Interpersonal comparisons of wellbeing, Cambridge University Press, Cambridge, UK. Ferre-i-Carbonnell, A. and P. Frijters (2004), “How Important is Methodology for the Estimates of the Determinants of Happiness?”, Working Paper, University of Amsterdam, Fleurbaey, M. (2009), “Beyond GDP: The quest for a Measure of Social Welfare”, Journal of Economic Literature, 47:4, 1029-1075. Franck, R.H. (1985), Choosing the right pond; human behavior and quest for status, Oxford University Press, Oxford. Franck, G. (1999), “The Economy of Attention”, Telepolis. Frey, B.S. and A. Stutzer (2000), “Happiness, Economy and Institutions”, The Economic Journal, Vol. 110. (466), pp 918-938. Hagerty et al, (2001) “Quality of Life Indexes for National Policy: Review and Agenda for Research”, Social Indicators Research, Vol. 55, pp. 1-96. Hagerty, M.R. and K.C. Land (2004), “Constructing Summary Indices of Social Wellbeing Constructing Summary Indices of Social Wellbeing: A Model of the Effect of Heterogeneous Importance Weights”, University of California Press.
33
ECO/WKP(2011)90 Helliwell, J. F. (2008) “Life Satisfaction and the Quality of Development”, NBER Working Papers 14507, National Bureau of Economic Research. Helliwell et al. (2009) “International Evidence on the social context of Well Being”, NBER Working Papers 14720, National Bureau of Economic Research. Helliwell et al. (2010), “Trust and Wellbeing” NBER Working Paper 15911, National Bureau of Economic Research. Helliwell, J. F. and C.P. Barrington-Leigh (2010), “Measuring and Understanding Subjective Well-being”, NBER Working Paper 15887, National Bureau of Economic Research. Helliwell, J.F., C.P. Barington-Leigh, A. Harris and H. Huang, (2009), “International Evidence on the Social Context of Well-Being”, NBER Working Paper 14720, National Bureau of Economic Research. Hudson, J. (2006), “Institutional trust and subjective wellbeing across the EU”, Kyklos, Vol. 59, No 1, pp. 43-62, University of Bath. Jones, C.I. and P. Klenow (2010), “Beyond GDP, Welfare Across Countries and Time”, SIEPR Discussion Paper No. 10-001, Stanford Institute for Economic Policy Research. Kahneman D., E. Diener and N. Schwaarz (1999), Well-being. The Foundations of Hedonic Psychology, Russell Sage Foundation, New York. Kahneman, D and A. Deaton (2010), “High income improves evaluation of life but not emotional wellbeing”, Proceedings of the National Academy of Sciences. Kahneman, D., P. Wakker and R. Sarin (1997) “Back to Bentham? Explorations of Experienced Utility”, The Quarterly Journal of Economics, pp. 375-405. Klenow, P. (2006), “Relative Prices and Relative Prosperity”, American Economic Review, 97. Krueger, A.B. and D.A. Schkade (2007), “The Reliability of Subjective Well-being Measures”, NBER Working Paper 13027, National Bureau of Economic Research. Layard, R. (2006), “Happiness and public policy; a challenge to the profession”, Economic Journal, 116, C24-C33. Lucas, R.R. (2007), “Long-Term Disability Is Associated With Lasting Changes in Subjective Well-Being: Evidence From Two nationally Representative Longitudinal Studies.” Journal of Personality and Social Psychology, Vol. 92, (4), pp. 717-730. Mouton, B. (1990), “An illustration of a Pitfall in estimating the effects of Aggregate Variables on Micro Units”, Review of Economics and Statistics, 72, 334-38. Nordhaus, W.D. and J. Tobin (1972), “Is Growth Obsolete?” in W.D. Nordhaus and J. Tobin (eds.) Economic Research: Retrospect and Prospect Vol. 5: Economic Growth, National Bureau of Economic Research. Osberg, L. and A. Sharpe, (2002) Une évaluation de l’indicateur du bien être économique dans les pays de l’OCDE, Séminaire DARES, October.
34
ECO/WKP(2011)90 OECD (2008), Society at a Glance, OECD, Paris. OECD (2010) OECD Economic Survey of Australia, OECD, Paris. OECD (2011a) “Update on STD/CSTAT/BUR(2011)7.
Measuring
Progress
Indicators
Publication:
How’s
Life?”
OECD (2011b) OECD Employment Outlook, OECD, Paris. Pollak, R. (1976), “Interdependent Preferences.” American Economic Review, 66:3 (June) 309-320. Rässler, S. and R.T. Riphahn (2006), “Survey item nonresponse and its treatment”, Allgemeines Statistisches Archiv 90, pp 217-232. Sacks, D., B. Stevenson, and J. Wolfers (2010), “Subjective Well-being, Income, Economic Development, and Growth”, NBER Working Paper 16441, National Bureau of Economic Research. Sapir, A. (2006), Globalisation and the Reform of European Social Models, JCMS 2006 Vol. 44, No. 2, pp.369-90. Stevenson, B. and J. Wolfers, (2008), “Economic Growth and Subjective Wellbeing: Reassessing the Easterlin Paradox”, NBER Working Paper 14282, National Bureau of Economic Research. Stiglitz, J.E., A. Sen and J.P. Fitoussi (2009), Report by the Commission on the Measurement of Economic Performance and Social Progress, http://www.stiglitz-sen-fitoussi.fr/documents/rapport_anglais.pdf. Veblen, T. (1899), The theory of the leisure class: an economic study of institutions, Houghton Mifflin, Boston. Veehoven, R. (2005) “Inequality of Happiness in Nations”, Journal of Happiness Studies, Springer, Vol. 6(4), pp. 351-355, December. Wagner, G.G., J. Schupp and G. Mayraz (2009), “Life satisfaction and relative income: Perceptions and Evidence”, CEP Discussion Papers dp0938, Centre for Economic Performance, LSE. Waldron, S. (2010), Measuring subjective wellbeing in the UK, ONS Working paper, September. Winkelmann, L. and R. Winkelmann (1998), “Why are the unemployed so unhappy? Evidence from Panel Data”, Economica, Vol. 65, No. 257, pp. 1-15
35
ECO/WKP(2011)90
ANNEX 1: DESCRIPTION OF THE VARIABLES
Variables
Description
Life satisfaction (ind)
All things considered, how satisfied are you with life as whole these days? If 1 means you are “completely dissatisfied”, on the scale below and 10 means you are “completely satisfied”, where would you put your satisfaction with your life as a whole ? (1, 2, ….10)
Income (ind)
What is your gross household income, before tax or other deductions, from all sources ? 1: less than 18,000$ per annum 2: $18,001 - $24,000 per annum 3: $24,001 - $34,000 per annum 4: $34,001 - $43,500 per annum 5: $43,501 - $54,000 per annum 6: $54,001 - $64,000 per annum 7: $64,001 - $76,500 per annum 8: $76,501 - $92,000 per annum 9: $92,001 - $115,000 per annum 10: more than $115,000 per annum
Income inequality (avg)
How would you place your views on this scale, where 1 means you agree completely with the statement on the left “incomes should be made more equal” and 10 means you agree completely with statement on the right “we need larger income differences as incentives for individual effort”?
State of health (ind)
All in all, how would you describe your state of health, these days? Would you say it is: very good, good, fair, poor ?
Education (ind)
What is the highest educational level that you have attained? 1: no formal education; 8: Postgraduate degreee
Environmental index (avg)
Emission of air pollutants per capita, as year 2000=1 (WDI World Bank)
Freedom of choice and control (avg)
Some peopole feel they have completely free choice and control over their lives, while other people feel that what they do has no real effect on what happens to them. Please use this scale where 1 means “no choice at all” and 10 means “ a great deal of choice” to indicate how much freedom of choice and control do you feel you have over the way your life turns out ?
36
ECO/WKP(2011)90 Important in life: friends (ind)
How important it is in your life: friends ? Very important, rather important, not very important, not at all important
Trust in people (avg)
Generally speaking, would you say that most people can be trusted or that you need to be very careful in dealing with people? 1: most people can be trusted, 2: need to be very careful
CPI index (avg)
Broadly speaking the surveys and assessments used to compile the index include questions relating to bribery of public officials, kickbacks in public procurement, embezzlement of public funds, and questions that probe the strength and effectiveness of public sector anticorruption efforts.
37
ECO/WKP(2011)90
ANNEX 2: CORRELATIONS BETWEEN EXPLANATORY VARIABLES
Log Income
State of health
To be unemployed
Educational level
Important in life: friends
Gender
Age
Divorce
1
--
--
--
--
--
--
--
State of health
0.23
1
--
--
--
--
--
--
To be unemployed
-0.15
-0.03
1
--
--
--
--
--
Educational level
0.37
0.25
-0.07
1
--
--
--
--
Important in life: friends
-0.03
-0.14
0.01
-0.10
1
--
--
--
Gender
-0.05
-0.01
-0.03
-0.01
-0.06
1
--
--
Age
-0.12
-0.27
-0.09
-0.25
0.10
-0.03
1
--
Divorce
-0.09
-0.02
0.03
-0.00
0.00
0.04
0.08
1
Log Income
Income inequality
Unemployment rates
Environmental index
Freedom of choice and control
Trust in people
CPI Index
Income
1
--
--
--
--
--
--
Unemployment rates
-0.30
1
--
--
--
--
--
Environmental index
-0.13
0.17
1
--
--
--
--
Freedom of choice
-0.17
-0.19
0.10
1
--
--
--
Trust in people
-0.06
-0.18
-0.15
0.28
1
--
--
CPI index
0.30
0.27
-0.02
-0.51
-0.66
1
--
Income
0.13
-0.40
-0.23
0.31
0.37
-0.36
1
Income Inequality
38
ECO/WKP(2011)90
ANNEX 3: DESCRIPTIVE STATISTICS
Figure A3.1. Descriptive statistics of some explanatory variables
1
Facilitating the interpretation of the slope coefficients of estimats, we rescale this measure as Corruption=10-CPI score, see page 11. Source: WVS.
39
ECO/WKP(2011)90 WORKING PAPERS The full series of Economics Department Working Papers can be consulted at www.oecd.org/eco/workingpapers/
920.
Russia: progress in structural reform and framework conditions (December 2011) by Yana Vaziakova, Geoff Barnard and Tatiana Lysenko
919.
Explaining the interest-rate-growth differential underlying government debt dynamics (December 2011) by David Turner and Francesca Spinelli
918.
Reassessing the NAIRUs after the crisis (December 2011) by Stéphanie Guichard and Elena Rusticelli
917.
Employment protection legislation and plant-level productivity in India (December 2011) by Sean Dougherty, Verónica Frisancho Robles and Kala Krishna
916.
Systemically important banks and capital regulation challenge (December 2011) by Patrick Slovik
915.
Improving educational outcomes in Slovenia (December 2011) by Mehmet Eris
914.
Addressing challenges in the energy sector in Israel (December 2011) by Philip Hemmings
913.
Issues in private sector finance in Israel (December 2011) by Philip Hemmings
912.
How to improve the economic policy framework for the housing market in Israel (December 2011) by Philip Hemmings
911.
Fiscal Prospects and Reforms in India (December 2011) by Richard Herd, Sam Hill and Vincent Koen
910.
Structural reforms to reduce unemployment and restore competitiveness in Ireland (December 2011) by Álvaro Pina
909.
Getting back on track: restoring fiscal sustainability in Ireland (December 2011) by David Haugh
908.
A welfare analysis of climate change mitigation policies (November 2011) by Alain de Serres and Fabrice Murtin
907.
Overcoming the banking crisis in Ireland (November 2011) by Muge Adalet McGowan
906.
Macroeconomic and structural policies to further stabilise the Mexican economy (November 2011) by Cyrille Schwellnus
905.
Reaping the benefits of a transition to greener growth in Slovakia (November 2011) by Caroline Klein 40
ECO/WKP(2011)90
904
Fiscal reform for a stronger fairer and cleaner Mexican economy (October 2011) by Nicola Brandt and Rodrigo Paillacar
903
The demand for safe assets in emerging economies and global unbalances: new empirical evidence (October 2011) by Rudiger Ahrend and Cyrille Schwellnus
902.
Drivers of systemic banking crises: the role of bank-balance-sheet contagion and financial account structure (October 2011) by Rudiger Ahrend and Antoine Goujard
901
Explaining the appreciation of the Brazilian Real (October 2011) by Annabelle Mourougane
900
Raising investment in Brazil (October 2011) by Jens Arnold
899
Refining macroeconomic policies to sustain growth in Brazil (October 2011) by Annabelle Mourougane
898.
Promoting infrastructure development in Brazil (October 2011) by Annabelle Mourougane and Mauro Pisu
897.
Austria: public sector inefficiencies have become less affordable (October 2011) by Karin Fischer, Rauf Gönenç and Robert Price
896.
Informality in Mexico (September 2011) by Nicola Brandt
895.
Reforming Austria’s highly regarded but costly health system (September 2011) by Rauf Gönenç, Maria. M. Hofmarcher, Andreas Wörgötter
894
Greener growth in the Belgian federation (September 2011) by Tomasz Koźluk
893.
Green growth and climate change policies in New Zealand (September 2011) by Alexandra Bibbee
892.
Has deregulation increased investment in infrastructure? Firm-level evidence from OECD countries (September 2011) by Sónia Araújo
891.
Ensuring a Sustainable and Efficient Fishery in Iceland (September 2011) by Gunnar Haraldsson and David Carey
890.
Japan’s New Growth Strategy to create demand and Jobs (September 2011) by Randall S. Jones and Byungseo Yoo
889.
Labour market reforms in Japan to improve growth and equity (September 2011) by Randall S. Jones and Satoshi Urasawa
41