Exploring Eye Movements with Node-Link Graph Layouts Tanja Blascheck, Michael Burch, Tobias Meisel, Tobias Schneider, and Safak Mumin
Abstract Analyzing eye movement data is challenging, in particular if visualizations are used that directly show the eye movements on the stimulus. However, the context information is important to identify visual scanning strategies in context to the semantics of the displayed stimulus. In this paper, we investigate the idea of providing node-link diagrams using multiple graph layouts directly linked to a visual stimulus, but in separate views. Each layout benefits from different aspects and typically, a combination of them is difficult or even impossible. Hence, more of them are provided in multiple linked views. The nodes of a graph hereby model areas of interest (AOIs) while the weighted links denote the transitions between the AOIs. We compare multiple common and easy to implement graph layout algorithms to extract different scanning strategies. Additionally, we illustrate the usefulness of our technique by applying it to a formerly conducted eye tracking study focusing on route finding tasks in public transport maps.
1 Introduction Data collected during eye tracking studies can be analyzed using qualitative or quantitative methods. A qualitative evaluation of eye movement data using visualizations can lead to insights about the scanning behavior of participants. This more visual form of analysis relies on the strengths of the perceptual abilities of an analyst [2]. However, in visual analytics systems developed for eye movement data [6], not only algorithmic or statistical analyses of the data are supported but also a combined analysis with interactive visualization techniques. Tanja Blascheck INRIA, Paris e-mail:
[email protected] Michael Burch, Tobias Meisel, Tobias Schneider, Safak Mumin VISUS, University of Stuttgart, Stuttgart, Germany e-mail:
[email protected]
1
2
Blascheck et al.
Graph visualizations, in particular, node-link diagrams are a powerful concept to reflect the principle of connectedness between groups of objects. To be more specific, graph nodes can model defined areas of interest (AOIs) while graph links can visually encode the transitions between those AOIs. In addition, a node-link diagram can then also be linked to the stimulus to convey contextual information that is otherwise lost. This can be done by overplotting the stimulus or by showing more of the graph layouts side-by-side in multiple linked views. Interaction is a crucial concept since the generation of such node-link diagrams depends on aggregation levels (over space and time) defined by the data analyst. One graph layout is not sufficient since different tasks with eye tracking nodelink diagrams have to be solved, all requiring to inspect the AOI transition data from different perspectives. For example, if an analyst is interested in symmetries between related AOIs, a force-directed layout [5] might be the right choice. If the flow of visual attention should be reflected, a hierarchical layout [14] is more suitable. Finally, a radial layout [13] is useful when all AOIs are treated similarly. We present a multiple-coordinated views [11] approach to analyze and compare multiple graph layouts for eye movement data. An analyst can change the spatial and temporal granularity, correlate the visual stimulus and the different graph layouts using brushing-and-linking [1], and investigate properties of the nodes.
2 Concept Analyzing eye movement data requires to support multiple different analysis tasks [6]. Node-link diagrams offer such a multi-analysis, because different graph layout algorithms can be generated to show different aspects of the AOI transitions.
2.1 Previous Work Many eye tracking data visualizations have been developed [2] with attention maps [3] and gaze plots [8, 9] being the most popular ones. However, attention maps aggregate the data temporally and gaze plots suffer from overplotting. In the survey by Blascheck et al. [2], AOI-based methods provide an option to compare and relate interesting regions on a stimulus. Here, graph-like methods are an excellent way of conveying this information. Most of these techniques either represent graphs statically [2, Section 6.3] or dynamically [4]. However, in both cases the layout of the graph is fixed and cannot be changed during an analysis. Moreover, in many cases the eye movement data visualizations are directly placed on top of the stimulus to better support a data analyst with contextual information. This approach can be problematic for two reasons: (1) the stimulus is occluded and important semantical information can be lost and (2) the visual repre-
Exploring Eye Movements with Node-Link Graph Layouts
3
sentatives are fixed to the corresponding spatial positions in the stimulus making a different perspective on the data impossible. We reflect on different graph layouts and to compare graphs depicting AOI transitions with either a force-directed [5], hierarchical [14], or radial [13] layout.
2.2 Design Choices We primarily base our design decisions on previous work in the field. We found that most of the approaches suffer from stimulus occlusions and layout restrictions (like visual attention maps or gaze plots). This forced us to first transform the eye movements into user-defined AOIs while transitions between those are modeled as weighted and directed relations. This data is representable as node-link diagram since it has an inherent relational structure, but there exist different layouts, all with pros and cons, hence our decision to check the strength of a combination of those in multiple views. To explore eye movement data using node-link diagrams, our approach currently offers three different graph layout options which can be compared with each other. Currently, the approach provides a force-directed layout, a hierarchical layout, and a circular layout since those are the most prominent ones and they are easy to implement, serving as a starting point for further layout extensions. Node-link diagrams abstract from the the original eye movement data, making it easier and faster to get an overview about the eye movements. Moreover, graphs are well-understood diagrams and hence, are also useful for non-experts.
2.3 Graph Visualizations The eye movement data is first preprocessed by taking into account the scanpaths and the user-defined spatial and temporal aggregation. This process builds a set of AOIs and a set of weighted transitions in-between giving a weighted directed graph structure which is representable in different layouts. In the context of this paper, we model a graph as G = (V, E). The vertices V are the aggregated fixations into AOIs and the edges E = V ×V are the corresponding transitions between the AOIs (see also Burch et al. [4]). Our approach offers three layout options. We generate a node-link diagram with a force-directed layout using the Fruchterman-Reingold algorithm [5]. This layout type is especially useful to depict groups in the graph. It allows to find paths, subgraphs, and symmetries between related groups [10]. However, the Sugiyama [14] algorithm can generate a hierarchical layout of the eye movement data. A hierarchical structure can depict a flow of visual attention. Last, a radial layout [13] is used, which treats all regions similarly. A linear order between the nodes has to be computed for the nodes in order to show clusters or reduce visual clutter [12].
4
Blascheck et al.
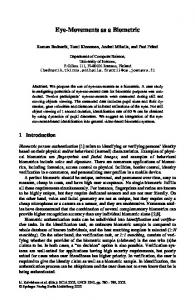
Fig. 1 In this example, A) depicts the list of participants and stimuli loaded. B) shows an example stimulus with a 20 × 20 grid and the generated graph. The same fixation data shown using a C) hierarchical layout, D) a force-directed layout, and E) a circular layout.
2.4 Prototype We implemented a prototype using Java and the JavaFX framework. An analyst can first choose the grid size which is used to generate the graph. All fixations are aggregated based on the grid and a graph structure using a linked list. Each element in the list contains information about the x- and y-coordinates, the timestamp, and fixation duration. Additionally, the predecessor and successor of each node are saved. The prototype depicted in Figure 1 is a multiple-coordinated view approach with five views. On the left, Figure 1 A shows a list of stimuli and participants currently loaded. On the right, four multiple-coordinated views can be loaded: In Figure 1 B the stimulus with the grid and the chosen grid size is shown. The generated graph is overlaid on the stimulus. Additionally, an analyst can show the graph independent of the stimulus. In Figure 1 C, the hierarchical layout is depicted, in Figure 1 D the force-directed, and in Figure 1 E the circular layout. An analyst can interact with the graphs shown in each view. A zoom and pan option is available to resize and move the stimulus and graph. Furthermore, a brushingand-linking-based approach can be used to select individual nodes in the graph. When selecting a node, an analyst can choose a specific color for this node and all other views are updated and highlight the node with the selected color. Additionally, all successors and predecessors of a node can be highlighted as well. This requires that a node has to be selected and highlighted first, then the successors and predecessors are highlighted in the same color. Additional information about the node is shown as well: the average x- and y-coordinate of the fixation node; the average
Exploring Eye Movements with Node-Link Graph Layouts
5
timestamp of the fixation node; the average duration of the fixation node; and the number of fixations aggregated into the fixation node.
3 Application Example and Discussion In the following, we analyze data from an eye tracking study [7]. In the study, participants had to find a path from a source to a destination station using different public transportation maps. For detailed information, we refer to the original study by Netzel et al. [7]. In our example, we analyze one stimulus depicting a metro map from Hamburg, Germany. We describe some insights we were able to gain using the different layouts with a grid size of 20 rows and 20 columns. For the force-directed layout, we found some graphs which have a center element leading to a graph with multiple subgroups. For the circular layout, we retrieved a number of graphs that only have a few nodes, which were visited multiple times. In some cases, we can observe that when participants revisit a node, they perform a cross-checking to confirm their answer for the task. In the hierarchical layout, we found that most of the generated graphs have many hierarchy levels and each level only contains one or two nodes. With the chosen grid size (20 rows and 20 columns), some of the graphs are cluttered, because the fixations are not aggregated enough. In these cases using a grid size of 15 columns and 15 rows or even less is helpful to reduce the number of nodes. In order to compare participants, choosing the same grid size is important.
4 Conclusion In this paper, we presented an approach using node-link diagrams of eye movement data. Our approach allows to use different levels of granularity to aggregate fixations and to generate node-link diagrams. We use three different graph layout algorithms, namely force-directed, hierarchical, and radial, to represent the node-link diagrams. These different layouts allowed us to compare data from an eye tracking study analyzing public transportation maps.
5 Acknowledgments Public transportation maps are designed by Robin Woods (www.robinworldwide.com) and licensed from Communicarta Ltd (www.communicarta.com).
6
Blascheck et al.
References [1] Becker R, Cleveland W (1987) Brushing scatterplots. Technometrics 29(2):127–142 [2] Blascheck T, Kurzhals K, Raschke M, Burch M, Weiskopf D, Ertl T (2017) Visualization of eye tracking data: A taxonomy and survey. Computer Graphics Forum [3] Bojko A (2009) Informative or misleading? Heatmaps deconstructed. In: Human-Computer Interaction – INTERACT, Springer, pp 30–39 [4] Burch M, Beck F, Raschke M, Blascheck T, Weiskopf D (2014) A dynamic graph visualization perspective on eye movement data. In: Proceedings of the Symposium on Eye Tracking Research & Applications, ACM, pp 151–158 [5] Fruchterman T, Reingold E (1991) Graph drawing by force-directed placement. Software: Practice and Experience 21(11):1129–1164 [6] Kurzhals K, Burch M, Blascheck T, Andrienko G, Andrienko N, Weiskopf D (2017) A task-based view on the visual analysis of eye tracking data. In: Burch M, Chuang L, Fisher B, Schmidt A, Weiskopf D (eds) Eye Tracking and Visualization, Springer, pp 3–22 [7] Netzel R, Ohlhausen B, Kurzhals K, Woods R, Burch M, Weiskopf D (2017) User performance and reading strategies for metro maps: An eye tracking study. Spatial Cognition & Computation 17(1–2):39–64 [8] Noton D, Stark L (1971) Scanpaths in eye movements during pattern perception. Science 171(3968):308–311 [9] Noton D, Stark L (1971) Scanpaths in saccadic eye movements while viewing and recognizing patterns. Vision Research 11(9):929–942 [10] Pohl M, Schmitt M, Diehl S (2009) Comparing the readability of graph layouts using eyetracking and task-oriented analysis. In: International Symposium on Computational Aesthetics in Graphics, Visualization, and Imaging, Blackwell Publishing Ltd, pp 49–56 [11] Roberts J (2004) Exploratory visualization with multiple linked views. In: Dykes J, MacEachren A, Kraak MJ (eds) Exploring Geovisualization, Elsevier Science BV, pp 149–170 [12] Rosenholtz R, Li Y, Mansfield J, Jin Z (2005) Feature congestion: A measure of display clutter. In: Proceedings of the SIGCHI Conference on Human Factors in Computing Systems, ACM, pp 761–770 [13] Six J, Tollis I (2006) A framework and algorithms for circular drawings of graphs. Journal of Discrete Algorithms 4(1):25–50 [14] Sugiyama K, Tagawa S, Toda M (1981) Methods for visual understanding of hierarchical system structures. IEEE Transactions on Systems, Man, and Cybernetics 11(2):109–125