model based search engine can be used for trend analysis, which is an ..... price of raw oil companies growth company in Estonia incline of prices marks banks.
Exploring Independent Trends in a Topic-Based Search Engine Jukka Perki¨o, Wray Buntine and Sami Perttu
July 4, 2004
HIIT TECHNICAL REPORT 2004–12
Exploring Independent Trends in a Topic-Based Search Engine Jukka Perki¨o, Wray Buntine and Sami Perttu
Helsinki Institute for Information Technology HIIT Tammasaarenkatu 3, Helsinki, Finland PO BOX 9800 FI-02015 TKK, Finland http://www.hiit.fi
HIIT Technical Reports 2004–12 ISSN 1458-9478 URL: http://cosco.hiit.fi/Articles/hiit-2004-12.pdf
c 2004 held by the authors Copyright
NB. The HIIT Technical Reports series is intended for rapid dissemination of results produced by the HIIT researchers. Therefore, some of the results may also be later published as scientific articles elsewhere.
Exploring Independent Trends in a Topic-Based Search Engine Jukka Perki¨o, Wray Buntine and Sami Perttu Complex Systems Computation Group Helsinki Institute for Information Technology P.O. Box 9800, FIN-02015 HUT, Finland {firstname}.{lastname}@hiit.fi
Abstract Topic-based search engines are an alternative to simple keyword search engines that are common in today’s intranets. The temporal behaviour of the topics in a topic model based search engine can be used for trend analysis, which is an important research goal on its own. We apply topic modelling to an online financial newspaper data and show that some of the trends in the topics are consistent with common understanding.
1
Introduction
The huge amount of information available on the Web makes search and retrieval a critical task, especially for corporations and other organizations whose online information has been dubbed “digital assets” to stress its value. Topic models are potentially a more elegant approach than pure keyword search: users respond favourably to the display of topics on results pages, for instance [5]. Topic structure can be given, as is the case for large directory engines such as Yahoo or DMOZ1 , or it can be learned from the data. In our implementation, a topical representation is incorporated automatically with documents and included in the index. This provides a complement to keyword search and TF-IDF methods of traditional information retrieval [1]; both topics and key words can be relevant when retrieving a document. A single document, rather than being explained by a single topic, is normally explained by several different topics in both the library sciences and the newspaper business. For instance, a web page in DMOZ can be indexed under both Science and Children. For this reason, standard statistical clustering methods, which perform a mutually exclusive and exhaustive partitioning, are not adequate for developing the topical structures automatically. Queries to a topic model are performed in principle in 1 http://www.dmoz.org.
the following way: Keywords are used in the normal way for retrieving and ranking documents. In addition, a topical representation for a query is calculated, i.e., its distribution over the topic space. That distribution is compared to the similar distribution for the documents. The top retrieved documents are re-ranked according to the statistical distance between the query and the documents over the topic space. In principle topic models should work better than simple word index searches as they are supposed to represent the semantics of a document better than single word frequencies. Within this context, topic-based search engines, we are looking at the applications for trend detection and trend analysis. Such analysis of textual data has been used in the financial sector and the intelligence community. While an extensive body of research exists in the area of Topic Detection and Tracking2 and in the TREC information filtering tasks, these are supervised tracking tasks, and not unsupervised tracking, as we pursue here. In trend analysis we are interested in the temporal behaviour of the topic variables our system automatically creates. The rest of this paper is organised as follows. In Section 2 we explain our statistical topic model that uses MPCA (multinomial principal component analysis) [7, 3]. This is a model, which is proving successful in a variety of modes in text analysis [6, 12], and we use it as the method for creating the topics and measuring trends. In Section 3 we explain our data, its preprocessing and our empirical experiments and finally in Section 4 we draw some conclusions on our approach and discuss future research directions.
2
The topic model
The topic model we use is based on a recent discrete or Multinomial version of Principal Components Analysis (MPCA). These so-called multi-aspect topic models are a statistical model for documents that allow multiple topics 2 http://www.nist.gov/speech/tests/tdt/
to co-exist in the one document [7, 2, 6]. They are directly analogous to the Gaussian basis of PCA which in its form of Latent Semantic Analysis (LSA) has been extensively explored in the text analysis community, but is not as well used in applications. Several kinds of experiments report MPCA methods have superior statistical properties to LSA, and the resultant components are also easier to interpret [7, 2, 6]. The simplest version of MPCA consists of a linear admixture of different multinomials, and can be thought of as a generative model for sampling words to make up a bag, for the Bag of Words representation for a document [1]. • We have a total count L of words to sample. • We partition these words into KPtopics, components or aspects: c1 , c2 , ...cK where k=1,...,K ck = L. This is done using a hidden proportion vector m ~ = (m1 , m2 , ..., mK ). The intention is that, for instance, a sporting article may have 50 general vocabulary words, 40 words relevant to Germany, 50 relevant to football, and 30 relevant to people’s opinions. Thus L=170 are in the document and the topic partition is (50,40,50,30). • In each partition, we then sample words according to the multinomial for the topic, component or aspect. This is the base model for each component. This then yields a bag of word counts for the k-th partition, w ~ k,· = (wk,1 , wk,2 , ..., wk,J ). Here J is the dictionary size, the size of the basic multinomials on words. Thus the 50 football words are now sampled into actual dictionary entries, “forward”, “kicked”, “covered” etc. • The partitions are then combined additively, hence the term admixture, to make a distinction with classical mixture models. This yields the final sample of words ~r = (r1 , r2 , ..., rJ ) by totalling P the corresponding counts in each partition, rj = k=1,...,K wk,j . Thus if an instance of “forward” is sampled twice, as a football word and a general vocabulary word, then we return the count of 2 and its actual topical assignments are lost, they are hidden data. This is a full generative probability model for the bag of words in a document. The hidden or latent variables here are m ~ and w ~ for each document, whereas ~c is derived. The proportions m ~ correspond to the components for a document, and the counts w ~ are the original word counts broken out into word counts per component. There are two computationally viable schemes for learning these models from data. The mean field approach [2, 3] and Gibbs sampling [10, 6]. Gibbs sampling is usually not considered feasible for large problems, but in this application it is comparable to the mean field approach for training, and thus has become our method of choice. We have our
own implementation of these methods available as an open source package.
2.1
Independence of the topics
For trend analysis, MPCA topics have the nice property [4] that the topics for a document are statistically independent. This is important if one is mainly interested in independent trends. The research concerning time series analysis using ICA [8] should also be noted, e.g. [9], although it is accepted that ICA has not been developed with discrete data in mind, and thus its application to text lacks the statistical basis of MPCA.
2.2
Temporal topics
If the documents’ date information is known then there is a very simple way to track the changes in the topics’ strength in the model. Given the resolution that is desired one has to histogram component strengths for documents over time. Note each document has some proportion in each topic. These proportions are usually sparse: for instance a single document might include 5 topics out of the 111 in the model. These proportions are averaged for all documents in a given time point. Let bi be the bin number for document i, and mi,k be the proportion of document i in the k-th component, then relativePnumber of documents in component k at bin t is given by i 1bi =t mi,k .
3
Experiments
In our experiments we used articles from the Finnish financial newspaper Kauppalehti3 from the years 1994 to 2003. Kauppalehti is a financial news provider in Finland. Although its content is mainly financial it also has some coverage of non-financial events.
3.1
Data
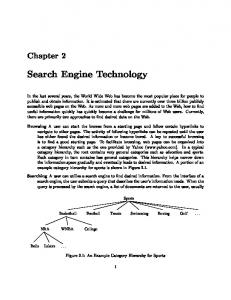
The dataset contains about 200000 documents from the years 1994-2003 varying in length from about 20 words to about 500 words. For the year 2003 we have only documents from the first nine months. The number of documents for each year is shown in Figure 1. Note all our time plots are scaled according to these frequencies so that 2002 is not always the most common year in a model. As the documents are newspaper articles they are classified into predefined categories but the classification is quite coarse and thus not very useful for topical analysis. E.g., there is only one “news” category under which all the news 3 http://www.kauppalehti.fi/
Topics are named semi-automatically as follows. We obtain descriptive nominal phrases for a topic automatically. But these alone cannot be used as names. The problem with statistical phrase generation is that even though many of the phrases are generally descriptive and useful, some generated phrases are poor, and phrases lack the conceptual generalisation required for good naming. We view them instead as key-phrases. They are valuable when used as the intermediate level in the naming process. We name the topics using a two level process, first phrase generation and second a manual step using generated nominal phrases, word occurrences and titles as the basis for naming.
Number of documents per year 35000
Number of documents
30000
25000
20000
15000
10000
5000 1994
1995
1996
1997
1998
1999
2000
2001
2002
2003
Year
Figure 1. The number of documents for each year.
articles go. Because of this we did not use predefined categories but concentrated on the topics we learned with the topic model.
3.2
Pre-processing
The data is first run through an external parser to normalise word forms to their lemmas and to obtain part-ofspeech and some other information needed to detect nominal phrases, which we have a use for later. With over 2000 distinct versions of the verb “to shop” in Finnish, information retrieval suffers without lemmatization or similar preprocessing. We use Connexor’s4 Functional Dependency Grammar (FDG) parser, which is a commercial parser for Finnish and other languages. For the topic model we retain only verbs, nouns, adjectives and adverbs. Common stop-words are also removed. Then we further remove all words that appear three or less times in the data. After this we have a lexicon of about 190000 lexemes, which is about 22% of the original 900000 lexemes contained in the documents. This leaves about 21 million words in total in the full dataset.
3.3
Topics
We built a 111-component topic hierarchical model of the data described above. This is like the flat models of Section 2 but adds some hierarchical structure using methods from [4]. The model is a three level balanced tree so that below the root node there are ten child nodes each having ten children. Topics are generally very descriptive as they describe documents well. 4 http://www.connexor.com
3.4
Obtaining Descriptive Phrases
The phrases shown in the component tables are generated by a simple algorithm that looks for descriptive nominal phrases, i.e., phrases that have a noun as a headword with zero or more attributes. Note that nouns appearing alone are also considered nominal phrases. When generating phrases for a component, each document in the collection is classified according to the proportion allocated to the component: If the proportion is lower than a threshold α, the document is considered a negative example. If the proportion is higher than another threshold β > α, the document is considered a positive example. Otherwise the document is ignored. For the experiments in this paper we have 5 1 and β = K , where K is used the magic values α = 5·K the number of components in the topic model. The naming process is not particularly sensitive to these values. The score for a noun phrase is the fraction of positive examples it appears in minus the fraction of negative examples it appears in. Thus we think of the phrases as attempting to predict the appearance of a component. The ones with the highest scores are the most descriptive. There are many other possible choices for the score, and several have been investigated as so-called co-occurrence scores. The difficulty is balancing the weight given to positive and negative examples, and popular scores include statistical independence tests such as mutual information and the T-score. In our case, in order to obtain descriptive phrases with sufficient generality, we are prepared to tolerate some appearances in negative examples in exchange for a single appearance in a positive example. This is evident in the score since negative examples outnumber positive examples approximately by a factor of K, yet the accuracy in both samples is weighted equally. Some topics and their top 10 most important phrases are shown in tables 3 and 2. For the naming about 30-50 phrases were used. Often good names for a topic do not occur in the documents themselves, since the naming step involves conceptual generalisation from content.
Revenue Ltd. CEO euros company revenue Nokia revenue per share company’s turnover net revenue yearly revenue
East-Europe in Russia year in a country in Estonia in Poland last year Baltic countries revenue per share revenue of euros Russian markets
Raw materials companies price price of raw oil incline of prices price of oil Finnish companies price of electricity decline of prices public sector small companies
Taxation taxation taxes companies marks payments coming tax authority percents VAT dividend
Sales year percents growth banks last year sales next year Sonera till the end of year percents growth
Table 1. Five of the ten second level topics and ten of their most important phrases. Phrase a place one day on the road in summer hotel a city some hours in the beach an island a kilometer
Score 0.1245 0.0992 0.0940 0.0880 0.0775 0.0770 0.0553 0.0454 0.0425 0.0358
Phrase stock investors stock market of Helsinki trade trader of trade initial public offering in London HEX company’s stock
Table 2. Topic “Vacations”.
3.5
Trend analysis
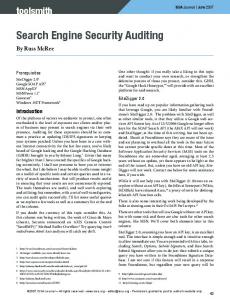
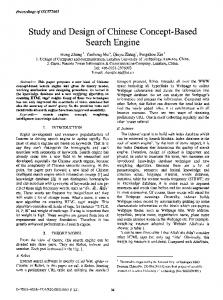
We use the topic model for our trend analysis. We are not analysing real time signals in a sense that we first perform MPCA partitioning and then we observe the temporal behaviour of the topics. This approach is natural as we are using an unsupervised method to learn topics or categories. More traditional methods e.g. naive counting of occurrences of a single lexeme would not work with our topic model as lexemes are not exclusively assigned to topics. Most interesting trends are naturally the ones that show some temporal change but it may also be valuable to know that the strength of some topics remains constant. At this point we do not do a complete analysis of the topical trends rather we are interested in exploring the topics and seeing whether they can be used as means for trend analysis and whether they can be explained by some events that have happened during the time that we have our material from. Topics that show cyclical behaviour are interesting. In the Figure 2 the behaviour of topic “Vacations” is shown. This topic shows clear cyclical behaviour with a cycle of one year. This behaviour is very intuitive as there is one main holiday season a year. Topic “International stock markets” in Figure 3 is also
Score 0.1349 0.1220 0.0598 0.0594 0.0414 0.0387 0.0366 0.0277 0.0228 0.0216
Table 3. Topic “International stock markets”. very intuitive as it shows almost exactly the behaviour one would expect. The topic is first almost linearly ascending till 2000-2001 and then rapidly descending. This behaviour can be justified well from stock market activities. Topic trends seem promising as most of the topics have very intuitive temporal behavior. As we are dealing with data that comes from a newspaper it has to be remembered that there are many factors that affect the writing. Editorial matters are one, the newspaper’s publishing policy may change and also the editors change. When explaining the behavior of a particular topic it must be remembered that not only the events that are reported make the effect but also the reporters. Solely from the trend analysis perspective the selection of data sources is an important question, which is discussed e.g. in [11]. For our task that is not a problem as our aim is to analyze the topics that are present in the data that a search engine handles.
4
Conclusions
We have applied a statistical topic model to a financial online newspaper data. This model is then used for exploring the temporal behavior of the topics, which is the main contribution of this paper. We have shown that the
Acknowledgments
Topic: Vacations 0.006 Temporal strength of the topic
This work was supported in part by the Academy of Finland, under the project Prose, in part by the National Technology Agency, under the project Search-Ina-Box and in part by the IST Programme of the European Community, under the PASCAL Network of Excellence, IST-2002506778. This publication only reflects the authors’ views.
0.005
Strength
0.004
0.003
0.002
References 0.001
0 01/94
01/95
01/96
01/97
01/98
01/99
01/00
01/01
01/02
01/03 09/03
[1] R. Baeza-Yates and B. Ribeiro-Neto. Modern Information Retrieval. Addison Wesley, 1999.
Month/Year
[2] D. M. Blei, A. Y. Ng, and M. I. Jordan. Latent Dirichlet allocation. Journal of Machine Learning Research, 3:993–1022, 2003.
Figure 2. Topic “Vacations”. Topic: International stock markets
[3] W. Buntine. Variational extensions to EM and multinomial PCA. In ECML 2002, 2002.
0.008 Temporal strength of the topic 0.007
[4] W. Buntine and A. Jakulin. Applying discrete PCA in data analysis. In UAI-2004, Banff, 2004.
0.006
Strength
0.005
[5] O. Drori. How to display search results in digital libraries-user study. In NDDL 2003, pages 13–28, 2003.
0.004
0.003
0.002
[6] T. Griffiths and M. Steyvers. Finding scientific topics. PNAS Colloquium, 2004.
0.001
0 01/94
01/95
01/96
01/97
01/98
01/99
01/00
01/01
01/02
01/03 09/03
Month/Year
Figure 3. Topic “International stock markets”.
[7] T. Hofmann. Probabilistic latent semantic indexing. In Research and Development in Information Retrieval, pages 50–57, 1999. [8] A. Hyv¨arinen, J. Karhunen, and E. Oja. Independent Component Analysis. John Wiley & Sons, 2001.
topics acquired by the model are able to reflect changes in the prevailing trends and that they are consistent with the common understanding about events. This approach of using a search engine for getting a better understanding about the temporal changes in the world is very natural but also very convenient as the need for search technology is growing rapidly. Our method can be seen as discrete version of ICA for time series data with the exception that we estimate discrete independent topics for the whole data and then explore their temporal behavior. The results are preliminary but nevertheless encouraging. For future work, the predictive quality of the topics should be investigated and compared to other methodologies. The trend information could be used for refining the queries and thus improving the search results. The query model could also take into account the temporal information that is available.
[9] K. Kiviluoto and E. Oja. Independent component analysis for parallel financial time series. In International conference on neural information processing, ICONIP’98, pages 895–898, 1998. [10] J. Pritchard, M. Stephens, and P. Donnelly. Inference of population structure using multilocus genotype data. Genetics, 155:945–959, 2000. [11] Z. Yan and A. Buchmann. Evaluating and selecting web sources as external information resources of a data warehouse. In Web Information Systems Engineering, WISE2002, 2002. [12] Y. Zhang, J. Callan, and T. Minka. Novelty and redundancy detection in adaptive filtering. In Proceedings of the 25th annual international ACM SIGIR conference on Research and development in information retrieval, pages 81–88. ACM Press, 2002.