Exploring Large Profiles with Calling Context Ring Charts Philippe Moret
Walter Binder
Alex Villazón
Faculty of Informatics University of Lugano Switzerland
Faculty of Informatics University of Lugano Switzerland
Faculty of Informatics University of Lugano Switzerland
[email protected]
[email protected] Danilo Ansaloni
[email protected]
Faculty of Informatics University of Lugano Switzerland
[email protected] ABSTRACT
separately for each calling context, such as the number of method invocations or the CPU time spent in a calling context. A calling context is a sequence of methods that were invoked but have not yet completed; that is, a calling context corresponds to the methods represented on the call stack at some moment during program execution. Calling context profiling helps analyze the dynamic interprocedural control flow of applications. This technique is particularly important for understanding and optimizing object-oriented software, where polymorphism and dynamic binding often hinder static analyzes. Typically, object-oriented applications make use of many short methods such that the inter-procedural control flow can become very complex. The Calling Context Tree (CCT) [1] is a prevailing datastructure for representing calling context profiles. Each node in the CCT corresponds to a calling context and stores the measured dynamic metrics for that calling context. There is a large body of work dealing with different techniques to generate CCTs [1, 7, 2, 4], highlighting the importance of the CCT for calling context profiling. CCTs are often huge trees, sometimes comprising millions of nodes. Furthermore, the depth of CCTs can be high; CCTs with 50– 400 levels are common in practice. Hence, there is need for a compact representation of CCTs helping the developer analyze dynamic program behavior. Prevailing tools supporting calling context profiling typically present the CCT as an expandable tree. However, exploring large and deep CCTs, such as for locating invocations of a particular method in various calling contexts, is cumbersome with an expandable tree representation. In this paper, we discuss Calling Context Ring Charts (CCRCs) [3], a way of visualizing and analyzing CCTs. In a CCRC, the CCT root is represented as a circle in the center. Callee methods are represented by ring segments surrounding the caller’s ring segment. With CCRCs it is possible to display all calling contexts of a CCT in a single chart, preserving the caller/callee relationships conveyed in the CCT. For a detailed analysis of certain calling contexts, CCT subtrees can be selected to be visualized separately and the tree depth can be limited [3]. In this paper we present two CCRC visualizations; for more details see [3]. First, for each caller, the ring segments of the callees have the same size and completely surround the caller’s ring segment. While this representation eases the analysis of caller/callee relationships, it does not convey any information on dynamic metrics collected within the different calling contexts. In the second visualization, the angle covered by each ring segment is proportional to the contribution of the corresponding calling context to a cho-
Calling context profiling is an important technique for analyzing the performance of object-oriented software with complex interprocedural control flow. A common data structure is the Calling Context Tree (CCT), which stores dynamic metrics, such as CPU time, separately for each calling context. As CCTs may comprise millions of nodes, there is need for a condensed visualization that eases the location of performance bottlenecks. In this paper, we discuss Calling Context Ring Charts (CCRCs), a compact visualization for CCTs, where callee methods are represented in ring segments surrounding the caller’s ring segment. In order to reveal hot methods, their callers, and callees, the ring segments can be sized according to a chosen dynamic metric. We describe a case study where CCRCs help detect and fix performance problems in an application. An evaluation confirms that our implementation efficiently handles large CCTs with millions of nodes.
Categories and Subject Descriptors C.4 [Computer Systems Organization]: Performance of Systems—Measurement Techniques; I.3.8 [Computing Methodologies]: Computer Graphics—Applications
General Terms Measurement, Performance
Keywords Performance analysis, visualization, calling context profiles, Calling Context Tree (CCT), dynamic metrics
1.
INTRODUCTION
Calling context profiling is a common technique to explore the dynamic behavior of programs and to find the reasons for performance problems. Calling context profiling yields dynamic metrics
Permission to make digital or hard copies of all or part of this work for personal or classroom use is granted without fee provided that copies are not made or distributed for profit or commercial advantage and that copies bear this notice and the full citation on the first page. To copy otherwise, to republish, to post on servers or to redistribute to lists, requires prior specific permission and/or a fee. WOSP/SIPEW’10, January 28–30, 2010, San Jose, California, USA. Copyright 2009 ACM 978-1-60558-563-5/10/01 ...$10.00.
63
void main (String[] args) { for (int j=0; j GET: input: key k • calculate T unique participant share keys pk j by hashing k with the participant’s id • join T shares from participants using the pk j keys into v • return v Figure 5: Algorithms used to split the secret into T shares and to reconstruct the secret
Total number of executed bytecodes
29,568,435,996
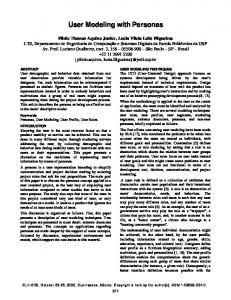
Figure 6: CCRC for the initial implementation of SSS secondary contribution, the case study also demonstrate that profiling using a platform-independent metric (i.e., the number of executed bytecodes) – instead of the common CPU time metric – is a useful technique for detecting hotspots and for optimizing applications. The resulting optimized application not only executes less bytecodes, but it also performs significantly better in terms of execution time. Shamir’s Secret Sharing (SSS) [6] is a cryptography algorithm, where a secret is divided into parts. Each participant receives its own unique part, where some of the parts or all of them are needed in order to reconstruct the secret. SSS is based on the idea that a polynomial’s coefficient and points generated by the polynomial are interchangeable. A polynomial function f is constructed (see equation (3)), such that the constant term S is the secret to share, and T is the minimum number of shares required to reassemble the secret. Ki are randomly generated numbers. The shares given to the participants are tuples < x, f (x) >, that is, points in the polynomial curve.
CASE STUDY
In this section we present a study where CCRCs have been successfully applied to locate performance problem in an application, which was optimized afterwards. In our case study, the calling context profiles are collected with the profiler described in [2, 4], which collects the number of executed bytecodes in each calling context (in addition to other dynamic metrics); this metric is largely platform-independent. This profiler has the advantage to profile overall application execution, including the execution of methods in the Java class library. For CCRC visualization, we use our Java-based Swing implementation. For the CCRCs in this case study, we use our second visualization, where the ring segment length is proportional to the aggregated bytecode metric (see Section 3.2). The CCRCs show the main(String[]) method as root in the center, that is, we use subtree selection [3] in order to concentrate on application execution, disregarding the execution of system threads, which is also conveyed in the profiles generated by our profiler. For all shown CCRCs, we limit the depth to 10 levels [3]. The primary contribution of this case study is to show that CCRCs help quickly locate hotspots in calling context profiles. As
T −1
f (x) = S +
∑ Ki xi
(3)
i=1
In our case study, we analyze an SSS implementation developed by Ricardo Padilha at the University of Lugano, which handles S of arbitrary size (whereas most available implementations limit S
66
Figure 7: SSS using java.security.SecureRandom (top) versus SSS using java.util.Random (bottom) The highlighted segments in Figure 7 (top and bottom) correspond to BigInteger.randomBits(), which is the common code executed when using SecureRandom respectively Random. Thanks to this optimization, the calculation of the random coefficients was reduced from 5.96% to 0.43% of the overall executed bytecodes. Second, the developer noticed that a high percentage of executed bytecodes were used to calculate the hash function for the obfuscation feature (see Figure 6). He decided to reengineer SSS in order to make this feature optional, since it was not required in common use cases. Figure 8 shows the CCRC for the final SSS version. Compared to the original implementation (see Figure 6), the total number of executed bytecodes has been reduced from 29,568,435,996 to 15,129,000,509. In order to confirm that the optimizations based on profiles with bytecode metrics also result in a speedup, we measured the execution times of the three different versions (initial version, version without secure random, and final version with neither secure random nor hash), with JDK 1.6_11 running on an Intel Core 2 Duo 2.33Ghz computer with 2GB RAM (Linux Fedora 10). The original implementation took 9150ms. The implementation without secure random took 7579ms (speedup of 20.7%). Finally, the implementation with neither secure random nor hash took 5557ms (speedup of 64.7%).
to 128 bit). We let the developer analyze his implementation with CCRCs, in order to validate the soundness of his design choices and to optimize his code. To generate the Ki random values, the original implementation uses the java.security.SecureRandom class. It associates a specific key value k to each secret S. Each share distributed to the participants is also associated with a key pk j , calculated with the SHA-1 hashing algorithm, by hashing k with the participant’s id. This feature aims at obfuscating the relation between the key and the value, which is useful, for instance, when storing the shares in an insecure repository. The algorithms to “put” respectively “get” the secret are outlined in Figure 5. Figure 6 shows a CCRC corresponding to one hundred thousand put and get operations. It illustrates the bytecode distribution of the different computations. We observe a symmetry between the calculations of the hash value and the join to put, respectively to get the shares. Thanks to our visualization, this symmetry becomes immediately apparent. The reader may wonder why a join operation is also needed for the put operation. This is due to the API used to store the shares. When replacing a stored value, the old value must be returned, forcing the join to be calculated also upon the put operation. First, the developer observed that the execution of the split operation was dominated by the use of java.security.SecureRandom. As an optimization, the developer decided to use the non-secure class java.util.Random instead. Figure 7 shows the CCRCs before and after the change.
6. EVALUATION In order to validate our CCRC implementation with large profiles, we generated and visualized the CCTs for the standard Da-
67
7. CONCLUSION
Total number of executed bytecodes
Calling context profiling is an important technique for exploring the dynamic behavior of programs. However, the resulting profiles, usually represented as CCTs, can be huge, comprising up to millions of calling contexts and typically reaching tree depths of 50–400 layers. Such large profiles can hardly be analyzed in a textual representation, and prevailing visualizations, such as expandable trees used in several profiling tools, are too verbose and do not make good use of space. In order to ease handling large calling context profiles, we presented Calling Context Ring Charts (CCRCs). A CCRC visualizes a CCT in a compact way, correctly representing all caller/callee relationships. Each calling context is displayed as a ring segment, surrounded by the ring segments representing the callees. Ring segments can be sized according to a chosen dynamic metric in order to ease the location of hotspots. We presented a case study where CCRCs were successfully applied to locate and fix performance problems in an application. An evaluation confirms that our CCRC implementation easily handles very large calling context profiles.
15,129,000,509
Figure 8: CCRC of the final implementation of SSS (without hashing and without secure random) DaCapo Bench.
Method Calls
antlr bloat chart eclipse fop hsqldb jython luindex lusearch pmd xalan
165,465,913 1,055,927,864 404,140,995 941,528,217 43,143,714 214,764,027 945,580,102 443,252,127 502,521,414 462,558,862 636,834,930
Different Methods 2,498 3,033 4,554 11,555 4,013 2,507 4,574 1,969 1,768 3,663 3,679
CCT Nodes 627,577 645,316 92,272 2,166,169 149,492 66,391 1,941,246 58,834 33,189 800,071 211,213
Max. Depth
Time [ms]
164 128 65 131 76 62 223 52 46 416 79
41 42 81 58 111 61 46 51 63 44 42
Acknowledgements: The work presented in this paper has been supported by the Swiss National Science Foundation. We thank Ricardo Padilha and Fernando Pedone for using our platformindependent calling context profiler and CCRC visualization tool, in order to optimize their Java implementation of Shamir’s Secret Sharing algorithm, and for providing us the results of their analysis and optimizations.
8. REFERENCES [1] G. Ammons, T. Ball, and J. R. Larus. Exploiting hardware performance counters with flow and context sensitive profiling. In PLDI ’97: Proceedings of the ACM SIGPLAN 1997 conference on Programming language design and implementation, pages 85–96. ACM Press, 1997. [2] W. Binder, J. Hulaas, P. Moret, and A. Villazón. Platform-independent profiling in a virtual execution environment. Software: Practice and Experience, 39(1):47–79, 2009. http://dx.doi.org/10.1002/spe.890. [3] P. Moret, W. Binder, D. Ansaloni, and A. Villazón. Visualizing Calling Context Profiles with Ring Charts. In VISSOFT 2009: 5th IEEE International Workshop on Visualizing Software for Understanding and Analysis, pages 33–36, Edmonton, Alberta, Canada, Sep. 2009. IEEE Computer Society. [4] P. Moret, W. Binder, and A. Villazón. CCCP: Complete calling context profiling in virtual execution environments. In PEPM ’09: Proceedings of the 2009 ACM SIGPLAN Workshop on Partial Evaluation and Program Manipulation, pages 151–160, Savannah, GA, USA, 2009. ACM. [5] D. Röthlisberger, M. Härry, A. Villazón, D. Ansaloni, W. Binder, O. Nierstrasz, and P. Moret. Augmenting Static Source Views in IDEs with Dynamic Metrics. In ICSM ’09: Proceedings of the 2009 IEEE International Conference on Software Maintenance, pages 253–262, Edmonton, Alberta, Canada, 2009. IEEE Computer Society. [6] A. Shamir. How to share a secret. Commun. ACM, 22(11):612–613, 1979. [7] X. Zhuang, M. J. Serrano, H. W. Cain, and J.-D. Choi. Accurate, efficient, and adaptive calling context profiling. In PLDI ’06: Proceedings of the 2006 ACM SIGPLAN conference on Programming language design and implementation, pages 263–271, New York, NY, USA, 2006. ACM.
Table 1: CCT statistics and CCRC rendering time Capo benchmark suite.We computed the rendering time for the full CCTs using our Java Swing implementation of CCRC. The measurements correspond to the rendering of the CCTs generated by the execution of one run of the benchmarks with the default problem size. We use the same measurement environment as in the case study. The CCTs were generated beforehand using the same calling context profiler used in our case study [2, 4]. Table 1 presents the CCRC rendering time for the benchmark CCTs, as well as some statistics computed from the CCTs. Column “Method Calls” shows the total number of method invocations (in all CCT nodes), which can be very high (over 1 billion for the ‘bloat’ benchmark). Column “Different Methods” gives the number of different methods that were invoked at least once. The number of CCT nodes (column “CCT Nodes”) and the maximum depth (column “Max Depth”) give an idea of the size of the CCTs to be visualized. For ‘eclipse’, the CCT consists of more than 2 million nodes, and for ‘pmd’ the maximum tree depth exceeds 400 layers. Table 1 shows the time for rendering the CCRCs representing the CCTs (using our second visualization where the length of ring segments is proportional to the aggregated bytecode metric), which is between 41ms and 111ms. Interestingly, the rendering time is not directly proportional to the number of nodes in the CCT because of various optimizations, such as rendering very small ring segments as single lines. Therefore, rendering is perceived almost as instantaneous by the user, even for very large CCTs.
68