ERAD 2008 - THE FIFTH EUROPEAN CONFERENCE ON RADAR IN METEOROLOGY AND HYDROLOGY
Exploring model-based polarimetric retrieval of vertical profiles of precipitation A. Ryzhkov1, S. Giangrande 1, A. Khain2, M. Pinsky2, and A. Pokrovsky2 (1) CIMMS / University of Oklahoma, USA , (2 )Hebrew University of Jerusalem, Israel 1. Introduction At longer distances, weather radar samples hydrometeors well above the ground and certain assumptions are required to project the results of measurements aloft to the surface. This concerns both rainfall estimation and hydrometeor classification. Classical techniques for the retrieval of vertical profiles of reflectivity (VPR) capitalize on statistical links between radar reflectivity Z observed aloft and the one at the surface or on the measured vertical profiles of Z at close ranges assuming horizontal homogeneity of precipitation. In this study, we explore how additional radar variables such as differential reflectivity ZDR, specific differential phase KDP, and cross-correlation coefficient ρhv measured by polarimetric radar and results of explicit microphysical modeling may help to improve the retrieval of vertical profiles of precipitation. 2. Stratiform precipitation In stratiform precipitation, vertical profiles of Z are commonly affected by the bright band. Modeling of the melting layer / bright band was a subject of several studies in the past (e.g., Russchenberg and Ligthart 1996, Fabry and Szyrmer 1999, Zawadzki et al. 2005). In most of them, polarimetric radar variables were not simulated. Russchenberg and Ligthart (1996) modeled vertical profiles of ZDR and linear depolarization ratio LDR for a monodisperse size distribution. We utilize a more sophisticated model which takes into account size distribution of snowflakes and assume that snow density varies across the size spectrum and depends on the degree of riming as follows: , (1) ρ( D) = f rimρ u ( D) where ρu is density of unrimed snow as specified by Brandes et al. (2007) (2) ρ u ( D) = 0.178D −0.922 and frim is a riming factor introduced by Zawadzki et al. 2005. Usually frim varies between 1 (unrimed snow) and 5 (heavily rimed snow). In this study, it is assumed that frim is not a function of particle size. Size distribution of snowflakes at the top of the melting layer (i.e., at the freezing level) is selected in such a way that a resulting distribution of raindrops beneath the melting layer is the Marshall – Palmer which is parametrized by one parameter, rain rate. A melting snowflake represents a mixture of air, solid ice, and water. As opposed to the previous studies, we assume that the density of dry snow (i.e., combination of air and solid ice) changes in the process of melting according to Eq. (2). Terminal velocities of melting snowflakes depend on
Corresponding address: A. Ryzhkov, CIMMS / OU,
[email protected]
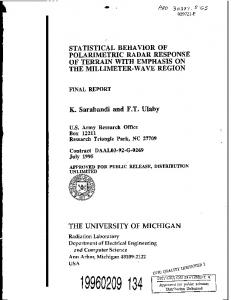
Fig.1. Model vertical profiles of Z, ZDR, KDP, and ρhv at S band within the melting layer for unrimed snow (frim =1.0, blue curves) and rimed snow (frim = 5.0, red curves). Freezing level is at 0.0 km height, temperature lapse rate is 6.5°/km, RH = 100%, and rain rate is 5 mm/h. initial snow density and mass fraction of melted water fm which is determined from a heat balance equation. Radar polarimetric variables are very sensitive to dielectric constant ε of melting snowflakes and the choice of electromagnetic model to compute ε for a mixture of air, ice,
ERAD 2008 - THE FIFTH EUROPEAN CONFERENCE ON RADAR IN METEOROLOGY AND HYDROLOGY and water. In our simulations, we utilize the approach by Meneghini and Liao (1996) and use a gradual transition from model 2 (as defined by Fabry and Szyrmer 1999) for higher water mass fraction fm to model 3 for lower values of fm. Polarimetric variables within the melting layer also depend on the shapes and orientations of melting particles which can not be obtained from the thermodynamic model of melting. We model snowflakes as oblate spheroids with the aspect ratio of 0.8 for dry snowflakes at the top of the melting layer. It is assumed that the aspect ratio of melting snowflake changes linearly with fm until it reaches the oblateness of raindrop with the same mass. Similar assumptions are made with respect to the width of the canting angle distribution σ. The parameter σ changes gradually from 50° in dry snow to 10° in rain. Simulated profiles of Z, ZDR, KDP, and ρhv at S band through the melting layer for unrimed (frim = 1.0) and heavily rimed snow (frim = 5.0) are displayed in Fig. 1 provided that rain rate below the melting layer is 5 mm/h. It is evident that the profiles of all radar variables are very sensitive to the degree of riming. Larger Z and KDP enhancement, stronger ZDR maximum, and deeper ρhv minimum are observed for low density snow. The increase of the temperature lapse rate leads to the decrease in the depth of the melting layer, whereas the decrease in relative humidity RH results in the subsidence of the melting layer. The corresponding profiles of rain rate estimates from the standard R(Z), R(Z,ZDR), and R(KDP) relations for the cases of rimed and unrimed snow are illustrated in Fig.2 and 3. The following radar rainfall relations are utilized: R ( Z) = 0.017 Z0.714 . (3) R ( Z, Z ) = 1.42 10 −2 Z0.770 Z1.67 DR
account. Additionally, aggregation explains routinely observed increase in the size of the melting snowflakes in the middle of the melting layer, whereas a model without aggregation implies monotonic decrease of the maximal particle size as melting progresses.
Fig.2. Vertical profiles of rain rates estimated from the R(Z), R(Z,ZDR), and R(KDP) relations in the case of unrimed snow. Actual rain rate is 5 mm/h (dashed line).Freezing level is at 0.0 km height. Temperature lapse rate is 6.5°/km, RH = 100%.
dr
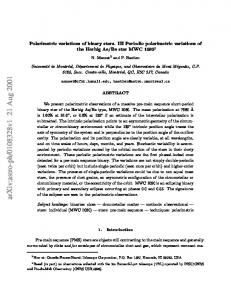
.822 R ( K DP ) = 44.0 K 0DP As expected, all three relations overestimate precipitation rate (which is constant in height due to conservation of mass flux). Nevertheless, the R(KDP) relation shows less overestimation, especially for lower density snow. This agrees with experimental findings of Giangrande and Ryzhkov (2003) who reported that the R(KDP) algorithm works best of all in the presence of bright band contamination. Simulations illustrated in Figs. 1 – 3 were performed under assumptions that one snowflake produces one raindrop and there is no interactions between melting particles. Such a model is capable to reproduce peaks in Z and ZDR as well as the drop in ρhv in right places within the melting layer (e.g., the ZDR peak below the Z peak). Vertical profiles of Z also look realistic and agree with the ones reported in the literature. This model, however, does not reproduce very low values of ρhv and high ZDR often observed at the bottom of the melting layer. The scatterplot of maximal ZDR versus minimal ρhv in the melting layer which summarizes S-band polarimetric measurements for several stratiform rain events in Oklahoma (Fig. 4, crosses) reveals strong correlation between ZDR(max) and ρhv(min). Occasionally, ρhv(min) may drop as low as 0.82 with the corresponding value of ZDR(max) approaching 2.5 dB. Simulated values of ρhv in Fig. 1d are well above 0.99. In order to explain extreme values of ρhv and ZDR, aggregation of melting snowflakes should be taken into
Fig.3. Same as Fig. 2 but for rimed snow. In a more sophisticated version of our model, we account for aggregation by examining probability of collisions between large wet snowflakes and smaller size raindrops originated from smaller snowflakes (Giangrande 2007). It is shown that as a result of such collisions, maximal size of partially melted snowflakes and their water content dramatically increase. Once the ratio D|ε|1/2/λ (where λ is radar wavelength) approaches unity due to the increase of both D and ε, then ZDR and ρhv quickly reach their extreme values due to resonance scattering. The asterisks in Fig. 4 indicate results of modeling for different intensities of aggregation. Substantially higher ZDR and, correspondingly, much lower ρhv are simulated compared to the model without aggregation.
ERAD 2008 - THE FIFTH EUROPEAN CONFERENCE ON RADAR IN METEOROLOGY AND HYDROLOGY
Fig.4. Maximal ZDR versus minimal ρhv within the melting layer from S-band measurements (crosses). Asterisks indicate results of modeling for different intensities of aggregation. 3. Convective precipitation Melting of graupel and hail affects vertical profiles of polarimetric radar variables in convective storms. The impact of graupel / hail melting on vertical distribution of ZDR and LDR was first studied by Bringi et al. (1986) and Vivekanandan et al. (1990) based on the thermodynamic model of Rasmussen and Heymsfield (1987). In this study, we use a similar thermodynamic model with several modifications regarding drop shedding and accounting for vertical air motion (see details in a companion article of Kumjian and Ryzhkov 2008). Similarly to the modeling of stratiform precipitation, we assume that the aspect ratio of ice particle aloft is 0.8 and the width of the corresponding canting angle distribution is 50°. Both parameters change proportionally to the mass water fraction fm as ice particles melt. The results of simulations crucially depend on initial particle size distribution aloft. We assume it to be biexponential in a general case N ( D ) = N g exp( − Λ g D ) + N h exp( − Λ h D) , (4) where the first term describes size distribution of graupel and the second one is for size distribution of hail. Here we discuss simulation results for two sets of initial conditions: (a) graupel only (Nh = 0, Ng = 8000 m-3mm-1, Λg = 1.7 mm1 ) and (b) graupel and hail coexist (Λh = 0.3 mm-1, Nh = 1.35 m-3mm-1, Ng = 8000 m-3mm-1, Λg = 1.7 mm-1). The maximal size of hailstones aloft is set at 4 cm. Another important factor dramatically affecting vertical profiles of all radar variables is vertical air speed w. We present modeling results for w = 0 m/s and w = 9 m/s (modest updraft). For the purpose of this study, we assume that w does not depend on height. A more realistic modeling of nonuniform vertical profile of w is described in (Kumjian and Ryzhkov 2008). Model vertical profiles of Z, ZDR, KDP, and ρhv at S and C bands are shown in Figs. 5 and 6. As expected, in the “graupel only” case most frozen particles melt within first 2
km below the freezing level in the absence of updraft and within first kilometer in the presence of the 9 m/s updraft. Size sorting due to updraft causes significant decrease in Z, KDP, and ρhv (within the melting layer) and considerable increase of ZDR. Polarimetric signatures are more exaggerated at C band due to stronger effects of resonance scattering at shorter radar wavelength. Adding hail to graupel causes tremendous increase in Z, modest increase in KDP, and substantial reduction of ZDR and ρhv. However, it can be shown that melting hail of smaller size (with larger Λh and lower maximal size) may produce high ZDR which is comparable to the one in pure rain at both radar wavelengths. In general, differential reflectivity at C band remains quite high despite the presence of large melting hail in the mixture with rain. This theoretical conclusion is supported by recent C-band observations of melting hail reported by Ryzhkov et al. (2007). Vertical profiles of rain rate estimates from the R(Z), R(Z,ZDR), and R(KDP) relations are illustrated in Fig.7. Actual rain rates corresponding to liquid part of precipitation are depicted with dashed lines. It is not surprising that the R(KDP) radar estimates match actual vertical profiles of rain best of all. The correspondence between the two is reasonably good at all heights below the freezing level in the absence of strong vertical air motion. If hail is present, then both R(Z) and R(Z,ZDR) estimates are way off the scale. 4. Conclusions Model simulations confirm that polarimetric variables in combination with information about vertical profiles of temperature and humidity which can be obtained either from soundings or from numerical forecast models have a potential to improve existing methodologies for the retrieval of vertical profiles of precipitation. Indeed, as Fig. 1 shows, depending on snow density, rain with the same rate at the surface (5 mm/h) might be associated with different values of Z in snow aloft. The type of the ZDR and ρhv profiles within the melting layer might be utilized to distinguish between the situations with unrimed and rimed snow if only the measurements within the melting layer and above are available at longer distances from the radar. Similarly, using the measurements of all polarimetric radar variables at the top of the melting layer in convective rain and examining the magnitudes and slopes of the vertical profiles of ZDR, KDP, and ρhv aloft, one can come up with reasonable conclusions about the type and amount of precipitation at the surface as well as maximal hail size with the guidance provided by explicit microphysical modeling. Finally, such a modeling will help in optimization of the membership functions and weights in polarimetric schemes for radar echo classification which should precede quantitative estimation of precipitation amounts.
ERAD 2008 - THE FIFTH EUROPEAN CONFERENCE ON RADAR IN METEOROLOGY AND HYDROLOGY
Fig.5. Model vertical profiles of Z, ZDR, KDP, and ρhv in convective storm at S band for graupel aloft only (blue curves) and graupel and hail (red curves). Solid lines correspond to the absence of vertical air motion, whereas dashed lines are for an updraft w = 9 m/s. Freezing level is at 4 km height, temperature lapse rate is 6.5°/km, and RH = 100%.
Fig.6. Same as in Fig. 5, but for C band.
ERAD 2008 - THE FIFTH EUROPEAN CONFERENCE ON RADAR IN METEOROLOGY AND HYDROLOGY Fabry, F., W. Szyrmer, 1999: Modeling of the melting layer. Part II: Electromagnetic. J. Atmos. Sci., 56, 3593 – 3600. Giangrande, S., and A. Ryzhkov, 2003: The quality of rainfall estimation with the polarimetric WSR-88D radar as a function of range. Preprints, 31st International Conference on Radar Meteorology, Seattle, 357 - 360. Giangrande, S., 2007: Investigation of polarimetric measurements of rainfall at close and distant ranges. PhD Dissertation, University of Oklahoma, 236 p. Kumjian, M., and A. Ryzhkov, 2008: Interpretation of signatures in supercell storms using explicit microphysical modeling. The 5th European Conf. Radar Meteorol. Hydrology. Meneghini, R., and L. Liao, 1996: Comparisons of cross sections for melting hydrometeors as derived from dielectric mixing formulas and a numerical method. J. Appl. Meteorol., 35, 1638 – 1669. Rasmussen, R., and A. Heymsfield, 1987: Melting and shedding of graupel and hail. Part I: Model physics. J. Atmos. Sci., 44, 2754 – 2763. Russchenberg, H., and L. Ligthart, 1996: Backscattering by and propagation through the melting layer of precipitation: A new polarimetric model. IEEE Trans. Geosci. Remote Sens., 34, 3 – 14. Ryzhkov, A., 2001: Interpretation of polarimetric radar covariance matrix for meteorological scatterers. Theoretical analysis. J. Atmos. Oceanic Technol., 18, 315 - 328. Ryzhkov, A., D. Zrnic, P. Zhang, J. Krause, H. Park, D. Hudak, J. Young, J.L. Alford, M. Knight, and J.W. Conway, 2007: Comparison of polarimetric algorithms for hydrometeor classification at S and C bands. Analysis of the performance in different climate regions. 33 Conf. on Radar Meteorology. CD-ROM 10.3. Fig. 7. Vertical profiles of rain rates at S band estimated from the R(Z) (blue curves), R(Z,ZDR) (green curves), and R(KDP) (red curves) relations in the case of (a) – (b) graupel aloft only and (c) – (d) graupel and hail in the absence of updraft ((a) and (c)) and in the presence of updraft with w = 9 m/s ((b) and (d)) . Vertical profiles of actual rain rate are depicted with dashed lines.
References Brandes, E., K. Ikeda, G. Zhang, M. Schoenhuber, and R. Rasmussen, 2007: A statistical and physical description of hydrometeor distributions in Colorado snowstorms using a video disdrometer. J. Appl. Meteor. Clim., 46, 634 – 650. Bringi V., R. Rasmussen, and J. Vivekanandan, 1986: Multiparameter radar measurements in Colorado convective storms. Part I: Graupel melting studies. J. Atmos. Sci., 43, 2545 – 2563.
Vivekanandan, J., Bringi, V., and R. Raghavan, 1990: Multiparameter radar modeling and observations of melting ice. J. Atmos. Sci., 47, 549 – 563. Zawadzki, I., W. Szyrmer, C. Bell, and F. Fabry, 2005: Modeling of the melting layer. Part III: The density effect. J. Atmos. Sci., 62, 3705 – 3723.