hydrology Article
Exploring Perceptions and Behaviors about Drinking Water in Australia and New Zealand: Is It Risky to Drink Water, When and Why? Andrea Crampton 1, *,† and Angela T. Ragusa 2,† 1 2
* †
School of Biomedical Sciences, Charles Sturt University, Wagga Wagga 2650, Australia School of Humanities and Social Sciences, Charles Sturt University, Wagga Wagga 2650, Australia;
[email protected] Correspondence:
[email protected]; Tel./Fax: +61-2-6933-4032 These authors contributed equally to this work.
Academic Editors: Tamim Younos, Tammy E. Parece and Alaina J. Armel Received: 1 October 2015; Accepted: 16 February 2016; Published: 19 February 2016
Abstract: Consumers in most developed countries, including Australia and New Zealand, presume their drinking water is safe. How social perceptions about drinking water are formed, however, remains inadequately explored in the research literature. This research contributes exploratory insights by examining factors that affect consumer perceptions and behaviors. Individual perceptions of drinking water quality and actions undertaken to mitigate perceived risks were collected during 183 face-to-face interviews conducted at six research sites. Qualitative thematic analysis revealed the majority did not consider drinking water a “risky” activity, trusted water management authorities to manage all safety issues and believed self-evaluation of drinking water’s taste and appearance were sufficient measures to ensure safe consumption. Quantitatively, significant relationships emerged between water quality perceptions and sex, employment status, drinking water treatment and trust in government to provide safe water. Expert advice was rarely sought, even by those who believed drinking tap water posed some health risks. Generational differences emerged in media usage for drinking water advice. Finally, precautionary measures taken at home and abroad often failed to meet national drinking water guidelines. Three major conclusions are drawn: a. broad lack of awareness exists about the most suitable and safe water treatment activities, as well as risks posed; b. health literacy and interest may be improved through greater consumer involvement in watershed management; and c. development of health campaigns that clearly communicate drinking water safety messages in a timely, relevant and easily understandable fashion may help mitigate actual risks and dispel myths. Keywords: trust; media; communication; decisions; water treatment; chemical; watershed
1. Introduction Access to fresh water sources has shaped the development of communities, civilizations and nations. Some claim the development of water treatment technology has had a greater impact on global human health than that of antibiotics and vaccines [1]. In 2010, the United Nations declared access to clean, safe water a human right [2], although the effects of climate change, land degradation and pollution continue to deny an increasing portion of humanity this basic right. Currently, water scarcity affects approximately 700 million people worldwide. In less than two decades, this number is predicted to grow substantially, with nearly 50% of the global population negatively affected [2]. Regions currently struggling to supply citizens with sufficiently treated water are those most likely to
Hydrology 2016, 3, 8; doi:10.3390/hydrology3010008
www.mdpi.com/journal/hydrology
Hydrology 2016, 3, 8
2 of 14
be heavily affected by increasing water scarcity. In such regions, population growth, combined with insufficient and/or unsuitable water quality, will augment the impact water-borne diseases pose to vulnerable populations [2]. Although Australia is a developed nation, as the world’s driest continent, it is highly vulnerable to water scarcity. Its intermittent droughts and floods severely affect the well-being of its inhabitants and economy [3]. Australia’s neighbor, New Zealand, has similar political structures and drinking water guidelines, yet consistently higher rainfall levels. Examining consumer perceptions of drinking water in two similar countries with vastly different climates provides scope to explore if location affects drinking water quality perceptions. Additionally, as highly mobile populations, Australians and New Zealanders permit investigation of consumer knowledge about health campaigns’ international travel recommendations for safe drinking water consumption. When individuals travel to areas with inadequate water treatment facilities, health risks are often communicated by travel warnings. Common recommendations include only drinking commercially-sealed bottled water and avoiding ice. For instance, the Australian Department of Foreign Affairs and Trade [4], the Australian Government’s smart travelers’ website, advises: Water-borne, food-borne and other infectious diseases are prevalent around the world with major outbreaks occurring from time to time. If you are in doubt about the quality of the water in any country, we recommend you boil all drinking water or drink bottled water, and avoid ice cubes. You should also avoid raw and undercooked food. Seek medical advice if you have a fever or are suffering from diarrhoea. [4] What may be less obvious to some, however, are the risks associated with drinking water in one’s own country, particularly developed countries [5]. In part, this is due to water contamination sources around watersheds, such as factories or farms, and contaminants, such as raw sewage or industrial waste, which may be more visible in developing countries. In such instances, individuals can rely on sensory data, such as the sight of a dead cow or the smell of rancid water, to make water consumption decisions. In developed countries with water treatment processes that meet or exceed WHO [6] standards, individuals must access different types of knowledge to assess drinking water risks compared to those living in developing countries. For instance, one’s environment is likely to affect the visibility of watershed contamination. If contamination cannot be primarily observed, then consumers drinking municipally-supplied water may have to rely more heavily upon expert advice. Where water quality reports or catchment management authority advice is available, it may not be easy to obtain or understood by consumers [5]. Direct observation of risky events or situations enables individuals to better judge risk probability [7,8]. In lieu of direct observations or reliable second-hand information, drinking water consumers must rely upon personal judgment of water attributes to determine potential risks. Attributes may include how water looks, smells or tastes (organoleptic properties). Alternatively, consumers may simply “trust” that those providing potable water adequately assess and address all relevant risks. Reliance on trust typically assumes the entity controlling tap water has influence over the myriad of stakeholders involved [9,10] to suitably manage the watershed, or it has practices in place to mitigate what occurs between delivery of water from watershed to tap. To understand why individuals choose to rely on personal observations and/or beliefs or take a more “scientific” approach to risk management requires investigation of what information the public uses to make personal decisions. News media is a key agent in the creation and dissemination of ideas about current issues and is an institutionalized mechanism, along with the government, for broadcasting public health information [11]. With the exception of the acute drinking water contamination event, when several million Sydney residents were instructed to only drink boiled water due to possible microbial contamination, which has come to be known as the “Sydney water crisis” in 1998, drinking water quality has received little media attention in Australia [12]. Lack of public discourse has arguably contributed to consumers remaining generally unaware of much scientific knowledge about water quality.
Hydrology 2016, 3, 8
3 of 14
Public discourse, a vital element required for raising social consciousness and awareness to a functional level for promotion of basic citizen engagement [9], is arguably missing in Australia and New Zealand regarding water quality. Similarly, a lack of adequate information on water quality and/or supply management has been criticized by consumers in other developed nations with relatively safe water supplies, including Canada, the USA and Italy [13]. An understanding of consumer perception in developed countries is seen as a key component in ensuring ongoing consumer satisfaction and cooperation in times of need [13], aspects that may become increasingly vital as supplies of reliable water diminish across the globe and impacts are locally experienced. If lack of public discourse suggests an uninformed and/or complacent populace, unaware of potential current or future risks, then this is problematic because governmental bodies, including Australia and New Zealand, use a risk management framework to guide the supply of potable water to consumers according to the Australian Drinking Water Guidelines (ADWG) [14] and Drinking-water Standards New Zealand [15]. Applying a risk management framework is essential because, despite the high quality of drinking water generally provided at the tap, catchment environments and human interventions may still negatively affect water quality. Thus, even the best preventive measures are unlikely to offer absolute protection [5]. This study seeks to augment existing drinking water perception research and policy. Specifically, it aims to inform water management policy and practice by reporting research that examines factors affecting consumers’ beliefs, prioritizations and responses to perceived drinking water risks while taking socio-environmental contexts into account [13]. Water managers and health authorities may subsequently use this knowledge to better address risk perceptions that drive less desirable actions, such as reliance on bottled rather than safe tap water. By investigating individual risk assessments of drinking water, public health awareness may be better understood. Overall, this research seeks to enhance alignment of watershed risk analysis and prevention campaigns with consumer expectations, knowledge and behaviors. As growing environmental and population pressures challenge global drinking water availability and quality, healthy water management strategies are crucial for developing and developed countries. By demonstrating how consumer perceptions can influence the information sought out and used, Australian and New Zealand experiences may assist public health and water authorities in the global community to refine and/or develop effective water management strategies. 2. Materials and Methods The conceptual basis for this study is grounded in risk theory. Drinking water’s access, management and delivery may involve at least six of Bennett et al.’s [16] 11 fright factors: (i) involuntary risk exposure since water is necessary for life (ii) inequitable distribution of risk due to vast differences in testing protocols in rural and urban areas (iii) contamination resulting from human actions including chemical spills, agricultural runoff, water testing and distribution failure (iv) hidden or irreversible damage from long term exposure to low level chemicals such as disinfectant by-products, chlorine, and algal toxins (v) greater risk to certain members of the population especially small children, the elderly and the immunocompromised, the latter for whom death is a possibility (factor 8) and, finally, (vi) presence and/or possible effect risks may be downplayed or refuted by organizations that supply and/or test drinking water due to the lack of mandatory public reporting laws or protocols to make relevant information accessible to the general public [5]. Demographic factors and individual beliefs are juxtaposed alongside drinking water consumers’ actions in light of Bennett et al.’s [16] “fright factors” to permit distinguishing risks of greater or lesser threat. A mixed-method [17] research design was chosen to permit qualitative and quantitative investigation. Non-probability methods, specifically purposive sampling, were used to select research
Hydrology 2016, 3, 8
4 of 14
sites and participants. Purposive sampling is the selection of research participants and/or locations based upon a variety of key characteristics that will facilitate answering the research question(s) [18]. Although some applications of purposive sampling seek to identify “key informants” who, by virtue of their knowledge and/or experiences, are uniquely informative [19], here purposive sampling was used to select research sites because of its strength as a non-probability method [20]. In total, six research locations were selected. These included four Australian capital cities, Brisbane, Hobart, Melbourne and Sydney, one regional Australian center, Wagga Wagga (Wagga), and the city of Auckland in New Zealand. All were purposively selected due to population size and provision of municipal water to their urban residents. This framework permitted locations to be sampled according to research goals and questions rather than by chance, as is typical in convenience sampling [18]. In this article, discussion of “urban” findings only refers to participants from Auckland, Brisbane, Hobart, Melbourne and Sydney and excludes Wagga because it is a regional location. Collectively, 50% [21] of the Australian population resides in the five locations chosen and 33.4% [22] of New Zealand’s population lives in Auckland. Auckland is comparable with the Australian cities chosen as related to access to healthcare, transport, centralized water supplies and stable governance and has a large migrant population of both domestic and international origin. Hobart is the capital city of Australia’s most southern state, Tasmania (TAS). Melbourne is north of Hobart on the southern tip of Australia’s east coast in the state of Victoria (VIC). Brisbane is the capital city of Queensland (QLD). Sydney is in the state of New South Wales (NSW). Wagga is also in NSW, and despite being the largest urban center within the area known as “The Riverina”, it covers a vast geographic range that includes rural and remote residents on large, agricultural properties as well as those living “in town” which are largely “suburban”. A more detailed description of the water sources and relevant legislative environments governing drinking water management in these locations can be found in Crampton [5]. Despite interviews being conducted in several cities along Australia’s eastern coastline, the findings are not generalizable to the broader populations in each interview location or to Australia or New Zealand generally. In qualitative and quantitative social science research methods, purposive sampling frames do not seek to give every member of the community an equal chance to participate [23]. This is because the sampling framework aims to purposively collect a sample that identifies and includes participants with relevant characteristics, which is achievable with a robust sampling framework that surpasses convenience sampling by permitting inclusion of participants from a range of socio-cultural backgrounds [18]. The conductance of social research exploring perceptions of drinking water quality demanded a research design with the capacity to prioritize identification and collection of perceptions from both dominant and non-dominant social categories to reflect the diversity exhibited within the research locations. Hence, quota sampling [17], facilitated by a field notebook, was used to obtain equitable numbers of participants from each city and create a demographically diverse sample of residents from varied ethnicities, ages, genders and socioeconomic backgrounds [21], although we could not pre-determine who would appear in public spaces during our interview periods. Therefore, findings are best viewed as illustrative of individual views and perceptions at a given time in a given space. Nevertheless, the common themes noted across locations may be considered indicative of a broader level of consensus and understanding. All face-to-face interviews were conducted by the authors following the provision of a research project description and receipt of each participant’s informed consent. A piloted script was followed to ensure interviewer consistency. All interviews were conducted in public spaces, such as malls, airports, libraries and public parks, and lasted a maximum of 20 minutes. The interviews were recorded and later transcribed by research assistants. The interview schedule and sampling procedures were approved by the School of Biomedical Sciences’ Ethics in Human Research. The interview design included open- and close-ended questions to permit analysis of data, both quantitatively and qualitatively. Interviews included demographic, general water management and personal perception questions. To identify participants’ perceptions of water quality, risk, trust and the potential for
Hydrology 2016, 3, 8
5 of 14
terrorism or agriculture to affect drinking water, probing was utilized. Probing enabled participants to elaborate upon closed-ended questions and discuss as suitable to individual experiences. For example, if a participant answered yes to the question Do you think drinking water is a risky activity? then the probe Why so? was used. Finally, given the vast array of sources from which individuals could choose to obtain health advice beyond professional advice from the medical establishment/scientific community, participants were asked where they typically obtained health-related information. Response options were television, radio, newspapers, magazines, internet, and a list of other people, which included medical/professional experts, friends/family, acquaintances, etc. Urban interviews took place over two to three days at each site between December 2007 and February 2008. The Wagga sample was collected during two separate two-to-three-day periods, first in January 2008 and second in February 2008, so the diversity of this regional sample, specifically both “in town” and outlying rural area perceptions, could be explored and compared with the city locations’ interview results. It is important to note the Wagga sample is presented as a single entity, with participants not differentiated by residency type (in-town or rural). All analyses were conducted using the entire sample and findings in the Results section are presented by location since conducting an urban/regional comparison is not a research aim of the present study. Quantitative data was analyzed using SPSS with Pearson’s correlations, chi square and T-tests performed to test for significant relationships. The non-random sampling frame, and hence non-normative distribution of results, precluded regression analysis. The variables quantitatively analyzed were age, employment status, sex, location, education, child care responsibilities, ethnicity, water treatment behavior, perceptions of water quality, perceptions of risk, trust in water providers, perceptions of water supplied to others and potential impact of agriculture. Qualitative thematic analysis was conducted for answers provided to the open-ended questions, with common themes identified and evaluated against the quantitative responses [23]. Themes are ideas emerging across participant responses that transcend single categorical responses and permit researchers to explain and interpret ideas more deeply than listing a range of answers that appear in response to a question [24]. To identify qualitative themes, all participant responses were read and independently coded by each author. Initial codes were compared and refined collaboratively by the researchers until inter-coder reliability was achieved whereby the authors agreed upon the salience and suitability of each code and all codes were closely reviewed to ensure they reflected the major themes identified [18]. Finally, a unique coding scheme was developed for the open-ended question Do you do anything to enhance the quality of your drinking water? Since participants often used multiple treatments, a revised coding frame based upon maximum risk reduction was developed. For example, if anti-microbial and anti-chemical treatments were utilized, then the response was categorized “anti-microbial”, while a combination of anti-chemical and organoleptic treatments was categorized “anti-chemical”, given organoleptic actions arguably do not reduce risk. This coding frame was developed in light of national guidelines noting microbial contamination risk is a higher priority than chemical contamination for Australian and New Zealand drinking water consumers [14,15]. For example, the National Health and Medicine Research Council of Australia lists microbial contamination as a higher priority than other sources in 2011 Australian Drinking Water Guidelines [14]. Thus, anti-microbial treatment activities were considered the highest level of risk reduction because microbial contamination is a more immediate and identifiable health risk than most causes of chemical contamination. 3. Results In total, 183 interviews were conducted in six locations: Auckland (N = 37), Brisbane (N = 26), Hobart (N = 27), Melbourne (N = 26), Sydney (N = 24), and Wagga (N = 43). Analysis of the demographic data for the total sample in Table 1 presents the age of participants by their birth cohort label, which is commonly used in social science research about Western cultural perceptions due to the variation in beliefs and values exhibited by socio-historical era. Most participants in the
Hydrology 2016, 3, 8
6 of 14
study belonged to “Generation X”, born between 1965 and 1980, were employed, and slightly were more likely to be female. Hydrology 2016, 3, 8
6 of 14
Table 1. Participant demographic profile (raw number and % of total sample). Table 1. Participant demographic profile (raw number and % of total sample). Gender Gender
Employment Employment Status Status
of Birth) Age Age (Year(Year of Birth)
Baby Not Y Generation X Baby Traditionalists Traditionalists NotGeneration Generation Y Generation X Boomers Male Employed Male Female Female Employed Boomers employed (1981–1994) (1965–1980) (1946–1964) (1925–1945) Employed (1981–1994) (1965–1980) (1925–1945) (1946–1964) 83 100 148 35 16 104 54 9 83 (45%) (55%) 100 (55%)(81%)148 (81%)(19%) 35 (19%) (9%) 16 (9%) (57%) 104 (57%) (30%)54 (30%) 9 (5%) (45%) (5%)
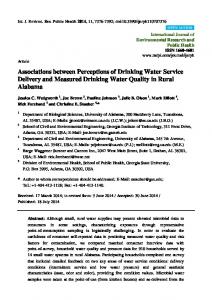
The The general general question question Have Have you you ever ever thought thought about about the the quality quality of of your your drinking drinking water? water? revealed revealed that that most participants (75%) had previously thought about the quality of their drinking water. To explore most participants (75%) had previously thought about the quality of their drinking water. To explore risk risk perceptions perceptions about about drinking drinking water, water, responses responses from from all all participants participants received received for for the the question question Have Have you ever thought of drinking water as a risky activity? were used to create two groups, a Not you ever thought of drinking water as a risky activity? were used to create two groups, a NotRisky Risky group group and and aa Risky Risky group. group. Responses Responses revealed revealed the the majority majority (65%) (65%) did did not not think think drinking drinking water water could could be be aa risky activity. Location was analyzed to see if it significantly impacted drinking water perceptions risky activity. Location was analyzed to see if it significantly impacted drinking water perceptions or or behaviors. AlthoughFigure Figure 1 illustrates risk perception varied by findings location, were findings were behaviors. Although 1 illustrates risk perception varied by location, statistically statistically −0.89,Np == 183). 0.231, N = 183). insignificantinsignificant (r = ´0.89, p(r==0.231,
Figure 1. 1. Percentage Percentage of of participants participants in in each each location location relevant relevant to to their their perception perception of risk. Figure
To qualitativelyexplore exploreindividuals’ individuals’ drinking water perceptions, a probing question was To qualitatively drinking water perceptions, a probing question was posed, posed, asking participants how they determined the quality of their drinking water. Thematic asking participants how they determined the quality of their drinking water. Thematic analysis analysis a generalized of appeared “trust” appeared for national water management authorities revealedrevealed a generalized sense ofsense “trust” for national water management authorities vested vested with the provision of safe public drinking water, as well as “natural” filtration mechanisms. with the provision of safe public drinking water, as well as “natural” filtration mechanisms. The The following three comments are illustrative of sentiments expressed in this theme: 1. As consumers following three comments are illustrative of sentiments expressed in this theme: 1. As consumers we we tend to put trust councils and hope that watertreatments treatmentsmeet meetallallthe thestandards standards(Hobart); (Hobart);2.2.Yes YesI tend to put ourour trust in in ourour councils and hope that water Itrust trustthem. them.Yes, Yes,because becausewater waterhas hasbeen beenpretty prettygood goodforformost mostofofthe thetime time(Wagga); (Wagga); I trust that water 3. 3.So,So, I trust that thethe water is is clean and what comes out of the tap is reasonably clean… Agriculture, well yeah, every farm uses fertilizers, clean and what comes out of the tap is reasonably clean . . . Agriculture, well yeah, every farm uses fertilizers, during during aa storm storm runoff runoff goes goes into into the the creeks creeks which which normally normally ifif they’re they’re connected connected to to dams, dams, goes goes into into dams, dams, but, but, again you trust that the filtration that the water goes through before it gets between the dam and the again you trust that the filtration that the water goes through before it gets between the dam and the tap, tap, you you trust authorities and/or and/or “natural” trust that that it’s it’s pretty pretty good good (Brisbane). (Brisbane). Trust Trust in in water water management management authorities “natural” filtration filtration processes occurred regardless of research location and was largely limited to trusting the safety processes occurred regardless of research location and was largely limited to trusting the safety of of drinking water supplied suppliedinin their own country. comments that broadly reflect many drinking water their own country. Two Two comments that broadly reflect the manythe similarly similarly offered came from a participant Sydney who described: No,assumed I simplyall assumed allAustralia water in offered came from a participant in Sydneyinwho described: No, I simply water in Australia to is myofmind is of a satisfactory standard I have especially travelled especially around of the capital to my mind a satisfactory standard and I haveand travelled around most of themost capital cities and cities and most major cities. I’ve never worried about water. Likewise, a participant from Melbourne most major cities. I’ve never worried about water. Likewise, a participant from Melbourne noted, I mean, it noted, mean, depends on where you go,wide obviously wide got no problem but if I travel dependsIon whereityou go, obviously Australia I’ve gotAustralia no problem but I’ve if I travel international I don’t drink. international I don’t drink. To examine perceptions specifically about individuals’ drinking water at home (see Table 2), responses to the open-ended question How do you tell if your drinking water at home is safe to drink? were qualitatively and quantitatively analyzed. Despite the question being open-ended, not multiple choice, all participants provided similar answers (indicators), namely personal experience gained by
Hydrology 2016, 3, 8
7 of 14
To examine perceptions specifically about individuals’ drinking water at home (see Table 2), responses to the open-ended question How do you tell if your drinking water at home is safe to drink? were Hydrology 2016, and 3, 8 quantitatively analyzed. Despite the question being open-ended, not multiple choice, 7 of 14 qualitatively all participants provided similar answers (indicators), namely personal experience gained by tasting (Table 3). There was no statistical difference between the Risky and Not Risky regarding and looking at water, as well as awareness of contamination issues reported by groups news media (Tablethe 3). most common indicators used. When traveling internationally, all participants noted that they first There was no statistical difference between the Risky and Not Risky groups regarding the most common relied on aused. general notion of “trust” that drinking water madenoted publicly was safe drink, indicators When traveling internationally, all participants that available they first relied on atogeneral but theof Risky group sought external sources of information, namely the media, assess the notion “trust” thatfurther drinking water made publicly available was safe to drink, but theto Risky group quality of water away from home before imbibing. In contrast, those in the Not Risky group simply further sought external sources of information, namely the media, to assess the quality of water away drankhome whatever water was available (Table 3). in the Not Risky group simply drank whatever water from before imbibing. In contrast, those was available (Table 3). Table 2. Type and frequency of indicators used to assess drinking water quality at and away from home.2. Type and frequency of indicators used to assess drinking water quality at and away from home. Table
Risky
Not Risky
Risky
Not Risky
Water Water Water @ HomeWater Elsewhere Indicator @ Home Indicator WaterWater @ Home Water Elsewhere Water @ Home Elsewhere Elsewhere Most common indicator Taste Taste TrustTrust Taste Trust Most common indicator Taste Trust Second most common indicator Appearance Media Appearance Taste Second most common indicator Media Appearance TasteMedia Appearance Taste Third most common indicator Media Media Third most common indicator Media Taste Media Media Table 3. Relationships relevant to trust in government. Table 3. Relationships relevant to trust in government. Trustin inGovernment Government vs. Trust vs. Considered Water Quality Considered Water Quality OpinionofofWater Water Quality Opinion Quality
Chi-Squared Analysis Chi-Squared Analysis X2
2 = 12.67, =X12.67, p = 0.000 p = 0.000 X2 =X10.35, p = 0.001 2 = 10.35, p = 0.001
T testT test Not significant Not significant t(83) t(83) = ´2.94, p = 0.00 = −2.94, p = 0.00
As anticipated, those using media to judge their home drinking water exhibited greater awareness of drinking ´0.263,pp==0.000, 0.000, N N == 183). 183). Although Although the type of drinking water water incidents/issues incidents/issues (r == −0.263, media, e.g., newspaper, TV, TV,etc., etc.,used usedto toobtain obtainwater waterquality quality information information failed failed to to yield yield significant significant correlations, regarding what media source each generation used toused obtain correlations, interesting interestingtrends trendsemerged emerged regarding what media source each generation to the information that guided their drinking water perceptions and actions (Figure (Figure 2). obtain the information that guided their drinking water perceptions and actions 2).
Figure 2. Media sources used to access health information by generation.
Findings show show younger youngergenerations generations(Generation (GenerationXXborn bornbetween between1965 1965and and1980 1980 and Generation Findings and Generation Y Y born between 1981 and 1994) were twice as likely as older generations (Baby Boomers born born between 1981 and 1994) were twice as likely as older generations (Baby Boomers born between between and Traditionalists 1964 and Traditionalists born1925 between 1925toand to use the Internet for 1946 and 1946 1964 and born between and 1945) use1945) the Internet for information information about drinking water issues, although all generations reliedUnsurprisingly, on television. about drinking water issues, although all generations mostly relied onmostly television. Unsurprisingly, Traditionalists were most likely to scour local newspapers as the main source of health information while Generation Y was the least likely to read local newspapers. Finally, magazines proved the least useful for obtaining and thus likely dispersing public health information. Qualitatively, participants rarely relied on public health information, regardless of the source,
Hydrology 2016, 3, 8
8 of 14
Traditionalists were most likely to scour local newspapers as the main source of health information while Generation Y was the least likely to read local newspapers. Finally, magazines proved the least useful for obtaining and thus likely dispersing public health information. Qualitatively, participants rarely relied on public health information, regardless of the source, when considering drinking water quality. Most simply “trusted” that whatever water was publically offered would be safe to drink, with a generalized sense of trust extended to the capacity and ability of Hydrology 2016, 3, 8 8 of 14 authorities to identify and fix any arising drinking water problem: I do [trust] I mean, I’m of a generation that believed the government water, education,sense electricity telephones was responsibility offered would be safe to supplied drink, with a generalized of trustand extended to theand capacity and ability for authorities to identify Iand fixthe any arising water problem: I do [trust] I mean, I’mgotten of a sick doingof a good job (Melbourne); trust local waterdrinking system or the local authorities and have never that believed the some government suppliedexhibited water, education, electricity and telephones and was from itgeneration before (Wagga). Further, participants a tendency to attribute that an “undeniable” responsibility for doing a good job (Melbourne); I trust the local water the localparticipant authorities and havenoted element of risk existed with delivering safe drinking water, suchsystem as theorSydney who never gotten sick from it before (Wagga). Further, some participants exhibited a tendency to attribute the chance of infection “can’t be helped”: If something goes wrong I would trust them to take charge. I expect that an “undeniable” element of risk existed with delivering safe drinking water, such as the Sydney them to give me quality water if there was a problem, unless it was their fault, in filtration or whatever, there is the participant who noted the chance of infection “can’t be helped”: If something goes wrong I would trust chancethem of infection getting in there and can’t helped (Sydney). Finally, the majority believed theyincould to take charge. I expect them to itgive me be quality water if there was a problem, unless it was their fault, personally discern drinking water safety by taste alone, as the following four comments demonstrate: filtration or whatever, there is the chance of infection getting in there and it can’t be helped (Sydney). Finally, 1. Well is ok, butthey there would be a tastediscern of chlorine like somewhere like by Martin Wellington, theI presume majority itbelieved could personally drinking water safety tasteoralone, as the they taste good and Ifour guess there is demonstrate: colour, but I guess is also aitcase what the pipesbeare like.of Ichlorine have not following comments 1. WellitI presume is ok,ofbut there would a taste likespent somewhere like Martin or Wellington, they taste and I guess is colour, I guess it is also case of trust time in Dunedin, but I know they have issues withgood their water so there all I can go bybut is taste (NZ); 2. Iawould what the pipes are in like.[Fielding] I have not last spentweek time and in Dunedin, buttasted I knownasty they have with their all I it. Oh, actually I was the water and issues I didn’t feel toowater goodso afterwards can go by is taste (NZ); 2. I would trust it. Oh, actually I was in [Fielding] last week and the water tasted nasty (NZ); 3. Probably just from the way it tastes. Normally, you can tell if the water you’re drinking seems okay. and I didn’t feel too good afterwards (NZ); 3. Probably just from the way it tastes. Normally, you can tell if the It’s normally through the taste of it, not through the information that we get, but just normally through the water you’re drinking seems okay. It’s normally through the taste of it, not through the information that we get, taste of it (Sydney); 4. If it doesn’t taste right, then I won’t drink it (Hobart). Quantitatively, frequencies but just normally through the taste of it (Sydney); 4. If it doesn’t taste right, then I won’t drink it (Hobart). revealed most participants (70%) trusted their government manage and supply consumers Quantitatively, frequencies revealed most participants (70%)totrusted their government to manage with safe drinking water, even as disagreement about the quality ofemerged their present and supply consumers with safe drinkingemerged water, even as disagreement about drinking the qualitywater. Chi-square T-testswater. (TableChi-square 3) identified several significant relationships relevant to trust of theiranalysis present and drinking analysis and T-tests (Table 3) identified several in government: considered their watertoquality and trust in government provide drinking water) significant relationships relevant trust in government: considered to their water safe quality and trust in and government to provide safe drinking water) and opinion of water quality and trust in government to provide opinion of water quality and trust in government to provide safe drinking water. safe drinking water. presents the two groups, Risky and Not Risky, and the variables sex, employment Figure 3 visually Figure visually presents the twochi-square groups, Risky and Not Risky, between and the variables sex, risk status and water3 treatment. Significant analyses emerged participants’ employment status and water treatment. Significant chi-square analyses emerged between perceptions and their employment, sex, and drinking water treatment activities (Table 4). Finally, T-tests were participants’ risk perceptions and their employment, sex, and drinking water treatment activities (Table conducted to further examine the significant correlations that emerged between risk perception and 4). Finally, T-tests were conducted to further examine the significant correlations that emerged waterbetween treatment/trust in government, additional statistically lending significant support: risk perception risk perception and waterlending treatment/trust in government, additional statistically and water treatment activities t(102) = 2.147, p = 0.3, n = 183, risk perception and trust in government to significant support: risk perception and water treatment activities t(102) = 2.147, p = 0.3, n = 183, risk provide safe drinking water, t(168) = 4.3, p = 0.00, n = 183. perception and trust in government to provide safe drinking water, t(168) = 4.3, p = 0.00, n = 183.
Figure 3. Risk perceptionby bysex, sex, employment employment status water treatment. Figure 3. Risk perception statusand and water treatment. Table 4. Significant chi-squared results for relationships associated with risk perception.
Risk Perception vs. Employment Sex
Chi-Square Analysis X2 = 9.79, p = 0.002 X2 = 7.24, p = 0.007
Hydrology 2016, 3, 8
9 of 14
Table 4. Significant chi-squared results for relationships associated with risk perception. Risk Perception vs.
Chi-Square Analysis
Employment Sex Water treatment
X2 = 9.79, p = 0.002 X2 = 7.24, p = 0.007 X2 = 8.23, p = 0.003
Further trends emerged from qualitative analysis of consumer water treatment (e.g., boiling, filtration) activities. Expectedly, frequency descriptive statistics revealed that those believing municipal drinking water was risky treated their water more often (75%) than those who did not consider it risky (48%), as illustrated in Figure 3. Thematic analysis of open-ended responses to the question Do you do anything to enhance the quality of your drinking water? revealed the most common treatments were: 1. refrigeration to produce organoleptic changes; 2. filtering for anti-chemical treatment, specifically chlorine content, and 3. boiling for anti-microbial treatment. Overall, the majority of participants (57%) engaged in one or more drinking water treatment activities. Only 2% who performed any activity aimed at reducing drinking water risk merely targeted organoleptic changes. In contrast, 29% performed at least one anti-chemical treatment and 26% applied an anti-microbial treatment. Further, 43% of participants did not treat their drinking water at all. No significant relationships emerged, however, regarding the type of water treatment used (organoleptic, anti-chemical, or anti-microbial). 4. Discussion Sixty-five percent (65%) of participants considered drinking water in Australia and New Zealand to be a “low risk” behavior. This is curious when conceptualized in light of Bennett et al.’s [16] “fright factors” for predicting more “worrying” and “less acceptable” which offers a useful taxonomy for assessing risk. When risk perception is analyzed alongside public trust, however, additional theoretical explanations become apparent. Participants living in Australia and New Zealand exhibited a high level (70%) of trust towards authorities responsible for water management. Hence, although water contamination/pollution consistently ranks as a concern in local and international environmental surveys [25,26], participants’ concerns were mitigated by their assumption that authorities would manage any/all issues as needed. These findings are similar with Doria, Pidgeon and Hunter’s [27] research which found that although many UK residents had reservations about some water treatments, most expressed trust in the authorities charged with managing their water. Generalized trust, however, may be naïve given that research has shown neither monitoring nor well-designed risk assessment guidelines often play a major role in watershed management decisions [9]. Both qualitative and quantitative findings also lend further support to international studies revealing consumers generally trust authorities to provide safe drinking water that requires no further treatment of whatever flows from the tap, irrespective of location and actual variation in water quality. Rather than exhibit knowledge reflecting the actual quality or safety of their drinking water, most participants simply relied on how their water tasted to decide whether to drink and/or treat it, evidencing risk exposure as a normalized, often unquestioned reality. This parallels Doria, Pidgeon and Hunter’s [27] finding that despite many research participants being aware of discussions about risks related to chemicals in their water, they still did not consider drinking it a risky activity and perceived they had sufficient information to assess the risks and benefits of water treatments. Similarly, Marsh [28] found that even when a potential risk was identified, specifically watershed contamination from the New Zealand dairy industry, consumers regarded it as an unavoidable risk, opting to pay more for water treatment, rather than contamination prevention, to ensure the ongoing economic viability of the area’s key employer. A possible explanation for the high level of trust noted amongst participants is the dearth of contrary information available. Agencies responsible for managing Australian and New Zealand water
Hydrology 2016, 3, 8
10 of 14
do not provide consumers with sufficient information to either identify potential risks or contexts required to make informed decisions about how to manage water relevant to perceived risk [5]. This lack of suitable consumer information is similar in France where health risks associated with mercury levels in fish have been observed. In this example, researchers found risk information regarding mercury contamination predominantly existed on a website the general public was unlikely to seek out [29]. Likewise, important risk information about Australian and New Zealand drinking water appears in obscure places not readily accessible or understood by the general public, namely in technical reports that may not be publically available or, as the following warning noted in factsheet from NSW health are simply noted as a comment: Several outbreaks of cryptosporidiosis around the world have been linked to contaminated water supplies. In water supplies not linked to outbreaks the risk of infection is difficult to determine, but is quite low. There is insufficient evidence to recommend that all HIV-infected and immuno-suppressed people avoid drinking tap water altogether. However people who wish to avoid possible risks from tap water may, after consultation with a doctor, choose to observe the following precautions: boil tap water, filter water with certain home filters, or drink certain types of bottled water. [30] Widespread reliance on organoleptic properties as indicators of local water quality reveals internal, personally-experienced factors are most commonly used to directly detect changes and take any relevant actions by those that did and did not consider drinking water to be a risky activity. This finding is also consistent with prior research, particularly with consumers in the UK and Portugal [22]. These findings also coincide with National Health and Medical Research Council (NHMRC) (2011) [14] guidelines suggesting chemical and microbial contamination pose the greatest risks, although just about a quarter of the sample followed the national recommendation to focus on anti-microbial contamination. When travelling, organoleptic factors are superseded by trust in government authorities, the external factor most often used to determine risk. Rather than be perceived as awareness of limited personal health literacy, however, this finding may imply apathy, given a review of numerous studies led Wachinger et al. [31], to suggest that people use trust in authorities as an “excuse” to not take any direct personal risk mitigation actions or make contrary decisions. Although participants were asked to list information sources for their drinking water and health information, no significant relationships emerged between media source and drinking water perceptions of risk or quality. This finding is unsurprising in light of media studies. While the media is generally the first point of call for alerting consumers of issues, as numerous studies note, and although media may affect issue perception, it has little to no impact on consumer actions [27,32,33]. Likewise, participants who could recall an issue related to water quality were more likely to cite the media as influencing their judgment than those who could not; overall, most participants did not believe the media was a major source of public health information. The media’s lack of influence may be related to how the media typically portrays public health issues. As Bennett et al. [16] note, public health issues involving greater drama, having someone to victimize or vilify, containing strong visuals, such as slime or sick people, attempted cover-ups, conflicting stories, and crime and/or links to personalities/current issues usually get more media attention and airtime. Thus, with the exception of the 1998 Sydney Water Crisis, which gathered significant media attention and had many sensational elements, water quality concerns, including reports and changes to the Australian Drinking Water Standards, tend to be insufficiently dramatic to generate the level of media attention needed to raise awareness [34]. Further, except for the notable watershed contamination incidents from spills or point source “acute incidences”, many concerns surrounding centralized treated drinking water relate to more chronic issues, such as the carcinogenic nature of chlorination, which, as a chronic risk, is likely to receive less media attention than acute/novel risks [35]. Thus, our study lends further support not only for the development of appropriately contextualized information campaigns but also indicates that if health or water authorities plan to use the media, they must ensure target populations are being reached. For example, our results indicate age matters. Thus, if one sought to alert those over 70 of potential risks from drinking untreated tank water, then television and newspapers would be the best
Hydrology 2016, 3, 8
11 of 14
sources to consider, as Figure 2 demonstrates, in contrast with the Internet which would assist with reaching younger generations. While location did not significantly impact drinking water risk perceptions, meaningful trends emerged about the existence and awareness of water-related issues qualitatively reflected in discussions of risk perception. Two locations stand out in this regard. In Hobart, more participants considered drinking water to be a risky activity than in all other locations (Figure 1). If contextualized amid prior research revealing that, at the time of our interviews, a third of residents in their state, Tasmania, did not have access to drinking water of suitable quality, [36] resulting in media attention, statements from the Australian Medical Association promoting boiled water alerts in specific areas [37] and a proposal by the state government to create a centralized entity for water and sewage control [38], such views both make sense and highlight the importance of extensive local knowledge. The second location of interest is Brisbane. In Brisbane, differences between Risky and Not Risky perceptions were less pronounced than in all other locations except Hobart. This, too, may have been impacted by their increased awareness of water issues due to publicity surrounding a proposed trial of recycled water in a nearby city, Toowoomba. The recycled water project in Toowoomba generated heated debate, witnessed the creation of activist groups and generated public confusion [39,40]. Despite public relations issues that plagued the Toowoomba project, the Queensland Government developed plans to increase and expand the use of recycled water, with the caveat that it would not be used for drinking water except in the event of a shortage [41]. Again, the importance of issue awareness is noteworthy as Brisbane participants may have been exposed to more information than usual about drinking water treatment and processes which, in turn, may have impacted their risk perceptions. Location-based variation in risk perception thus supports calls for the relevance of geography as a core consideration in risk communication strategy design and implementation [42,43]. Nevertheless, one ought to proceed with caution to not overestimate “local” knowledge as well as ensure visitors’ and new residents’ needs and perceptions are addressed if highly localized strategies are pursued. Participants not employed were more likely (56%) than employed participants (30%) to perceive that drinking water could be risky (Figure 1). This significant difference is consistent with the findings of Rundblad, Knapton and Hunter [32], who examined risk mitigation actions in response to a specific contamination event in the UK. Rundblad, Knapton and Hunter [32] found the employed were unlikely to read official information provided after a contamination event and were less likely to comply with advice to boil water than the non-employed. Given that 81% of participants were employed in the present study, further investigation is required to determine the true impact of employment status on water issue awareness and risk reduction activities to facilitate development of successful awareness campaigns and promote risk reduction behaviors when required, such as adherence to boiled water alerts. The majority who perceived drinking water as risky treated their tap water, often using more than one method. A range of misperceptions, however, was qualitatively evidenced about the extent and effectiveness of treatment types, risk exposure and health concerns in contrast with public health policy and research recommendations. Many participants (57%) stated they did “something” to their tap water prior to drinking it, including 75% of those who did and 52% who did not consider drinking water a risky activity. Those who treated their drinking water primarily sought to reduce chemical contaminants, including fluoride and chlorine. Only 2% of participants altered the organoleptic properties (e.g., chilling), which had no impact on potential contaminants. Twenty-six percent (26%) of participants treated their water in a manner that would reduce their exposure to microbial contaminants, predominantly boiling before drinking. The vital role communication campaigns play in affecting public perception and action is highlighted by such findings. Hence, public health programs seeking to inform communities of current risks and plausible risk reduction factors would largely benefit from developing population-focused campaigns, rather than one program for all.
Hydrology 2016, 3, 8
12 of 14
5. Conclusions Our research examined drinking water perception and treatment activity in Australia and New Zealand to better understand which factors influence knowledge acquisition and risk exposure. Most of the 185 interviewees did not consider drinking water a risky activity and relied on direct taste or trusted water managers to determine safety. The media were the least likely information source participants consulted to identify drinking water quality issues or make behavioral decisions, although the type of media accessed varied by age. Risk perception was significantly correlated with employment status and sex, while location proved statistically insignificant yet manifested qualitative differences. Thus, we argue particular attention ought to be given to age, gender and local community experiences with water issues if seeking to improve public literacy and/or health. Such considerations are consistent with risk perception factors in this study and the literature [13]. It is recommended these factors be used to advance public literacy around drinking water, a communication need currently lacking. Although women were more likely than men to think drinking water could be a risky activity, a recent review of risk perception literature by Wachinger et al. [31] concluded gender plays a secondary role, mediating or amplifying initial risk perceptions. Determining how gender shapes drinking water risk perceptions arguably requires a dedicated study that is able to limit or identify other contributing factors, such as prior experience and trust in authorities—two key external factors Wachinger et al. [31] note more directly affect and influence risk perception. As Chess et al. [44] note, those with prior water contamination experience require suitably structured information and should not be treated as ignorant of relevant issues. We suggest a third stakeholder, the consumer, be added to Serveiss’ [9] watershed ecological risk assessment design. Involving consumers in watershed management is vital given that they constitute the “most challenging aspect” of the design, namely human activity [9]. From a management perspective, this change would align the risk assessment paradigm with the socially informed “adaptive management of watersheds” proposed by Allan et al. [45]. Drinking water quality information needs to be supplied in a context and manner that is relevant and comprehensible by consumers. Broad lack of awareness about the most suitable and safe water treatment activities highlights the need for holistic awareness campaigns that are designed to improve health literacy. Such changes would help individuals to make informed decisions about water consumption and watershed activities and begin remedying consumers’ “inability to evaluate science” [45], an ongoing barrier to developing an adaptive management approach for watersheds. Given most participants relied on taste or trust to make drinking water decisions, future campaigns may benefit from a multi-faceted educational approach, noting contaminated water may not look or taste different, and describe the complexity of factors in determining water safety. Consumers may also benefit if campaigns acknowledge that water perceptions are developed from a myriad of factors and negative media coverage of any single factor, for example a sensationalized contamination scare, hence normalizing the need for heightened literacy rather than risk individuals feel stigmatized as “ignorant”. By providing counter-evidence from the water authorities with whom consumers place their trust, incorrect information and/or assumptions about watershed management and drinking water quality, particularly unsafe behavior caused by “over-caution” surrounding sensationalized public health incidents [27,32], may be remedied and bring about positive change. Author Contributions: Andrea Crampton and Angela Ragusa conceived and designed the protocols; Andrea Crampton conducted the interviews; Angela Ragusa analyzed the data; both authors wrote the paper and Angela provided final editing. Conflicts of Interest: The authors declare no conflict of interest.
References 1.
Frumkin, H.; Frank, L.; Jackson, R.J. Urban Sprawl and Public Health: Designing, Planning and Building for Healthy Communities; Island Press: Washington, DC, USA, 2004.
Hydrology 2016, 3, 8
2. 3.
4. 5.
6. 7. 8. 9. 10.
11.
12.
13. 14. 15.
16.
17. 18. 19. 20. 21.
22.
23. 24. 25. 26. 27.
13 of 14
UN Water. Policy Brief: Water Quality. Available online: http://www.unwater.org/downloads/ waterquality_policybrief.pdf (accessed on 13 April 2015). Kendall, M. Drought and its role in shaping water policy in Australia. In Droughts in Arid and Semi-Arid Regions; Schwabe, K., Albiac, J., Connor, J.D., Hassan, R.M., Gonzalez, L.M., Eds.; Springer: Dordrecht, The Netherlands, 2013; pp. 451–467. Australian Department of Foreign Affairs and Trade. Available online: http://www.smartraveller.gov.au/ zw-cgi/view/TravelBulletins/General (accessed on 12 August 2015). Crampton, A. Water, an essential resource and potential health risk! Rural perceptions, awareness and knowledge of health risks. In Rural Lifestyles, Community Well-Being and Social Change; Ragusa, A.T., Ed.; Benthan Science Publishers: Emirate of Sharjah, United Arab Emirates, 2014; pp. 473–515. WHO. Guidelines for Drinking-Water Quality, 4th ed. Available online: http://www.who.int/ water_sanitation_health/publications/dwq_guidelines/en/ (accessed on 13 April 2015). Tversky, A.; Kahneman, D. Advances in prospect theory: Cumulative representation of uncertainty. J. Risk Uncertain. 1992, 5, 297–323. [CrossRef] Fishhoff, B.; Kadvany, J. Risk: A Very Short Introduction; Oxford University Press: Oxford, UK, 2011. Serveiss, V.B. Applying ecological risk principles to watershed assessment and management. Environ. Manag. 2002, 29, 145–154. [CrossRef] Sterling, S.M.; Garroway, K.; Guan, Y.; Ambrose, S.M.; Horne, P.; Kennedy, G.W. A new watershed assessment framework for Nova Scotia: A high-level, integrated approach for regions without a dense network of monitoring stations. J. Hydrol. 2014, 519, 2596–2612. [CrossRef] Renn, O. Risk communication and social amplification of risk. In Communicating Risks to the Public; Kasperson, R.E., Stallen, P.J.M., Eds.; Kluwer Academic Publishers Group: Dordrecht, The Netherlands, 1991; pp. 287–323. Ragusa, A.T.; Crampton, A. Are there parasites in your water? Sociology of risk & science news. In Proceedings of the Australian Sociological Association Conference, Auckland, New Zealand, 4–7 December 2007. Doria, M.F. Factors influencing public perception of drinking water quality. Water Policy 2010, 12, 10–19. National Health and Medical Research Council (NHMRC). Australian Drinking Water Guidelines 2011. Available online: https://www.nhmrc.gov.au/guidelines-publications/eh52 (accessed on 13 April 2015). New Zealand Ministry of Health. Drinking-Water Standards for New Zealand 2005 (Revised 2008). Available online: http://www.health.govt.nz/publication/drinking-water-standards-new-zealand-2005-revised-2008 (accessed on 14 April 2015). Bennett, P.; Calman, K.; Curtis, S.; Fischbacher-Smith, D. Chapter 1. Understanding public responses to risk: Policy and practice. In Risk Communication and Public Health; Bennett, P., Calman, K., Curtis, S., Fischbacher-Smith, D., Eds.; Oxford University Press: New York, NY, USA, 2010. Sarantakos, S. Social Research; Palgrave Macmillan: London, UK, 2005. Bryman, A. Social Research Methods, 4th ed.; Oxford University Press: Oxford, UK, 2012. Hesse-Biber, S.N. Mixed Methods Research: Merging Theory with Practice; Guilford Press: New York, NY, USA, 2010. Tongco, M.D.C. Purposive sampling as a tool for informant selection. Ethnobot. Res. Appl. 2007, 5, 147–158. Australian Bureau of Statistics. 32180. Regional Population Growth, Australia, 2013–2014. Available online: http://www.abs.gov.au/AUSSTATS/
[email protected]/allprimarymainfeatures/797F86DBD192B8F8CA2568A90013 93CD?opendocument (accessed on 20 November 2015). Statistics New Zealand. 2013 Census Quickstats about a Place: Auckland Region. Available online: http://www.stats.govt.nz/Census/2013-census/profile-and-summary-reports/quickstats-about-a-place.aspx? request_value=13170&tabname= (accessed on 20 November 2015). Neuman, W.L. Social Research Methods, 7th ed.; Pearson Education: Boston, MA, USA, 2011. Walter, M. Social Research Methods, 2nd ed.; Oxford University Press: Oxford, UK, 2011. Ross, V. The Determinants of Trust and Satisfaction with Drinking Water Quality; CSIRO: Mildura, Australia, 2005. Jones, J.M. In U.S., Concern about Environmental Threats Eases. Available online: http://www.gallup.com/ poll/182105/concern-environmental-threats-eases.aspx (accessed on 13 April 2015). Doria, M.F.; Pidgeon, N.; Hunter, P.R. Perceptions of drinking water quality and risk and its effect on behavior: A cross-national study. Sci. Total Environ. 2009, 407, 5455–5464. [CrossRef] [PubMed]
Hydrology 2016, 3, 8
28. 29.
30.
31. 32.
33. 34.
35.
36. 37. 38. 39.
40. 41. 42.
43. 44. 45.
14 of 14
Marsh, D. Water resource management in New Zealand: Jobs or algal blooms? J. Environ. Manag. 2012, 109, 33–42. [CrossRef] [PubMed] Blanchemanchea, S.; Marette, S.; Roosen, J.; Verger, P. ‘Do not eat fish more than twice a week’. Rational choice regulation and risk communication: Uncertainty transfer from risk assessment to public. Health Risk Soc. 2010, 12, 271–292. [CrossRef] Preventing cryptosporidiosis: A guide for persons with HIV, AIDS. Available online: http://www.health.nsw.gov.au/environment/factsheets/Pages/crypto-hiv.aspx (accessed on 18 February 2016). Wachinger, G.; Renn, O.; Begg, C.; Kuhlicke, C. The risk perception paradox—Implications for governance and communication of natural hazards. Risk Anal. 2013, 33, 1049–1065. [CrossRef] [PubMed] Rundblad, G.; Knapton, O.; Hunter, P.R. Communication, perception and behavior during a natural disaster involving a ‘Do Not Drink’ and a subsequent ‘Boil Water’ notice: A postal questionnaire study. BMC Public Health 2010, 10, 641–653. [CrossRef] [PubMed] Wåhlberg, A.A.; Sjöberg, L. Risk perception and the media. J. Risk Res. 2000, 3, 31–50. [CrossRef] Crampton, A.; Ragusa, A.T. A tale of two cities: Who has the cleanest drinking water, Melbourne or Sydney? In Proceedings of the Australian Sociological Association Conference, Melbourne, Australia, 2–5 December 2008; Majoribanks, T., Ed.; The University of Melbourne: Melbourne, Australia, 2008. Driedger, S.M. Creating shared realities through communication: Exploring the agenda-building role of the media and its sources in the E. coli contamination of a Canadian public drinking water supply. J. Risk Res. 2008, 11, 23–40. [CrossRef] Whelan, J.J.; Willis, K. Problems with provision: Barriers to drinking water quality and public health in rural Tasmania, Australia. Rural Remote Health 2007, 7, 1–9. Anonymous. Doctors Prescribe One-Year Solution to Water Woes; The Mercury: Hobart, Australia, 2007. Freeman, J. What’s with Water Grab?; The Mercury: Hobart, Australia, 2008. Alexander, K.S.; Price, J.C.; Browne, A.L.; Leviston, Z.; Bishop, B.J.; Nancarrow, B.E. Urban watersecurity research alliance technical report No. 2. In Community Perceptions of Risk, Trust and Fairness in Relation to the Indirect Potable Use of Purified Recycled Water in South East Queensland: A Scoping Report; Urban Water Security Research Alliance: Sydney, Australia, 2008. Hurlimann, A.; Dolnicar, S. When public opposition defeats alternative water projects—The case of Toowoomba Australia. Water Res. 2010, 44, 287–297. [CrossRef] [PubMed] Queensland Water Commission. SEQ Water Reform. Available online: http://www.qwc.qld.gov.au/reform/ index.html (accessed on 14 April 2015). Fischbacher-Smith, D.; Irwin, A.; Fischbacher-Smith, M. Bringing light to the shadows and shadows to the light: Risk, risk management, and risk communication. In Risk Communication and Public Health, 2nd ed.; Bennett, P., Calman, K., Curtis, S., Fischbacher-Smith, D., Eds.; Oxford University Press: Oxford, UK, 2010; pp. 23–38. Scherer, C.W.; Cho, H. A social network contagion theory of risk perception. Risk Anal. 2003, 23, 261–267. [CrossRef] [PubMed] Chess, C.; Johnson, B.; Kovacs, D.; Schwar, C. Using research to inform agency communications: Perceptions of drinking water. Appl. Environ. Educ. Commun. 2002, 1, 221–228. [CrossRef] Allan, C.; Curtis, A.; Stankey, G.; Shindler, B. Adaptive management and watersheds: A social science perspective. J. Am. Water Resour. Assoc. 2008, 44, 166–174. [CrossRef] © 2016 by the authors; licensee MDPI, Basel, Switzerland. This article is an open access article distributed under the terms and conditions of the Creative Commons by Attribution (CC-BY) license (http://creativecommons.org/licenses/by/4.0/).