Exploring Repositories of Scientific Workflows Julia Stoyanovich∗
Ben Taskar
Susan Davidson†
University of Pennsylvania Philadelphia, PA, USA
[email protected]
University of Pennsylvania Philadelphia, PA, USA
[email protected]
University of Pennsylvania Philadelphia, PA, USA
[email protected]
ABSTRACT Scientific workflows are gaining popularity, and repositories of workflows are starting to emerge. In this paper we present some initial experiences of information discovery in repositories of scientific workflows. In the first part of the paper we consider a collection of VisTrails workflows, and explore how this collection may be summarized when workflow modules are used as features. We present a hierarchical browsable view of the repository in which categories are derived using frequent itemset mining or latent Dirichlet allocation. We demonstrate that both approaches may be used for effective data exploration. In the second part of the paper we focus on a collection of Taverna workflows from myExperiment.org, and consider how these workflows may be browsed using modules and tags as features. Finally, we outline some interesting challenges and describe conditions under which these techniques work well for repositories of scientific workflows, and conditions under which additional work is needed for effective data exploration.
1.
INTRODUCTION
Workflows have been gaining popularity in life sciences, where users deal with large amounts of data and perform sophisticated in silico experiments. Workflow management systems can help automate repetitive tasks and record the provenance of a data product, making the experiment reproducible. A workflow is typically represented by a graph with labeled nodes and typed, labeled edges. Nodes correspond to functional modules, and edges represent the data flow between modules. In addition to the graph structure, workflows may be characterized by a variety of other attributes, such as a text description of the workflow as a whole, a description of each module, a hierarchical relationship between ∗ This material is based in part upon work supported by the National Science Foundation grant 0937060 to the Computing Research Association for the CIFellows Project. † This material is based in part upon work supported by the National Science Foundation grant IIS 0803524.
Permission to make digital or hard copies of all or part of this work for personal or classroom use is granted without fee provided that copies are not made or distributed for profit or commercial advantage and that copies bear this notice and the full citation on the first page. To copy otherwise, to republish, to post on servers or to redistribute to lists, requires prior specific permission and/or a fee. WANDS Indianapolis, IN, USA, June 6th, 2010 Copyright 2010 ACM 978-1-4503-0188-6 ...$10.00.
the modules representing sub-workflows, tags assigned to the workflow by its creator or by other users, types of input and output data that the workflow generates, etc. A scientist who wishes to use a workflow development platform may opt for one from among several popular solutions such as Kepler [5], Taverna [16], VisTrails [6], or geWorkbench [15], to name just a few. A scientist may also share his workflows by posting them to myExperiment.org [19], a collaborative platform for the exchange of scientific workflows and experimental plans, or to the Kepler Component Repository (library.kepler-project.org/kepler/). Consider Joe, a novice user of a popular workflow management system Taverna [16]. Joe wishes to develop a workflow that takes as input gene identifers and looks up KEGG [12] pathways relevant to the query genes. The workflow should then identify other genes that are relevant to the retrieved pathways, and query OMIM [14] for records that describe heritable disorders to which any of the genes are linked. Joe would like to see examples of workflows that implement similar functionality, demonstrating which processing modules may need to be invoked, and how to transform the data at intermediate processing steps so that the output of a KEGG lookup may be used as a search query in OMIM. Joe visits myExperiment.org and looks for relevant workflows by issuing a search query, e.g. “OMIM KEGG”. As a collaborative platform, myExperiment.org implements a variety of social web features. For example, workflows are tagged by its creator and by other users of the system, allowing for more effective searching of the corpus. Joe’s query may therefore return workflows in which “OMIM” or “KEGG” are part of the description, correspond to module names, or occur among the tags of the workflow. Which of these features are used to answer the query depends on the implementation of the search functionality. The focus of our work is to study the effect of using tags and module names as features. Suppose that Joe was able to identify a set of interesting workflows as a result of his search. He would, however, like to expand this set with other workflows that are potentially interesting even if they did not precisely match his query. After all, asking a high-recall query is a challenging task, since it requires that the user is both well-aware of his information need and able to formulate it precisely in terms of the available features. These expectations are often unrealistic, particularly for novice users like Joe. Indeed, in scientific research, knowing what question to ask and how to ask it amounts to solving a significant part of the problem. There is therefore a need for intuitive data exploration tools
that facilitate information discovery. A particular family of data exploration tools summarizes collections one feature at a time. A tag cloud presents a set of all, or of the most frequent, tags used in the collection, with font size corresponding to the popularity of a tag. Tag clouds are currently used by a variety of social tagging sites, including myExperiment.org. A similar presentation may, of course, be used for discrete features other than tags. For example, a module cloud may be generated for a scientific workflow collection, in which the most frequently used modules would be the most prominent. A significant drawback of a cloud is that using all available features may overwhelm the user, preventing him from finding the features of interest. There are often thousands of features, such as tags or module names, in use in a particular community – too many to present in an unstructured manner. On the other hand, if only a handful of most popular features are selected, they may not be relevant to a specific information need. Another method that summarizes collections one feature at a time is faceted browsing, which is based on a hierarchically organized collection of mutually exclusive, collectively exhaustive properties called facets [23]. Faceted hierarchies are used extensively to organize product catalogues (e.g., Amazon.com), scientific articles [11], archaeological finds [18], etc. Note that, while facets represent orthogonal properties of items in a collection (e.g., color and make of a car), an item may belong to one or more facets (e.g., a particular car may be both red and a Ferrari). In contrast to monolithic hierarchies in which categories are disjoint, the same item may be reachable through several paths in a faceted hierarchy. A faceted representation has an obvious advantage over a feature cloud. It alleviates the too many features problem by organizing features into a hierarchy, allowing navigation at multiple levels of granularity. However, to enable faceted browsing of workflow collections, one must first ensure that a suitable hierarchy over the features is available, or can be derived. For features of interest to us, namely tags and workflow modules, no pre-defined hierarchies exist to the best of our knowledge. Recall that faceted browsing is still essentially a featureat-a-time method. This aspect of the model may limit the effectiveness of data exploration because it does not explicitly capture the legal, or common, combinations of features. For example, while make and color of a car are, in general, orthogonal properties, certain combinations of values are far more likely than others, for certain cars (e.g., Ferraris are often red). This analogy also applies to scientific workflows, where a myExperiment.org workflow tagged with KEGG will also likely be tagged with pathways. Similarly, a VisTrails workflow that computes a histogram is likely to subsequently display a histogram on the screen. Meaningful combinations of features, which we term categories, can greatly assist the user in identifying interesting items, and we term this type of data exploration category-at-a-time. An assignment of features to categories may be known a priori, or it may be derived from the data. In our application scenario, categories are not known in advance. An important question is then: how can appropriate categories of features be derived and organized hierarchically, to enable browsing? This paper takes a first step in this direction for collections of scientific workflows. We consider two collections: Taverna
workflows that are publicly available on myExperiment.org, and VisTrails workflows created by students of a scientific visualization course at the University of Utah. Our goals are to use the data to derive labeled categories (combinations of features), to be used for data exploration. As with faceted classification, categories describe orthogonal properties, and items may belong to several categories. Ideally we would also like to provide a hierarchical view of the categories. We will use two methods, frequent itemset mining and latent Dirichlet allocation, to advance towards these goals. We also note that clustering is a well-known data exploration paradigm. Many clustering algorithms exist, and the category-at-a-time approaches that we use may also be considered a type of clustering. In [21] several distancebased clustering approaches are explored for the collection of VisTrails workflows that we also use in our experiments. Distance-based clustering may be termed all features at-atime in our terminology, because all features together make up a distance between two items. Distance-based clustering differs from our approach in that the clusters are not easily labeled. Also, each cluster represents a set of items that are similar along all dimensions, and does not discriminate between aspects of functionality, and aspects of similarity. Finally, each item is assigned to exactly one cluster. This paper makes the following contributions. First, we propose to use frequent itemset mining and topic modeling, a state of the art data exploration technique, for exploring repositories of scientific workflows, and adapt these techniques to our setting. Second, we present results of an evaluation of appropriateness of these techniques on two real repositories of scientific workflows. Third, we discuss the conditions under which these data exploration techniques work well, and conditions for which additional techniques may need to be developed. The remainder of this paper is organized as follows. We describe the datasets in Section 2, and present our proposed technical approach in Section 3. Section 4 details our experimental evaluation. We discussion our findings and intuitions in Section 5 and conclude in Section 7.
2. DESCRIPTION OF THE DATASETS We now describe two datasets that motivate our work. The first is a thematically focused collection of VisTrails workflows that contains workflow specifications with a limited amount of meta-data. The workflows in this collection deal primarily with information visualization tasks. We will explore the use of modules as features, and will attempt to derive categories of modules for exploring this dataset. The second is a collection of Taverna workflows downloaded from myExperiment.org on February 16, 2010, consisting of workflow specifications and rich tagging information. This dataset is smaller in size than the first, and covers a broader range of functionality. Here, we will explore the utility of using both tags and modules as features.
2.1 VisTrails VisTrails is an open-source scientific workflow and provenance management system developed at the University of Utah [6]. VisTrails represents a workflow with a graph, where labeled nodes correspond to processing modules, and typed edges stand for dataflow connections between pairs of modules. A distinguishing feature of VisTrails is the detailed recording of the provenance of data products, workflow spec-
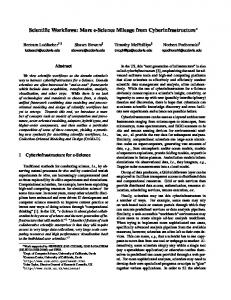
140 120 100
# modules
ifications, and workflow executions [6]. VisTrails has been used as an instructional platform for a scientific visualization (SciVis) course at the University of Utah. The VisTrails team generously shared with us the workflows that were created by the students in this course. Our data analysis in this section, and the evaluation of our proposed methods in Section 4.1, is based on the Fall 2007 SciVis dataset, the same dataset as was used in [21]. Over the course of the semester the students were required to submit 5 homework assignments and a final project, with each assignment consisting of several problems. The problems were manually classified by the course staff as relating to one of thirteen classes that describe the type of a problem the students were solving [21]. Students submitted both the final solution for each problem, and the complete workflow provenance, i.e., workflows that were created at intermediate development steps. As was done in [21], we identified the workflows that corresponded to the final solution for each problem, and we only use these workflows in our evaluation. Whether or not a workflow corresponds to a final solution is determined by looking at a label assigned to the workflow by the student, e.g., “Problem 1a”. Our final dataset consists of 2075 distinct workflows. This number is higher than 1730, as reported in [21], since we were unable to match their labeling precisely due to formatting inconsistencies. However, the distribution of the number of workflows per class label stayed approximately the same. The workflows in our dataset used 129 distinct processing modules. Workflows sizes, in terms of the total number of modules, ranged from 1 to 128, with 15.5 modules on average, and a median of 12 modules per workflow. Figure 1 summarizes module frequencies in the collection. Note that the frequencies are cumulative, e.g., 62 modules were used in at most 20 distinct workflows, while 77 modules were used in at most 50 distinct workflows. Modules that appear in fewer than 20 workflows (1% of the dataset) are unlikely to be useful as part of a category, because the module by itself does not index a significant portion of the dataset. Likewise, modules that are too common, e.g., those that appear in more than 500 workflows (25% of the dataset) are unlikely to be useful because they do not discriminate well between different types of workflows. Based on the data in Figure 1, where a significant number of modules appears in between 1% and 25% of the dataset, we conclude that using modules to organize this workflow collection into categories is promising.
60 40 20 0 1