SPECIAL SECTION ON SOFTWARE STANDARDS AND THEIR IMPACT IN REDUCING SOFTWARE FAILURES
received January 21, 2018, accepted February 23, 2018, date of publication February 28, 2018, date of current version May 16, 2018. Digital Object Identifier 10.1109/ACCESS.2018.2810295
Exploring the Characteristics of Issue-Related Behaviors in GitHub Using Visualization Techniques ZHIFANG LIAO 1 , DAYU HE1 , ZHIJIE CHEN2 , XIAOPING FAN3 , YAN ZHANG4 , AND SHENGZONG LIU3
1 School
of Software Engineering, Central South University, Changsha 410075, China of Information and Science Engineering, Central South University, Changsha 410075, China 3 School of Information Technology and Management, Hunan University of Finance and Economics, Changsha 410205, China 4 Department of Computer, Communication and Interactive System, School of Engineering and Built Environment, Glasgow Caledonian University, Glasgow G4 0BA, U.K. 2 School
Corresponding authors: Xiaoping Fan (
[email protected]) and Shengzong Liu (
[email protected]) This work was supported in part by the Fundamental Research Funds for the Central Universities of Central South University under Grant 2017zzts607, in part by NSF under Grant 61772560, and in part by the Hunan Provincial Key Laboratory of Finance and Economics Big Data Science and Technology, Hunan University of Finance and Economics.
ABSTRACT Feedback from software users, such as bug reports, is vital in the management of software projects. In GitHub, the feedback is typically expressed as new issues. Through filing issue reports, users may help identify and fix bugs, document software code, and enhance software quality via feature requests. In this paper, we aim at investigating some characteristics of issues to facilitate issue management and software management. We investigate the important degrees of behaviors that are related to issues in popular projects to assess the importance of issues in GitHub and analyze the effectiveness of issue labeling for issue handling. Then, we explore the patterns of issue commits over time in popular projects based on visual analysis and obtain the following results: we find that the behaviors that are related to issues play important roles in the GitHub. We also find that the time distribution of issue commits follows a three-period development model, which approximately corresponds to the project life cycle. These results may provide a new knowledge about issues that can help managers manage and allocate project resources more effectively and even reduce software failures. INDEX TERMS Open-source software community, project development model, visual analysis, issue commit, software management.
I. INTRODUCTION
In recent years, a social coding paradigm in distributed software development has been brought into focus for developers from all over the world. GitHub, which is a special opensource software community and a typical social coding community, has attracted many users and projects in a short period of time [1]. GitHub was launched in 2008, but it seemed to rise to fame overnight; its membership has increased to more than 15 million developers. To help users more easily participate in the development of open-source projects, GitHub provides an issue tracking system for each project. Developers and users often find problems in software systems and are encouraged to report them through the available issue trackers that are set up by development teams.
VOLUME 6, 2018
In the management of software projects, it is important to collect and respond to feedback from software users. If an issue is not well managed or properly handled, the software repository will become very large and filled with duplicate questionnaires, fuzzy function demand lists and bug reports. Project maintainers will be overwhelmed by the large amount of work and the new contributors will not be able to determine the project’s prior works, which may even lead to software failures. Therefore, in GitHub, in effectively managing software and reducing software failures, issue management plays a particularly important role. In this paper, we aim at investigating multiple characteristics of issues to facilitate issue management and eventually help managers achieve efficient software management.
2169-3536 2018 IEEE. Translations and content mining are permitted for academic research only. Personal use is also permitted, but republication/redistribution requires IEEE permission. See http://www.ieee.org/publications_standards/publications/rights/index.html for more information.
24003
Z. Liao et al.: Exploring the Characteristics of Issue-Related Behaviors in GitHub Using Visualization Techniques
Many research efforts have been expended on analyzing issues in open-source software communities, such as the analysis of issue labels, issue management and issue quality. However, such efforts have not explored the importance of issue-related user behavior and the patterns of issue commits and issue handling over time. In this paper, we first investigate the importance of behaviors that are related to issues in popular projects to assess the importance of issues in GitHub and to ensure that the study, which is based on popular projects, is meaningful. Then, we analyze the issue labels to evaluate the effectiveness of issue labeling for issue handling. Finally, we explore the pattern of issue commits over time in popular projects based on visual analysis. In summary, the following research questions will be answered in this paper: RQ1: What user behaviors are important in GitHub? What issue-related user behaviors are important? Are issues important for projects in GitHub? RQ2: Is issue labeling effective for issue handling? RQ3: Is there any pattern in the commits of issues over time based on popular projects? If so, is there a relationship between the pattern and the project life cycle? The remainder of this paper is structured as follows: Section 2 introduces the related research work, which mainly focuses on issues on GitHub. Section 3 describes the datasets that are used in our paper. Section 4 introduces the research methods and the research results on the importance of issuerelated behaviors. Section 5 illustrates the research methods and the research results on the effectiveness of issue labeling. Section 6 introduces the research methods and the research results on the time characteristics of issue commits. Finally, we present our conclusions in Section 7.
developers and found that active project developers are more diverse in terms of behavior. To study the social behavior patterns on GitHub, Yu et al. [5] built each developer’s follower network and found four patterns of social behavior from the network. Weicheng et al. [6] developed a commit analysis tool (CAT) for automatically analyzing the logs of commits, which applies visualization techniques to analyze the relationship between commit behavior and file evolution. Zhang et al. [7] defined user behavior vectors for each project, calculated the similarities of items by the cosine similarity, and analyzed the behaviors that have the most influence on the similarities of items. Moreover, Liao et al. [8] combined the LOF (Local Outlier Factor algorithm) algorithm and visualization techniques to analyze user behavior. B. VISUALIZATION IN GitHub
With the rapid growth of network data, visualization has become increasingly important in the analysis of big data. In the process of software development, GitHub provides the issue labeling system to help address issues. In the literature, [9]–[12] have focused on recommending the most suitable labels for software artifacts using visualization techniques and [13], [14] have studied the role of issue-tracking systems in software development. However, little attention has been paid to how issue labels are used, particularly with the aim of proposing useful visualization techniques for them. Izquierdo et al. [15] presented GiLA, which is a visual tool that generates a set of visualizations that facilitate the analysis of issues in a project depending on their label-based categorizations. Their visualizations were useful for viewing the most popular labels (and their relationships) in a project, identifying the most active community members for those labels and comparing the typical issue evolution for each label category.
II. RELATED WORK
In the past few years, with the development of GitHub, many studies have been conducted on analyzing issue reports, such as analyses of issue labels, issue management, issue quality and sentiment analysis using the information of issues. Our study mainly focuses on the characteristics of issue-related behaviors and the pattern of issue commits over time in popular projects. Our related work is mainly divided into three parts: User Behaviors, Visualization and Issue-Related Works in GitHub. A. USER BEHAVIORS IN GitHub
Research on user behavior has been a focus of research in various fields, including GitHub. In GitHub, many studies have been conducted on user behavior. Ben et al. [2] conducted a comprehensive analysis of a developer’s behavior and compared the developer’s work with the project’s overall work to help the manager evaluate the developer’s contribution. Heller et al. [3] used the geographic distribution of users to analyze the collaboration behavior among users. Onoue et al. [4] analyzed developers’ technical characteristics and the activity degree of user behavior to help classify 24004
C. ISSUE-RELATED WORKS IN GitHub
In recent years, many studies have been conducted on aspects of the analysis of issue reports, such as issue management, issue quality and sentiment analysis, using the information of issues. Kikas et al. [16] investigated the temporal dynamics of issues in GitHub based on a sample of 4000 projects and found that more issues are opened shortly after the creation of a project repository and that the number of pending issues increases inexorably due to forgotten (unclosed) issues. Then, Kikas et al. [17] analyzed issues from more than 4000 GitHub projects and built a model for predicting at different points in the lifetime of an issue, whether or not the issue will be closed within a given calendric period, by combining static, dynamic and contextual features. Their results showed that dynamic and contextual features complement the predictive power of static ones, particularly for long-term predictions. Jurado and Rodriguez [18] combined sentiment analysis with the analysis of issues. They proposed the introduction of sentiment analysis techniques for identifying and monitoring the underlying sentiments in texts that are written by developers in issues and tickets. VOLUME 6, 2018
Z. Liao et al.: Exploring the Characteristics of Issue-Related Behaviors in GitHub Using Visualization Techniques
FIGURE 1. Hierarchical structure graph of the TL-IV Analysis Model. There are two levels: the high level aims at analyzing the importance of issues in GitHub and the special level aims at mining the patterns of issue commits over time in popular projects in GitHub.
In addition, many interesting research results on issues have been obtained. Many works have discussed the importance of issue trackers in the context of software development [19]–[21]. Other studies have investigated user involvement in issue tracking based on issues that were reported in a few software projects [22]. A few other techniques, such as duplicate bug retrieval techniques [23], [24] and techniques for linking code changes with issue reports [25]–[27], have been proposed under assumptions regarding the prevalence of issues. Bissyande et al. [13] conducted a large-scale investigation of various topics that are related to issue trackers in GitHub, such as the adoption of issue trackers and tags in issue trackers. Jarczyk et al. [28] used the survival of issues as the metric of project quality. They selected 1, 2, 3, 7, 30, 100, and 365 days as the time metrics and performed PCA (Principal Components Analysis) on those time points, which revealed that just two components can explain 96% of the variance of the seven probabilities. Therefore, they applied these two components to analyze the quality of a project. III. OVERALL CONCEPT OF ISSUE PROCESSING
In this paper, we make some interesting observations about issues in GitHub. In section 1, we proposed three research questions. To answer these questions, we applied visualization techniques with data that were collected from GitHub and proposed a two-level issue visual analysis model, which is named the TL-IV Analysis Model. VOLUME 6, 2018
A. TL-IV ANALYSIS MODEL
In this paper, we proposed the TL-IV Analysis Model for the comprehensive study of issues. A hierarchical structure graph of the TL-IV Analysis Model is shown in Fig. 1. In the TL-IV Analysis Model, the first level, which we call the high level, aims at analyzing the importance of issues in GitHub and the second level, which we call the special level, aims at mining the patterns of issue commits over time in popular projects in GitHub. In our paper, we present our studies from two levels. In the high level, we propose the SRF measurement method, which is similar to the measurement method of random forest features’ importance, for measuring the importance of issuerelated behaviors. Then, we assess the importance of issues in GitHub and analyze the effectiveness of issue labeling in issue handling. Based on the results of the research in the high level, we can determine whether the research on issues of popular projects is meaningful or not. At the same time, the high-level research may provide a theoretical basis for our special-level research. In the special level, we assume that the time characteristics of issue commits have a specific relationship with the project life cycle and we apply visualization techniques and an SLDA Model to explore the time characteristics of issue commits in popular projects. B. DATA COLLECTION
GitHub makes data from public repositories available through public APIs. In this paper, we use data that are collected from 24005
Z. Liao et al.: Exploring the Characteristics of Issue-Related Behaviors in GitHub Using Visualization Techniques
TABLE 1. Basic description of the collected dataset.
the GitHub Archive and obtained by writing a python script that calls GitHub REST API. In this work, we select 7 popular projects as our research projects: Nodejs, JQuery, Bootstrap, Rails, D3.js, Three.js and Docker.
for calling GitHub REST API. We select 7 popular projects as our research projects, such as Node.js, JQuery.js, Bootstrap, Rails, and D3.js. A basic description of our collected data is shown as Table 1.
1) DATASET-I
In GitHub, each user behavior has an impact on the project development or other aspects and the role of each user behavior in the overall measurement is not the same. For example, during the process of project development, there is no doubt that Pull Request and Issue play more important roles than other user behaviors. However, there are other contributions to the project that are also very important. In this section, we propose the SRF measurement method, which is a method that is similar to the measurement method of random forest feature importance, for measuring the importance of user behavior and assessing the importance of issue-related behavior relative to all behaviors. We mainly measure the importance of a user behavior based on the frequency of the user behavior.
IV. ISSUE IMPORTANCE IN GITHUB
GitHub provides more than 20 event types, which range from new commits and fork events, to opening new tickets, commenting, and adding members to a project. These events are aggregated into hourly archives. GitHub Archive is a web site that uses GitHub APIs to periodically crawl GitHub event data and upload it to Google Big Query for research and analysis. In this work, we use dataset-I, which was collected by a third-party project in GitHub Archive. We obtain relevant descriptions of user-related behavior events from repository webhooks. We selected 15 types of behavior events that are highly relevant to users from webhooks for experimental analysis, including PullRequestEvent, IssueCommentEvent, FollowEvent, IssuesEvent, DeleteEvent, CreateEvent, PullRequestReviewCommentEvent, LabelEvent, ForkEvent, CommitCommentEvent, PullRequestReviewEvent and WatchEvent. In our research, these projects may have many developers, so we applied following filtering criteria to select a subset of developers. FC1: Developers must have the 15 kinds of behavior events that we selected. FC2: Events must have been created between January 2013 and January 2014. We limited our research period to this interval because the amount of event data is growing rapidly (these events are aggregated into hourly archives). FC3: If a developer has a certain event, the developer must have at least 100 such events. From the results, we selected 1400 developers for the research problem, which is the importance of developer behavior events in GitHub. 2) DATASET-II
To explore the patterns of issue commits, we must obtain specialized issue data for analysis. Although GitHub datasets are available, such as the GHTorrent and MSR datasets, they do not well meet the data requirements. To better meet the data requirements, a dataset is obtained by writing python script 24006
A. METHODOLOGY
In this section, we propose the SRF measurement method, which is based on the frequency of a user behavior, for measuring the importance of a user behavior. The method is divided into two main steps: First, we use the LOF algorithm, which is an algorithm of local anomaly detection based on the frequency of a user behavior, to calculate the anomaly degree of a user behavior in the project. Then, we apply our SRF measurement method to measure the importance of the user behavior. 1) USER LOCAL ANOMALY MEASUREMENT
In this section, we do not need to determine whether a particular user is abnormal or unusual. We need to analyze the impact of each user behavior on user anomalies. According to the change in user abnormality, we evaluate the importance of a user behavior. Therefore, we take a user as the unit for analyzing the anomaly degree of a user behavior and use the Local Outlier Factor algorithm to measure the anomaly degree of the user behavior. The algorithm is an unsupervised learning model and the method can calculate an outlier to facilitate our measurement of the importance of the user behavior. VOLUME 6, 2018
Z. Liao et al.: Exploring the Characteristics of Issue-Related Behaviors in GitHub Using Visualization Techniques
FIGURE 2. Procedures of the SRF measurement method. First, we need to calculate the LOF based on 15 types of user behavior events. Then, we remove a behavior event in each iteration (only remove one new behavior event from the 15 types of user behavior events) and recalculate the LOF’ based on the remaining 14 types of user behavior events. Finally, we obtain the importance value of each behavior by calculating the sum of the absolute difference between LOF and LOF’ based on this user behavior event.
Define p as a user; we obtain the user abnormality using the LOF algorithm. The definition of user behavior abnormality is shown as Equation (1). P P lrdk (o) o∈Nk (p) lrdk (p) o∈Nk (p) lrdk (o) = (1) LOFk (p) = |Nk (p)| |Nk (p)| lrdk (p) In Equation (1), Nk (p) is the set of the k-nearest neighbors of user p and lrdk (p) is the local reachability density, which can be calculated by Equation (2). ! P o∈Nk (p) reach_distk (p, o) lrdk (p) = 1/ (2) |Nk (p)| In Equation (2), reach_distk (p, o) is the distance that is used to define the reachability distance, which can be calculated by Equation (3). reach_distk (p, o) = max {k_dis tan ce(o), d(p, o)}
(3)
In Equation (3), d(p, o) represents the Euclidean distance between feature vectors p and o and k_dis tan ce(o) is the maximum distance of the feature vector o to its k-nearest neighbors. When we apply the LOF algorithm to measure the anomaly degree of a user behavior, the main problem is determining how to choose the value of k, which is the number of nearestneighbor nodes. In this paper, we choose a feature, namely, the frequency of the user behavior, and use the LOF algorithm VOLUME 6, 2018
to calculate the anomaly degree of the user behavior. Then, we use the calculated result and the result of visual analysis to adjust the value of k in the algorithm. 2) IMPORTANCE MEASUREMENT OF A USER BEHAVIOR
The measurement of the importance of a user behavior mainly aims at analyzing the importance of the user behavior in GitHub and determining the importance of the issue-related behavior in GitHub. In this section, we use the SRF measurement method based on the frequency of the user behavior to measure the importance of the user behavior. The procedures of the SRF measurement method are shown in detail in Fig. 2. The steps of SRF for the calculation of the importance of a user behavior X based on the frequency of the user behavior are described as follows: i. First, according to the user behavior events that we choose, we calculate the LOF of each user based on our dataset. ii. Then, we remove a user behavior event in each iteration (only remove one new behavior event from the 15 types of user behavior events) and calculate LOF’ based on the remaining 14 types of user behavior events. iii. Finally, we compare LOF’, which is calculated after removing a user behavior event, with LOF, which is calculated based on all user behavior events; calculate the absolute value of the difference between the two values; and sort the results. 24007
Z. Liao et al.: Exploring the Characteristics of Issue-Related Behaviors in GitHub Using Visualization Techniques
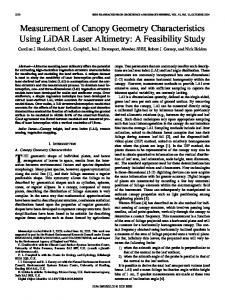
FIGURE 3. HeatMap of user behavior events’ importances in 7 popular projects. In the graph, the Y-axis represents the projects and the X-axis represents the top 8 user behavior events. The importance of each user behavior event is mapped to a color value.
TABLE 2. Average importance of each user behavior event based on user behavior frequency characteristics.
In the calculated results, we find the result that corresponds to user behavior X and determine the importance of behavior X. This result can be used as a measure of the corresponding behavior’s importance because if the calculated LOF value changes substantially after the removal of behavior X, the importance of this behavior is relatively high. B. RESULTS OF USER BEHAVIOR MEASUREMENT IN GitHub
In our study, to illustrate the meaning of an issue in a project, we first investigate the importance of user behavior in GitHub and the importance of issue-related user behaviors relative to all behaviors. We measure the importance of a behavior by using the SRF measurement method, which is based on the LOF algorithm. In this section, we choose seven popular projects as research projects and 15 types of behavior events from webhooks, which is used to measure user abnormality. The user behavior events are shown in Table 2. Each 24008
behavior event represents a series of operations on the corresponding object. For example, IssuesEvent is triggered when an issue is assigned, unassigned, labeled, unlabeled, opened, edited, milestoned, demilestoned, closed, or reopened. PullRequestEvent is triggered when a pull request is assigned, unassigned, labeled, unlabeled, opened, edited, closed, reopened, or synchronized. The measurement result of each user behavior event based on the frequency of the user behavior is shown in Table 2. In Table 2, we present the average importance of each user behavior event based on these seven projects. Fig. 3 shows the importances of the top 8 user behavior events (these events are selected from the sorted importance results in Table 2) in 7 popular projects. In Fig. 3, we use a heatmap to describe the importances of user behavior events, where the color depth corresponds to the importance value. According to Fig. 3, the user’s contribution behaviors generally have high importance degrees in these seven projects. The importances of IssueCommentEvent and PullRequestEvent are relatively high among all events. Although there are variations in some cases, the importances of these two behavior events are relatively stable and high. In this paper, we group user behaviors according to the characteristics of user behavior events. For example, we group ForkEvent and PushEvent, which are user behavior events that copy and contribute to the project; FollowEvent and WatchEvent, which are social behavior events; and IssueCommentEvent, CommitCommentEvent and IssuesEvent, which constitute a series of actions that are related to issues. In Fig. 4, a user behavior event grouping TreeMap is shown and the importances of the user behavior events are visually encoded by the rectangular area. For example, from Fig. 4, the IssueCommentEvent event is of the highest importance in the issue group and the PullRequestEvent is the most important in the group that is related to the Pull Request. Moreover, in the project’s copying and contribution groups, the user’s PushEvent is more important than ForkEvent, which indicates that the user’s contribution behaviors are generally important in the process of project development. VOLUME 6, 2018
Z. Liao et al.: Exploring the Characteristics of Issue-Related Behaviors in GitHub Using Visualization Techniques
FIGURE 4. Event TreeMap: Group of behavior events based on behavior importance and behavior characteristics. In the graph, the area of each rectangle represents the importance of the corresponding user behavior event.
Result 1: In GitHub, user behaviors that are related to issues are of high importance relative to all user behaviors, which indicates that issues play a very important role in project development.
In summary, we have specified the metric of GitHub project quality, which is based on the time that is needed to respond to the issues. The metric is based on two factors: the time in which the user may expect a response and the likelihood that his or her issue will be eventually resolved.
V. EFFECTIVENESS OF ISSUE LABELING
Is issue labeling effective for issue handling? In GitHub, the issue tracker allows software developers to create and assign labels to issues with the aim of helping the project community better classify and manage those issues (such as by facilitating the identification of issues for top-priority components or candidate developers that could solve them). In this section, we investigate the effectiveness of issue labeling for issue handling by comparing the processing efficiency between issues with labels and issues without labels and utilize sociological theory to analyze the result. A. TIME METRICS
For the research on issues, in our case study, we selected 3 days and 365 days as the time metrics for investigating the processing efficiency of issues. Jarczyk et al. [28] performed PCA on the survival probabilities for issues after 1, 2, 3, 7, 30, 100 and 365 days, which revealed that just two components explain 96% of the variance of the seven probabilities. The first component, namely, the survival probabilities for issues after 3 days, describes (roughly) the average percentages of bugs that are closed after different amounts of time, and the second component, namely, the survival probabilities for issues after 365 days, describes the probabilities of issues that are closed rapidly (in a matter of days). We hope to apply 3 days as a time metric to evaluate the issue processing ability in a short time under the issue labeling system, and 365 days as a time metric to evaluate the final processing efficiency of the issues. VOLUME 6, 2018
B. RESULT ON ISSUE LABELING EFFECTIVENESS
We analyze the effectiveness of issue labeling based on six popular projects: Bootstrap, D3.js, JQuery, Rails, node.js and Three.js. The results of comparing the processing efficiencies between issues that have labels and issues that do not have labels are shown in Fig. 5. First, we conclude that the use frequency of labels in popular projects is approximately 50%. Then, in Fig. 5, we present a comparative analysis between issues with labels and issues without labels, which shows the processing efficiencies of issues within 3 days and 365 days. According to the graph, there are multiple projects, such as JQuery and Rails, in which issues with labels have higher issue processing efficiency than issues without labels. However, many issues with labels could not be closed rapidly in GitHub. To determine the source of this problem, we apply sociological theory. Topic Relevance: A developer may not have detailed information on a project before he or she commits issues to this project; thus, there is a degree of randomness when he or she creates or assigns label to issues. Labels could be used to help the project community better classify and manage those issues (such as by facilitating the identification of issues for top-priority components or candidate developers that could solve them). However, if an issue label does not match the issue theme and the issue was assigned to a candidate developer according to the issue label, the developer many find that he or she is unable to resolve the issue. Thus, the issue may not be closed. 24009
Z. Liao et al.: Exploring the Characteristics of Issue-Related Behaviors in GitHub Using Visualization Techniques
FIGURE 5. Radar of issue-handling efficiency: a comparison of processing efficiencies between issues with labels and issues without labels. The left plot shows the processing efficiency for an issue at 3 days and right plot shows the processing efficiency for the same issue at 365 days.
In any case, according to the graph, the processing efficiencies of the issues with labels are still extremely high. There may be some issues whose labels do not match the actual contents of the issue; these issues may not be closed rapidly. Result 2: Labeling has a positive impact on the processing of issues, but using the correct issue label is more important. VI. TIME CHARACTERISTICS OF ISSUE COMMITS
In the TL-IV Analysis model, we analyze each issue’s impact on the popularity of each project and the effectiveness of the issue label on issue handling in the high level. According to the results, we find that the research on the issues of the popular projects is meaningful and the results provide a theoretical basis for our special-level research. In this section, we propose a visualization method that combines Stacked Flow Visualization and Sunburst Visualization, which is named Co-SFS, for exploring the time characteristics of issue commits based on popular projects in GitHub. A. METHODOLOGY 1) CO-SFS VISUALIZATION
In GitHub, each project usually begins as a demo or an idea; this indicates that almost all projects undergo a process from foundation to perfection in GitHub, which is similar to the project life cycle. In this paper, we propose a visualization method, namely, Co-SFS. In Co-SFS Visualization, Stacked Flow Visualization, which shows the variances of opened issues and closed issues from left to right as functions of time, is used to study the time distribution of issues. Then, we apply Sunburst Visualization to obtain the detailed monthly distributions of issues. For popular projects, we visualize the popular projects’ issue commits using Stacked Flow Visualization and Sunburst Visualization. Then, we compile the entire stacked flow graph to observe the similarity or consistency between them. 24010
2) SLDA MODEL
In this section, when we investigate the time characteristics of issue commits, we must consider the distribution of topics over time. We use a semi-supervised LDA-based approach to automatically classify issues. According to the results of section 5, the issue label has a positive impact on issue handling. Thus, we apply the issue label samples to build the semi-supervised LDA model. The LDA [29] model is an unsupervised model. It has been shown that the approach that is based on LDA performs poorly for various classification tasks [30] in GitHub, such as classification of the implicit topics and of naturallanguage texts and training messages. Therefore, we use domain knowledge of issues, together with issue topics, to train the supervised topic model by LDA (SLDA). Then, we obtain the supervised topics with labels, as shown in Fig. 6. According to these topics, we can calculate the distribution of issue topics over time more easily and efficiency. Using the SLDA model, we can obtain the supervised topics. This phase consists of two main parts, which are described as follows:
a: DATA PRE-PROCESSING
The datasets are extracted from eight open-source projects that are hosted on GitHub; their titles and descriptions are presented in Table 3. There are many types of noise in the issue, such as bad punctuation and HTML links. The process is divided into six main steps: (1) Convert the text words to lowercase. (2) Remove HTML tags and bad punctuation from each document. (3) Remove stop-words, such as ‘‘a’’, ‘‘the’’, ‘‘is’’ and ‘‘that’’, from documents since they carry less meaning. (4) Tokenize and split the documents into a set of terms. (5) Perform stemming using an algorithm that is based on the Porter Stemming algorithm. (6) Correct spelling VOLUME 6, 2018
Z. Liao et al.: Exploring the Characteristics of Issue-Related Behaviors in GitHub Using Visualization Techniques
FIGURE 6. Supervised topic generation after SLDA.
TABLE 3. Example issue before data pre-processing.
TABLE 4. Example issue after data pre-processing.
errors via the spelling correction algorithm, which is based on weighted contexts [31]. Table 4 displays the word set with labels after data preprocessing. Note that all the words are meaningful. b: SUPERVISED TOPIC GENERATION AFTER SLDA
To generate the supervised topics, we first extract the issues with at least one label from each project. Then, we use LDA to generate a topic vector from the above dataset. Finally, we combine the label with each topic. In the SLDA model, the number of topics (K) is not fixed. Therefore, we try to determine the most appropriate value of K experimentally. B. RESULT OF TIME CHARACTERISTICS
According to our previous research, which is presented in section 4, there is a relationship between issues and the popularity of projects; therefore, we explore the time characteristics of issue commits in popular projects based on our previous works. We select 8 projects as the research projects, such as Three.js, Rails, JQuery, Bootstrap, and Docker, which are extremely popular in GitHub. The results of Co-SFS visualization are shown in Fig. 7. In Fig. 7, the Sacked Flow Visualization presents the variance of issue commits over time. According to the Stacked Flow Visualization, many issues that have not been closed are concentrated in the recent VOLUME 6, 2018
time, and only a few untreated issues are left over from an earlier stage of the project. Result 3: In the popular projects on GitHub, almost all issues ultimately could be solved and the only remaining unhandled issues were created in the recent past. Furthermore, the processing rate of the issues was close to 90%. In Fig. 7, from the stacked flow graphs of these projects, we find that there are three common time periods, which show different characteristics. As is well known, the life cycle of a project has four periods: requirement elicitation, detailed design, major development and project maintenance. We assume that there is a correspondence relationship between the phases that we found from the graphs and the life cycle of the project. To determine the correspondence relationship of the three phases with the activities of the project life cycle, we exploit the use frequency of the issue labels at each phase of the project to analyze the distribution of topics or main work at each phase. From the topic of the time phase, we examine whether there is a correspondence relationship between the three stages and the project life cycle. In section 5, we have analyzed the effectiveness of issue labeling and concluded that labeling has a positive impact on the processing of issues. In this section, we choose projects JQuery and Three.js as the 24011
Z. Liao et al.: Exploring the Characteristics of Issue-Related Behaviors in GitHub Using Visualization Techniques
FIGURE 7. Co-SFS Graph: Stacked Flow Graph and Sunburst Graph of issue commits of Three.js, Rails, Docker and JQuery. The top plot, which is the Stacked Flow Graph, shows the commits of issues over time, while the bottom plot, which is the Sunburst Graph, shows the magnitude distribution of issues per month.(a)Three.js. (b)jQuery.
analysis objects, in which the issue labels are used with high frequency (over 50%). We choose the SLDA model, which has been described in section VI.A, to automatically classify issues and obtain the topics of issues. Before checking the main topics of these three phases, we must partition the explicit time intervals. From Fig. 7, we used the Sunburst visualization to observe the detailed distribution of issue commits. We obtained three explicit observation time intervals via combining the Stacked Flow graph and Sunburst Visualization. 24012
The results of the topic distribution are shown in Fig. 8. We apply word-cloud visualization to present the frequencies of labels, which represent the topics of issues. According to the graph, ‘‘Feature Request’’ is the most frequent label in the first period, with a frequency of up to 56% in the first time period. In GitHub, users enhance the software via feature requests; therefore, in theory, the first period is similar to requirement elicitation in the project life cycle. In the third period, the labels show high frequency for information on versions, bugs and techniques, such as ‘‘Bug’’, ‘‘V3’’, ‘‘V4’’, VOLUME 6, 2018
Z. Liao et al.: Exploring the Characteristics of Issue-Related Behaviors in GitHub Using Visualization Techniques
FIGURE 8. Issue-topic frequencies in three phases on Three.js and JQuery. In the graph, the size of a word represents the frequency of the corresponding issue-topic.
‘‘CSS’’, and ’’JS’’. From our statistics, the frequency of technical terms (such as ‘‘JS’’, ‘‘CSS’’, and ‘‘AJAX’’), bugs, and version information reaches 89% in the third time period. In the third period, many users have increased numbers of questions about the new version and, with the release of the new version, many problems will emerge; thus, the version is continually updated and, in theory, the third period is similar to software maintenance in the project life cycle. In addition, from Fig. 7, the number of issue commits remains at a low level in the second period, and the frequency of its top keeps the average situation; therefore, we can link this phase to detailed design and development in the project life cycle. In summary, the results approximately correspond to definitions or assumptions. From the result, we build a three-segment model of the process of open-source software development. Then, we define three phases and describe the corresponding characteristics of these three time periods. 1) PREPARATION PERIOD OF THE PROJECT
The project is hosted on GitHub. In this period, many users are affected by the team’s developer, who is an influential developer, and increasing numbers of users commit issues to the project. Therefore, there might be a small peak in issue commits in this phase. This phase mainly corresponds to VOLUME 6, 2018
the process of obtaining the requirements in the project life cycle. 2) EXECUTION PERIOD OF THE PROJECT
The developers begin to design and confirm development tasks based on the previous feature request. In this phase, the commits of issues maintain a relatively stable state. This phase mainly corresponds to the detailed design and development of the project life cycle. 3) MAINTENANCE PERIOD OF THE PROJECT
The project is almost completed. After the release of the new version, many developers may fork the project and the issues are mainly associated with version or techniques. In this phase, the commits of issues maintain a continuous, higher state. This phase mainly corresponds to project maintenance in the project life cycle. Result 4: In the popular projects on GitHub, the distribution of issue commits over time follows a three-period development model, which corresponds to the project life cycle. VII. CONCLUSIONS
Software management plays an important role in software development. If more efforts on software management are made in a software project, the success rate of the software will be greatly improved. In this paper, we investigate the 24013
Z. Liao et al.: Exploring the Characteristics of Issue-Related Behaviors in GitHub Using Visualization Techniques
characteristics of issues and find some issue features facilitate efficient software management. In this paper, we have proposed multiple research questions on issues in GitHub. To answer these questions, we have combined real data and visual analysis techniques to propose the TL-IV Analysis Model and Co-SFS Visualization. For the measurement of an issue’s importance, we propose SRF for measuring the importance of user behaviors. From the results, we found that issue-related user behaviors are of high importance, which also reflects that issues play a very important role in project development. In addition, we found that not all issues that are assigned labels could be closed rapidly. To investigate the characteristics of issue commits, we proposed Co-SFS Visualization. From the results of visualization, we found that there is an association between issue commits and the lifetime of a project. Therefore, we applied the SLDA model to obtain the topic distribution, and then assess the correspondence of the topics of them. According to our experimental results, we built a three-segment model and defined three phases, which correspond to the four periods of the project’s lifetime. These results may provide new knowledge about issues and help managers manage and allocate project resources more effectively, thereby eventually reducing software failures. In future research, we plan to analyze the contents of issues to verify our three phases, which were checked by semisupervised LDA based on issue labels in this paper. In addition, we would like to determine whether the conclusion is similar for ordinal projects. REFERENCES [1] A. Begel, J. Bosch, and M.-A. Storey, ‘‘Social networking meets software development: Perspectives from GitHub, msdn, stack exchange, and topcoder,’’ IEEE Softw., vol. 30, no. 1, pp. 52–66, Jan. 2013. [2] X. Ben, S. Beijun, and Y. Weicheng, ‘‘Mining developer contribution in open source software using visualization techniques,’’ in Proc. 3rd Int. Conf. Intell. Syst. Design Eng. Appl. (ISDEA), Jan. 2013, pp. 934–937. [3] B. Heller, E. Marschner, E. Rosenfeld, and J. Heer, ‘‘Visualizing collaboration and influence in the open-source software community,’’ in Proc. Mining Softw. Repositories, May 2011, pp. 223–226. [4] S. Onoue, H. Hata, and K.-I. Matsumoto, ‘‘A study of the characteristics of developers’ activities in GitHub,’’ in Proc. APSEC, Dec. 2013, pp. 7–12. [5] Y. Yu, G. Yin, H. Wang, and T. Wang, ‘‘Exploring the patterns of social behavior in GitHub,’’ in Proc. 1st Int. Workshop Crowd-Based Softw. Develop. Methods Technol. (CrowdSoft), Hong Kong, Nov. 2014, pp. 31–36. [6] Y. Weicheng, S. Beijun, and X. Ben, ‘‘Mining GitHub: Why commit stops– exploring the relationship between developer’s commit pattern and file version evolution,’’ in Proc. APSEC, Dec. 2013, pp. 165–169. [7] L. Zhang, Y. Zou, B. Xie, and Z. Zhu, ‘‘Recommending relevant projects via user behaviour: An exploratory study on GitHub,’’ in Proc. CrowdSoft, 2014, pp. 25–30. [8] Z. Liao et al., ‘‘A visual analytics approach for detecting and understanding anomalous resident behaviors in smart healthcare,’’ Appl. Sci., vol. 7, p. 254, Mar. 2017, doi: 10.3390/app7030254.(SCI). [9] J. M. Al-Kofahi, A. Tamrawi, T. T. Nguyen, H. A. Nguyen, and T. N. Nguyen, ‘‘Fuzzy set approach for automatic tagging in evolving software,’’ in Proc. ICSM Conf., Sep. 2010, pp. 1–10. [10] X. Xia, D. Lo, X. Wang, and B. Zhou, ‘‘Tag recommendation in software information sites,’’ in Proc. MSR Conf., May 2013, pp. 287–296. [11] Z. Liao, M. Liu, T. Song, L. Kuang, Y. Zhang, and Z. Liao, ‘‘Markov Chainlike model for prediction service based on improved hierarchical particle swarm optimization cluster algorithm,’’ Int. J. Softw. Eng. Knowl. Eng., vol. 26, no. 4, pp. 653–674, 2016. 24014
[12] S. Wang, D. Lo, B. Vasilescu, and A. Serebrenik, ‘‘EnTagRec: An enhanced tag recommendation system for software information sites,’’ in Proc. ICSM Conf., Sep. 2014, pp. 291–300. [13] T. F. Bissyande, D. Lo, L. Jiang, L. Reveillere, J. Klein, and Y. Le Traon, ‘‘Got issues? Who cares about it? A large scale investigation of issue trackers from GitHub,’’ in Proc. IEEE 24th Int. Symp. Softw. Rel. Eng. (ISSRE), Nov. 2014, pp. 188–197. [14] D. Posnett, A. Hindle, and P. Devanbu, ‘‘Got issues? Do new features and code improvements affect defects?’’ in Proc. CSMR Conf., Oct. 2011, pp. 211–215. [15] J. L. C. Izquierdo, V. Cosentino, B. Rolandi, A. Bergel, and J. Cabot, ‘‘GiLA: GitHub label analyzer,’’ in Proc. IEEE Int. Conf. Softw. Anal., Mar. 2015, pp. 479–483. [16] R. Kikas, M. Dumas, D. Pfahl, ‘‘Issue dynamics in GitHub projects,’’ in Product-Focused Software Process Improvement. Springer, 2015, pp. 295–310. [17] R. Kikas, M. Dumas, and D. Pfahl, ‘‘Using dynamic and contextual features to predict issue lifetime in GitHub projects,’’ in Proc. Int. Workshop, 2016, pp. 291–302. [18] F. Jurado and P. Rodriguez, ‘‘Sentiment analysis in monitoring software development processes: An exploratory case study on GitHub’s project issues,’’ J. Syst. Softw., vol. 104, pp. 82–89, Jun. 2015. [19] A. J. Ko and P. K. Chilana, ‘‘How power users help and hinder open bug reporting,’’ in Proc. CHI, 2010, pp. 1665–1674. [20] V. Singh, M. Twidale, and D. Nichols, ‘‘Users of open source software-how do they get help?’’ in Proc. HICSS, Jan. 2009, pp. 1–10. [21] D. W. van Liere, ‘‘How shallow is a bug? Why open source communities shorten the repair time of software defects,’’ in Proc. ICIS, Jan. 2009, p. 195. [22] L. Grammel, H. Schackmann, A. Schröter, C. Treude, and M.-A. Storey, ‘‘Attracting the community’s many eyes: An exploration of user involvement in issue tracking,’’ in Proc. HAoSe, 2010, pp. 3:1–3:6. [23] C. Sun, D. Lo, S.-C. Khoo, and J. Jiang, ‘‘Towards more accurate retrieval of duplicate bug reports,’’ in Proc. ASE, Nov. 2011, pp. 253–262. [24] C. Sun, D. Lo, X. Wang, J. Jiang, and S.-C. Khoo, ‘‘A discriminative model approach for accurate duplicate bug report retrieval,’’ in Proc. ICSE, vol. 1. 2010, pp. 45–54. [25] C. Bird, A. Bachmann, F. Rahman, and A. Bernstein, ‘‘Linkster: Enabling efficient manual inspection and annotation of mined data,’’ in Proc. FSE, 2010, pp. 360–370. [26] L. Kuang et al., ‘‘An improved privacy-preserving framework for location-based services based on double cloaking regions with supplementary information constraints,’’ Secur. Commun. Netw., vol. 2017, Nov. 2017, Art. no. 7495974. [Online]. Available: https://doi.org/10.1155/ 2017/7495974 [27] R. Wu, H. Zhang, S. Kim, and S.-C. Cheung, ‘‘Relink: Recovering links between bugs and changes,’’ in Proc. FSE, 2011, pp. 15–25. [28] O. Jarczyk, B. Gruszka, S. Jaroszewicz, L. Bukowski, and A. Wierzbicki, ‘‘GitHub projects. Quality analysis of open-source software,’’ in Social Informatics. 2014, pp. 80–94. [29] D. M. Blei, A. Y. Ng, and M. I. Jordan, ‘‘Latent Dirichlet allocation,’’ J. Mach. Learn. Res., vol. 3, pp. 993–1022, Jan. 2003. [30] J. C. Maxwell, A Treatise on Electricity and Magnetism, vol. 2, 3rd ed. Oxford, U.K.: Clarendon, 1892, pp. 68–73. [31] Y. Fu, M. Yan, X. Zhang, L. Xu, D. Yang, and J. D. Kymer, ‘‘Automated classification of software change messages by semi-supervised Latent Dirichlet allocation,’’ Inf. Softw. Technol., vol. 57, pp. 364–367, Jan. 2015. [32] L. Dey and S. M. Haque, ‘‘Opinion mining from noisy text data,’’ Int. J. Document Anal. Recognit., vol. 12, no. 3, pp. 205–226, 2009.
ZHIFANG LIAO was born in Changsha, Hunan, China in 1968. She received the B.S. degree in industry control engineering and the M.S. degree in computer science from the Changsha Railway Institute in 1990 and 1998, respectively, and the Ph.D. degree in computer technology and application from Central South University in 2008. From 1990 to 1997, she was an Engineer with Hunan Computer Factory. Since 1997, she has been a Lecturer/Associate Professor with Central South University. Her research interests include open source software, open source software ecosystem, data mining, and so on. VOLUME 6, 2018
Z. Liao et al.: Exploring the Characteristics of Issue-Related Behaviors in GitHub Using Visualization Techniques
DAYU HE received the B.E. degree in software engineering from Central South University, China, in 2015, where he is currently pursuing the master’s degree in software engineering. His main research interests include data visualization, data mining, and the analysis of user behavior in open source community.
ZHIJIE CHEN received the M.S. degree from Beijing Jiaotong University, China, in 2008. He is currently pursuing the Ph.D. degree with the School of Information Science and Engineering, Central South University, China. He is also with the China Railway Signal & Communication Corporation Ltd. His research interests include open source software and open source software social network.
XIAOPING FAN was born in Nancheng, Jiangxi, China, in 1961. He received the B.S. degree in electrical engineering from the Jiangxi University of Technology (Nanchang University), Nanchang, in 1981, the M.S. degree in traffic information engineering and control from Central South University, Changsha, in 1984, and the Ph.D. degree in control science and engineering from the South China University of Technology, Guangzhou, and The Hong Kong Polytechnic University, Hong Kong in 1998. He was an Assistant Professor with the School of Information Engineering, Central South University, from 1984 to 1994, and an Associate Professor from 1994 to 1999. From 1999 to 2010, he was a Professor with the School of Information Science and Engineering, Central South University. Since 2010, he has been a Professor with the Laboratory of Networked Systems, Hunan University of Finance and Economics. He is the author of two books, over 300 journal and conference papers, and 15 inventions. His research interests include wireless sensor networks, big data, data mining, intelligent transportation systems, and so on. He is an Associate Editor of the Journal of Systems Engineering.
VOLUME 6, 2018
YAN ZHANG was born in Hunan, China, in 1975. She received the M.Sc. degree in computer science from Central South University, China, in 2000, and the Ph.D. degree in computing science from Middlesex University, U.K., in 2007. She was a Research Assistant with the University of Hull and the University of Manchester from 2007 to 2013 and from 2013 to 2015, respectively. Since 2015, she has been a Lecturer with the Department of Computer, Communication and Interactive System, Glasgow Caledonian University. Her current research interests include big data analytics, streaming data, cloud computing, and bioinformatics.
SHENGZONG LIU was born in Hunan, China, in 1986. He received the B.S. degree in computer science and technology and the Ph.D. degree in computer application technology from Central South University, Changsha, China, in 2008 and 2014, respectively. Since 2014, he has been a Lecturer with the Information Technology and Management School, Hunan University of Finance and Economics, Changsha. His research interests include recommendation system, machine learning, and big data.
24015