J Neurophysiol 112: 1470 –1476, 2014. First published June 18, 2014; doi:10.1152/jn.00074.2014.
Exploring the specific time course of interhemispheric inhibition between the human primary sensory cortices Sonia M. Brodie,1 Anica Villamayor,1 Michael R. Borich,1 and Lara A. Boyd1,2 1
Department of Physical Therapy, Faculty of Medicine, University of British Columbia, Vancouver, British Columbia, Canada; and 2Centre for Brain Health, University of British Columbia, Vancouver, British Columbia, Canada Submitted 23 January 2014; accepted in final form 6 June 2014
Brodie SM, Villamayor A, Borich MR, Boyd LA. Exploring the specific time course of interhemispheric inhibition between the human primary sensory cortices. J Neurophysiol 112: 1470 –1476, 2014. First published June 18, 2014; doi:10.1152/jn.00074.2014.—The neurophysiological mechanism of interhemispheric inhibition (IHI) between the human primary sensory cortices (S1s) is poorly understood. Here we used a paired median nerve somatosensory evoked potential protocol to observe S1-S1 IHI from the dominant to the nondominant hemisphere with electroencephalography. In 10 healthy, right-handed individuals, we compared mean peak-to-peak amplitudes of five somatosensory evoked potential components (P14/N20, N20/P25, P25/N30, N30/P40, and P40/N60) recorded over the right S1 after synchronous versus asynchronous stimulation of the right and left median nerves. Asynchronous conditioning ⫹ test stimuli (CS⫹TS) were delivered at interstimulus intervals of 15, 20, 25, 30, and 35 ms. We found that, in relation to synchronous stimulation, when a CS to the left S1 preceded a TS to the right S1 at the short intervals (15 and 20 ms) the amplitude of the cortical N20/P25 complex was significantly depressed, whereas at the longer intervals (25, 30, and 35 ms) significant inhibition was observed for the thalamocortical P14/N20 as well as the cortical N20/P25 components. We conclude that the magnitude of S1 IHI appears to depend on the temporal asynchrony of bilateral inputs and the specific timing is likely reflective of a direct transcallosal mechanism. Employing a method that enables direct S1 IHI to be reliably quantified may provide a novel tool to assess potential IHI imbalances in individuals with neurological damage, such as stroke. interhemispheric inhibition; transcallosal inhibition; primary sensory cortex; sensory evoked potentials; electroencephalography
skilled, coordinated movements relies on dynamic interactions between the two hemispheres of the brain. For example, in the motor system it is well known that the activation of one hemisphere during a simple task results in decreased activation of the other hemisphere (Duque et al. 2007). This reciprocal interhemispheric inhibition (IHI) is increased during one-handed movements and is thought to prevent unwanted mirror movements of the opposite hand. Alternatively, during tasks that require the movement of both hands simultaneously IHI is decreased (Nelson et al. 2009). The mechanisms underpinning IHI in the motor system have been thoroughly investigated (Butefisch et al. 2008; Daskalakis et al. 2002a; De Gennaro et al. 2003; Duque et al. 2005; Ferbert et al. 1992; Fling et al. 2013; Garvey et al. 2001). Homologous areas of the primary motor cortices (M1s) of each hemisphere are connected by a distinct segment of the corpus callosum
THE ABILITY TO PRODUCE
Address for reprint requests and other correspondence: L. A. Boyd, Univ. of British Columbia, Dept. of Physical Therapy, 212-2177 Wesbrook Mall, Vancouver, BC V6T 1Z3, Canada (e-mail:
[email protected]). 1470
(Fling et al. 2013). Activation of M1 in one hemisphere sends an excitatory signal transcallosally that excites inhibitory interneurons in the contralateral M1, decreasing its net excitatory output (Daskalakis et al. 2002b). Outside of M1, a similar transcallosal IHI has also recently been reported between the dorsolateral prefrontal cortices of each hemisphere (Voineskos et al. 2010). The somatosensory system is tightly linked to the motor system and is also critical for coordinated movement. However, the mechanism of IHI between sensory cortices is not as well understood. In humans, postmortem anatomical analyses (Aboitiz 1992) and in vivo magnetic resonance diffusion weighted imaging (Fling et al. 2013) have described a distinct section of the corpus callosum connecting primary sensory cortices (S1s), and an accumulating body of evidence suggests that, similar to the motor system, activation of S1 in one hemisphere can modulate the activity of S1 in the contralateral hemisphere (Blankenburg et al. 2008; Clarey et al. 1996; Eickhoff et al. 2008; Hlushchuk and Hari 2006; Kastrup et al. 2008; Klingner et al. 2011; Lipton et al. 2006; Meehan et al. 2011). Despite the evidence that somatosensory IHI may occur, few studies have examined the precise neurophysiological mechanisms involved. Furthermore, the results from studies of somatosensory IHI have been divergent (Hoechstetter et al. 2001; Jung et al. 2012; Ragert et al. 2011; Reed et al. 2011), most likely because of methodological variation. Thus to date, it remains controversial whether IHI between S1s is transmitted directly via the corpus callosum (similar to IHI between M1s), indirectly via intrahemispheric secondary cortical or subcortical regions, or alternatively as some combination of pathways. Ragert and colleagues (2011) used electroencephalography (EEG) to examine the time course of interhemispheric interactions between the S1s in humans. Using a paired median nerve somatosensory evoked potential (PMNSEP) protocol, the authors showed that the amplitude of the N20 potential, the earliest component of the cortical sensory evoked potential (SEP), recorded over the left S1 was depressed when a conditioning stimulus (CS) was applied to the left median nerve (MN) 20 –25 ms before a test stimulus (TS) to the right MN (Ragert et al. 2011). The authors concluded that this was direct evidence for transcallosal IHI in the human somatosensory system (Ragert et al. 2011). The suggestion that the two S1s may be directly linked is intriguing and warrants further investigation. Developing a method by which direct S1 IHI may be reliably quantified may provide a novel tool to assess potential IHI imbalances in individuals with neurological damage, such as stroke. That is,
0022-3077/14 Copyright © 2014 the American Physiological Society
www.jn.org
INTERHEMISPHERIC INHIBITION BETWEEN PRIMARY SENSORY CORTICES
similar to the motor system, S1-S1 IHI imbalances could be predictive of sensorimotor impairment. Thus the present study aimed to determine the robustness of S1-S1 IHI by extending the PMNSEP paradigm described by Ragert and colleagues (2011). Specifically, we reversed the presentation of the CS and TS to target the right rather than the left S1. In addition, we compared asynchronous stimulation to synchronous, bimanual stimulation rather than unimanual stimulation. Given the reports of transcallosal fibers connecting homologous regions of S1 in each hemisphere (Aboitiz et al. 1992; Fling et al. 2013) and the well-recognized importance of interhemispheric coordination for the production of skilled sensorimotor behaviors, we hypothesized that a direct S1-S1 transcallosal inhibitory influence would persistently be observed. METHODS
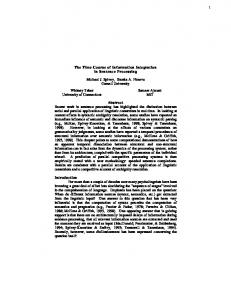
Experimental procedure. Ten healthy adults (mean age ⫾ SD ⫽ 28.3 ⫾ 5.4 yr; 5 women, 5 men) were recruited. All participants were right-handed according to an adapted version of the Edinburgh inventory for the assessment of handedness (Cohen 2008; Oldfield 1971) [augmented laterality index: mean ⫾ SD ⫽ 83.33 ⫾ 17.21, over a range of ⫺100 (fully left-handed) to ⫹100 (fully right-handed)]. The research ethics board of the University of British Columbia approved all procedures. Written informed consent was obtained from all participants according to the Declaration of Helsinki. The PMNSEP paradigm was adapted from that described by Ragert et al. (2011). Briefly, a CS was delivered to the right MN, followed by a TS to the left MN, in a series of different interstimulus intervals (ISIs) (Fig. 1). ISIs of 15, 20, 25, 30, and 35 ms were tested. In addition, a synchronous 0 ms ISI condition (i.e., the 2 MNs being stimulated at exactly the same time) was collected to be used as a baseline condition. This was included as it is well known that differences in directed attention can alter sensory processing and SEP amplitudes (Garcia-Larrea et al. 1991). Therefore, the 0 ms condition served as a more appropriate baseline for comparison, as it divided attention between the two hands. Paired median nerve somatosensory evoked potential paradigm. Participants were seated comfortably upright in a chair, with arms
Right S1 (non-dominant)
Left S1 (dominant)
CP4 (target) CS Right MN
TS Left MN
1mV
Fig. 1. The paired median nerve somatosensory evoked potential (PMNSEP) paradigm. A conditioning stimulus (CS) was delivered to the right median nerve (MN) followed by a test stimulus (TS) to the left MN at various interstimulus intervals. MN stimulation was adjusted online to maintain a 1-mV peak-to-peak muscle twitch potential, recorded from the abductor pollicis brevis (APB) muscle of each hand. Sensory evoked potentials (SEPs) were recorded from channel CP4, overlying the primary sensory cortex (S1) in the right hemisphere. Interhemispheric inhibition occurs from the left (dominant) hemisphere to the right (nondominant) hemisphere.
1471
resting in a supinated position on a pillow in their lap, and were instructed to remain relaxed with their eyes closed during stimulation. Surface electromyography (EMG) was recorded from the abductor pollicis brevis (APB) muscle of each hand. Standard bar electrodes were placed over the MN on the inside of the wrist, aligned with the wrist crease, with the cathode proximal. Electrical pulses were triggered with LabChart7 software (ADInstruments) via a PowerLab 8/35 data acquisition system (PL3508, ADInstruments) and were delivered to participants with two constant-current stimulators (DS7 and DS7AH, Digitimer, Welwyn Garden City, UK). Stimulation was delivered at 2 Hz, with a square-wave, monophasic pulse width of 0.1 ms. Precise MN localization was based on individual reports of a tingling sensation in the MN distribution, including the thumb, index, and middle finger. The intensity of stimulation was then increased to produce a muscle twitch in the APB of ⬃1 mV peak to peak (mean ⫾ SD ⫽ 962.066 ⫾ 202.326 mV for right hand, 1,085.270 ⫾ 216.274 mV for left hand). EMG activity was visually monitored online throughout the experiment, and small adjustments in stimulation intensities (⫾1–2 mA) were made when necessary to maintain consistent muscle twitch amplitudes. Participants were asked to report any discomfort or fatigue throughout the experimental session. SEPs were recorded with a direct current full-band EEG system (NEURO PRAX EEG, NeuroConn, Ilmenau, Germany) from 29 electrode locations across the sensorimotor areas of both cortices, labeled according to the International 10-20 System. An electrode placed on the right mastoid (channel TP10) was used as a reference during online recording, and the ground electrode was located on the skull, 1 cm posterior and 1 cm lateral to the head centroid (Cz). The skin-electrode impedance was kept below 5⍀. EEG data were acquired with an online notch filter (60 Hz) and digitized at a sampling rate of 1,000 Hz. Three hundred epochs of 300 ms (100 ms baseline and 200 ms after TS delivery) were recorded for each condition (TS alone, CS alone, and CS⫹TS at 0-, 15-, 20-, 25-, 30-, 35-ms ISIs). The order of conditions was randomized for each individual. SEPs were analyzed off-line with open-source EEGLAB software (version 13) (Delorme and Makeig 2004) running under the MATLAB (version 7.14) environment. Raw EEG data were rereferenced to AFz, digitally high-pass filtered (cutoff 1 Hz), and cleaned from line noise (60 Hz plus harmonics removed with the CleanLine plugin for EEGLAB), and the 300 epochs of 300-ms duration were averaged for each condition. Epochs with significant noise and/or artifact were objectively identified and rejected with the default automated thresholding method in EEGLAB (17 ⫾ 8 of 300 epochs rejected per trial). After visual inspection, a secondary 15-Hz high-pass filter was applied to all data sets in order to correct for pervasive signal drift. An asymmetry in the strength of transcallosal inhibition (TCI) has been reported in the human motor system, such that inhibition sent from the “dominant” hemisphere to the “nondominant” hemisphere is stronger than “nondominant” to “dominant,” particularly in righthanded individuals (Netz et al. 1995). Consequently, we opted to examine the influence of the left (dominant) S1 on the right (nondominant) S1. Thus for the purpose of the present study, analysis was restricted to electrode CP4, overlying S1 of the right (target) hemisphere. To eliminate the potential influence of an ipsilateral component from the initial CS (right MN stimulation) on the subsequent contralateral response to the TS (left MN stimulation), the average ipsilateral SEP response from right MN stimulation (CS) at electrode CP4 was subtracted from the average raw SEP response from each CS⫹TS condition (CS⫹TS raw ⫺ CS alone at CP4). Peak-to-peak amplitudes of five components (P14/N20, N20/P25, P25/N30, N30/ P40, and P40/N60) of the SEP recorded over CP4 were extracted manually based on plots of the subtracted values for each individual under each condition, according to the description by Ragert et al. (2011). Statistical analyses. All analyses were performed with SPSS software (version 20). Descriptive statistics were examined for the peakto-peak amplitudes of each SEP component for each ISI, and outliers ⬎ 2
J Neurophysiol • doi:10.1152/jn.00074.2014 • www.jn.org
1472
INTERHEMISPHERIC INHIBITION BETWEEN PRIMARY SENSORY CORTICES
Table 1. Mean SEP component peak-to-peak amplitudes recorded over CP4 for each condition Component
TS Alone
0 ms
15 ms
20 ms
25 ms
30 ms
35 ms
P14/N20 N20/P25 P25/N30 N30/P40 P40/N60
1.80 ⫾ 0.71 5.38 ⫾ 2.51 3.42 ⫾ 1.80 1.62 ⫾ 0.94 2.98 ⫾ 1.14
1.92 ⫾ 0.74 4.58 ⫾ 1.46 3.31 ⫾ 1.62 1.78 ⫾ 0.81 3.40 ⫾ 1.60
2.05 ⫾ 0.74 2.50 ⴞ 1.14† 3.21 ⫾ 2.14 3.16 ⫾ 1.87 2.92 ⫾ 1.69
1.73 ⫾ 0.40 3.25 ⴞ 1.44† 2.75 ⫾ 1.70 3.50 ⫾ 2.31 4.00 ⫾ 2.22
1.36 ⴞ 0.48* 3.47 ⴞ 1.59† 2.50 ⫾ 1.66 3.28 ⫾ 2.26 4.45 ⫾ 2.22
0.94 ⴞ 0.36* 3.66 ⴞ 1.18† 3.02 ⫾ 1.95 3.16 ⫾ 2.12 3.91 ⫾ 2.10
1.09 ⴞ 0.45* 3.59 ⴞ 0.96* 2.63 ⫾ 1.51 2.23 ⫾ 1.40 4.18 ⫾ 1.99
Values (in V) are means ⫾ SD. SEP, sensory evoked potential; TS, test stimulus. Significant values are in boldface: *P ⬍ 0.05, †P ⬍ 0.01 relative to 0 ms values.
standard deviations were removed (2.3% of the values). A two-way 5 ⫻ 7 repeated-measures analysis of variance (ANOVARM) was performed with Component (P14/N20, N20/P25, P25/N30, N30/P40, P40/N60) and ISI (TS alone, 0, 15, 20, 25, 30, 35 ms) as withinsubject factors. Mean peak-to-peak component amplitude was the dependent measure. Five one-way ANOVARMs were then performed for each SEP component, with ISI (TS alone, 0, 15, 20, 25, 30, 35 ms) as the independent variable and component amplitude as the dependent measure. Bonferroni-adjusted ␣ levels of 0.01 (0.05/5) were used to correct for multiple comparisons. Greenhouse-Geisser corrections for nonsphericity were applied when necessary (i.e., when the significance of the Mauchly statistic was ⬍0.05). Hypothesis-driven pairedsamples t-tests were then performed to identify differences in specific SEP component amplitudes. Significance levels were uncorrected for planned comparisons (Rothman 1990). RESULTS
Potential (μV)
The positive and negative peaks of the SEPs were considered visually distinguishable for each individual at each condition, except for the TS-only condition for one individual. In that particular case, electrical line noise drastically masked the
components of the SEP and the trial was excluded from all analyses. Mean peak-to-peak amplitudes for each component at each ISI are reported in Table 1, and grand averages for each condition are shown in Fig. 2. A two-way ANOVARM revealed a significant Component ⫻ ISI interaction (F24,96 ⫽ 2.866, P ⫽ 0.000). Separate follow-up one-way ANOVARMs for each component revealed a significant effect of ISI for the short-latency P14/N20 (F6,36 ⫽ 4.050, P ⫽ 0.003) and N20/P25 (F2.067,14.471 ⫽ 8.155, P ⫽ 0.004) components. A significant effect of ISI was not observed for any of the longer-latency SEP components (P25/N30: F2.686,21.487 ⫽ 1.252, P ⫽ 0.314; N30/P40: F2.472,17.304 ⫽ 2.006, P ⫽ 0.158; P40/N60: F6,42 ⫽ 2.000, P ⫽ 0.087). Significance level was adjusted to P ⬍ 0.01 for multiple comparisons. Paired-samples t-tests revealed no significant differences between any of the five SEP components in the TS alone condition compared with the 0 ms condition (P ⬎ 0.156). Therefore, the 0 ms condition was used as the basis for all further planned comparisons.
Potential (μV)
Time (ms)
Time (ms) Fig. 2. Grand averages of SEPs recorded over CP4 from all subjects for each condition. J Neurophysiol • doi:10.1152/jn.00074.2014 • www.jn.org
INTERHEMISPHERIC INHIBITION BETWEEN PRIMARY SENSORY CORTICES
Only the SEP components that demonstrated a significant main effect of ISI (P14/N20 and N20/P25) were considered for planned comparisons. The mean peak-to-peak amplitude of P14/N20 recorded at CP4 was significantly depressed at CS⫹TS ISIs of 25 ms (t9 ⫽ 2.439, P ⫽ 0.037), 30 ms (t8 ⫽ 3.183, P ⫽ 0.013), and 35 ms (t8 ⫽ 2.987, P ⫽ 0.017) relative to 0 ms. No such changes were observed for the P14/N20 component at CS⫹TS ISIs of 15 or 20 ms (P ⬎ 0.520; Fig. 3A). Moreover, compared with the 0 ms condition, the mean peak-to-peak amplitude of the N20/P25 component was significantly reduced at all asynchronous CS⫹TS ISIs (15 ms: t8 ⫽ 6.567, P ⫽ 0.000; 20 ms: t8 ⫽ 3.448, P ⫽ 0.009; 25 ms: t8 ⫽ 5.001, P ⫽ 0.001; 30 ms: t8 ⫽ 3.373, P ⫽ 0.010; 35 ms: t8 ⫽ 2.342, P ⫽ 0.047; Fig. 3B). Significance level was P ⬍ 0.05 for all hypothesis-driven post hoc comparisons. DISCUSSION
The present study examined the change in SEP amplitude recorded over the right S1 following activation of the homologous left S1 due to somatosensory IHI. We discovered that 1) the mean peak-to-peak amplitude of the thalamocortical P14/ N20 component was significantly decreased when the CS preceded the TS by 25, 30, and 35 ms relative to 0 ms, 2) the mean peak-to-peak amplitude of the cortical N20/P25 component was significantly decreased when the CS preceded the TS by 15, 20, 25, 30, and 35 ms relative to 0 ms, and 3) the long-latency SEP components did not appear to be influenced by the PMNSEP paradigm at any of the ISIs studied. Ragert et al. (2011) reported that a CS applied to the left MN attenuated the early thalamocortical P14/N20 response of the
A
P14/N20
Amplitude (μV)
3
2
*
*
*
25ms
30ms
35ms
1
0 TS
0ms
B
20ms
N20/P25
10
Amplitude (μV)
15ms
8 6
*
*
*
*
*
15ms
20ms
25ms
30ms
35ms
4 2 0 TS
0ms
Fig. 3. Mean peak-to-peak amplitudes of short-latency cortical SEP components. A: the P14/N20 component was significantly inhibited when the CS preceded the TS by 25, 30, and 35 ms relative to the 0 ms condition (P ⫽ 0.037 at 25 ms, P ⫽ 0.013 at 30 ms, P ⫽ 0.017 at 35 ms). B: the N20/P25 component was significantly inhibited at all of the asynchronous CS⫹TS conditions relative to the synchronous 0 ms condition (P ⫽ 0.000 at 15 ms, P ⫽ 0.009 at 20 ms, P ⫽ 0.001 at 25 ms, P ⫽ 0.010 at 30 ms, P ⫽ 0.047 at 35 ms) Values are ⫾SD. *P ⬍ 0.05 uncorrected.
1473
left S1 to a subsequent TS applied to the right MN, but only at ISIs of 20 and 25 ms. The present study confirms and extends these findings, reporting a similar depression of comparable amplitude (⬃30% inhibition) of the P14/N20 component recorded over the right S1 at an ISI of 25 ms. Yet we also discovered that the inhibitory effect was extended to longer ISIs of 30 and 35 ms. In addition, we observed a clear and consistent attenuation of the N20/P25 complex at ISIs of 15, 20, 25, 30, and 35 ms relative to 0 ms. In other words, in the shorter-duration ISI conditions (15 and 20 ms) it appears that the CS had enough time to interfere with the later-onset N20/P25 complex but not the earlier-onset P14/N20. Thus our data suggest that there may be a minimum time window required for the influence of the CS to influence different components of the SEP generated by the TS in the opposite hemisphere. This observation is consistent with the hypothesis that an inhibitory interaction is being transmitted between S1s via the corpus callosum. S1 is comprised of four cytoarchitechtonically and functionally distinct areas: Broca’s areas 1, 2, 3a, and 3b (Geyer et al. 1999). Afferent signals from cutaneous stimulation are transmitted first to area 3b [sometimes referred to as “S1 proper” (Kaas 1983)] and then to the other areas of S1 and secondary cortical areas for higher processing. The short-latency P14/N20 and N20/P25 components of the SEP are driven by neural activity in area 3b (Allison et al. 1991; Jung et al. 2008); however, they have slightly different origins. The subcortical P14 potential is evoked when an afferent sensory stimulus synapses at the thalamus, and the N20 is evoked when the signal first reaches cortical layer 4 (Allison et al. 1991). The P25 component is generated by the apical dendrites in cortical layers 2/3 of area 3b (Allison et al. 1991; Premji et al. 2010). Interestingly, neurons in layers 2/3 of the cerebral cortex are primarily involved in interhemispheric communication via the corpus callosum (Jones 2004). If the mechanism underlying the somatosensory IHI reported in the present study is in fact being transmitted across the corpus callosum, then it is not surprising that we observed an inhibitory effect in the N20/P25 component at shorter ISIs than the P14/N20 component. In light of the present data it seems that a CS⫹TS ISI of at least 25 ms is required before the P14/N20 complex is suppressed. According to our proposed model, after the CS is transmitted from the right MN to the contralateral left S1 the signal would most likely be conveyed across the corpus callosum to activate inhibitory interneurons in the homologous area of right S1, causing an inhibitory effect prior to the arrival of the N20 from the TS (which would reach the right S1 45 ms after the CS onset in the 25 ms ISI condition). Interestingly, we noted that the N20/P25 complex was inhibited at CS⫹TS ISIs as short as 15 ms. In the 15 ms ISI condition, once the CS has evoked an N20 in the left S1 (20 ms), and crossed the corpus callosum (15–20 ms), its inhibition in the right S1 will presumably take effect 35– 40 ms after CS onset. However, by 35 ms, the N20 from the TS in the right S1 will have already been evoked, making it immune to the inhibitory effect. The P25 potential may still be susceptible, though, as it takes place 5 ms later (Fig. 4). In total, our data suggest that the transcallosal conduction time between S1s is between 15 and 20 ms (Fig. 4). These findings agree with early anatomical studies that estimated that the interhemispheric transfer time between primary somatosen-
J Neurophysiol • doi:10.1152/jn.00074.2014 • www.jn.org
1474
INTERHEMISPHERIC INHIBITION BETWEEN PRIMARY SENSORY CORTICES
ISI:
15 20 25 30 35 P25
0ms
P40
P14 N30 N60
Fig. 4. Schematic timeline for the differential effects of interhemispheric inhibition on the short-latency P14/N20 and N20/P25 SEP components. When the TS was preceded by the CS by 15 or 20 ms, the mean peak-topeak amplitude of the cortical N20/P25 complex was significantly depressed. However, when the TS was preceded by the CS by 25, 30, or 35 ms, a significant depression was observed for both the thalamocortical P14/ N20 complex and the cortical N20/P25. This temporal pattern suggests that a minimum of ⬃15 ms of transfer time is required for inhibition from the CS to reach the opposite hemisphere. Thick black bars indicate TS onset time, relative to the CS. *P ⬍ 0.05 uncorrected. ISI, interstimulus interval.
N20
15ms
~15ms
* *
20ms
25ms
30ms
*
*
*
35ms
sory areas would likely be between 13 and 26 ms, based on data from the occipital system (Lines et al. 1984; Saron and Davidson 1989; Srebro 1987) and the comparable axonal diameter and distances (Aboitiz 1992). There are several alternative mechanisms by which somatosensory IHI may also occur. For example, given that there are few, if any, direct transcallosal pathways between area 3b of S1 in each hemisphere reported in nonhuman primates (Killackey et al. 1983; Krubitzer et al. 1998), it has been suggested that somatosensory IHI may be transmitted indirectly via the betterdefined transcallosal M1 connections. Based on measures of TCI between the motor cortices, the transcallosal conduction time is assumed to be ⬃10 –15 ms (for short-interval IHI) (Ferbert et al. 1992; Reis et al. 2008). While there are no direct neural connections between area 3b and M1 (Jones et al. 1978), M1 and S1 are reciprocally connected via area 2 of S1 (Caria et al. 1997; Jones et al. 1978; Kaas 1993), and sensory input is known to influence the ipsilateral motor cortex at a 5-ms delay (Ferreri et al. 2012; Goldring et al. 1970). It is therefore possible that an S1-M1-M1-S1 pathway may mediate IHI between S1s (Zapallow et al. 2013). However, the total transmission time from the contralateral to the ipsilateral S1 would take at least 20 ms, and perhaps longer because of the multiple synaptic steps involved. In addition to the 20 ms required for sensory information from the MN to reach the contralateral S1, the total transmission time surpasses the short ISI window examined here, making S1-M1-M1-S1 an unlikely explanation for the present observations. Similarly, extensive transcallosal projections have been reported between homologous secondary somatosensory cortical areas, such as the parietal operculum (SII) of each hemisphere (Frot and Mauguiere 1999; Hoechstetter et al. 2001; Iwamura 2000; Jones and Powell 1970; Jung et al. 2012; Krubitzer and Kaas 1990). Dense intracortical connections exist between area 3b and SII (Kaas 1993; Manzoni et al. 1986); thus it has been
*
*
*
argued that somatosensory IHI is transmitted via an S1-SIISII-S1 pathway, rather than directly from S1 to S1. For example, a recent study used magnetoencephalography (MEG) to measure nondominant to dominant interhemispheric communication between cortical sensory areas, using a similar CS⫹TS MN stimulation paradigm (Jung et al. 2012). The authors report a significant depression of SII activity contralateral to the TS at ISIs of 10, 20, 40, and 60 ms, yet they failed to observe a significant depression of SI activity at any of the ISIs studied (Jung et al. 2012). Nevertheless, sensory input is thought to arrive at SII 40 ms after its initial synapse in S1 (Frot and Mauguiere 1999), which makes this secondary cortical pathway beyond the temporal scope of the present EEG study and that of Ragert et al. (2011). Further investigation is required in order to elucidate why early S1-S1 IHI may be observed with some methods (e.g., EEG) but not others (e.g., MEG). One other possibility to consider is that S1 inhibition may be mediated in part by the thalamus. All somatosensory signals entering the brain from the periphery cross the midline in the brain stem and then synapse in the contralateral thalamus prior to reaching the cortex. While some thalamic nuclei are known to have an inhibitory influence on the cortex (Pinault 2004; Staines et al. 2002), the two halves of the thalamus are structurally distinct; that is, there are no known commissural pathways connecting the two thalami (Cheng et al. 2010; Olry and Haines 2005). It is therefore unlikely that the inhibition observed in the right hemisphere (ipsilateral to the CS) is due to direct thalamic inhibition. Furthermore, the differential inhibition observed in the P14/N20 and the N20/P25 components is not suggestive of thalamic inhibition. Given the serial nature of transmission from the thalamus to layer 4 to layers 2/3 of the cortex, if the inhibition were generated by the thalamus then both components would be influenced simultaneously (Wolters et al. 2005).
J Neurophysiol • doi:10.1152/jn.00074.2014 • www.jn.org
INTERHEMISPHERIC INHIBITION BETWEEN PRIMARY SENSORY CORTICES
We conclude that the most likely explanation for the present results is direct transcallosal transmission from S1 to S1. Area 2 of S1 does have some reported callosal connections in nonhuman primates (Iwamura 2000; Iwamura et al. 2001; Killackey et al. 1983), and areas 3b and 2 are functionally interconnected within the same hemisphere (Killackey et al. 1983; Krubitzer et al. 1998). Once the initial inhibitory influence has been initiated, however, it is very likely that input from other areas such as M1, SII, and back projections from the thalamus may also contribute to its development. The PMNSEP paradigm used here was similar to that used by Ragert et al. (2011); however, the results of the present study are not identical. Certain methodological differences may have contributed to these differences. For example, we targeted the nondominant right hemisphere, whereas Ragert et al. targeted the dominant left hemisphere. IHI in the motor system is reported to be stronger from the dominant to the nondominant hemisphere (Netz et al. 1995); therefore we may have detected a stronger and longer-lasting inhibitory effect in our experiment. In addition, our MN stimulation intensities may have been stronger and more consistent throughout the experiment. Ragert et al. (2011) report evoking a small but visible twitch in the thumb, and they did not change the intensity of stimulation once it had begun. We monitored EMG activity online and made adjustments as necessary to maintain consistent 1 mV peak-to-peak amplitudes in both hands throughout every trial in the experiment. Finally, we chose 0 ms rather than TS alone as our baseline condition, as individuals are more likely to direct their attention to the hand being stimulated during the TS-only condition, whereas their attention would more likely be divided when both hands were being stimulated simultaneously. This was justified by a nonsignificant difference between any of the SEP components evoked by the TS alone versus CS⫹TS simultaneously (0 ms). It is important to note, however, that the mechanism proposed here is a hypothesis that requires additional testing, and the present study had some limitations. Measuring peak-topeak amplitudes of evoked cortical responses at a single channel is a simple, yet relatively crude way of inferring cortical processing mechanisms. Future work may analyze independent components and localize their anatomical sources in an effort to circumvent this issue. Because IHI in the motor system is known to correlate with bimanual coordination and motor function, it would be important to measure behavior associated with somatosensory IHI. At this time, the relationship between somatosensory IHI and behavior has yet to be fully elucidated. Conclusion. In sum, analogous to the motor system, the degree of S1 IHI appears to depend on the temporal asynchrony of bilateral inputs, and the specific timing is reflective of a transcallosal mechanism. Future studies may consider not only whether this IHI has behavioral or perceptual correlates in healthy individuals but also whether it may be used in neurological disorders such as stroke to predict impairment and potential benefit from therapeutic interventions. ACKNOWLEDGMENTS The authors acknowledge Dr. Sean Meehan and Dr. Patrick Ragert for their suggestions during the creation of this manuscript. Present address of M. R. Borich: Div. of Physical Therapy, School of Medicine, Emory University, Atlanta, GA 30322.
1475
GRANTS This work was supported by the Natural Sciences and Engineering Research Council of Canada (award no. 401890 to L. A. Boyd). L. A. Boyd received salary support from the Canada Research Chairs and the Michael Smith Foundation for Health Research. DISCLOSURES No conflicts of interest, financial or otherwise, are declared by the author(s). AUTHOR CONTRIBUTIONS Author contributions: S.M.B., A.V., M.R.B., and L.A.B. conception and design of research; S.M.B. and M.R.B. performed experiments; S.M.B. and A.V. analyzed data; S.M.B., A.V., and L.A.B. interpreted results of experiments; S.M.B. prepared figures; S.M.B. drafted manuscript; S.M.B., M.R.B., and L.A.B. edited and revised manuscript; S.M.B., M.R.B., and L.A.B. approved final version of manuscript. REFERENCES Aboitiz F. Brain connections: interhemispheric fiber systems and anatomical brain asymmetries in humans. Biol Res 25: 51– 61, 1992. Aboitiz F, Scheibel AB, Fisher RS, Zaidel E. Fiber composition of the human corpus callosum. Brain Res 598: 143–153, 1992. Allison T, McCarthy G, Wood CC, Jones SJ. Potentials evoked in human and monkey cerebral cortex by stimulation of the median nerve. A review of scalp and intracranial recordings. Brain 114: 2465–2503, 1991. Blankenburg F, Ruff CC, Bestmann S, Bjoertomt O, Eshel N, Josephs O, Weiskopf N, Driver J. Interhemispheric effect of parietal TMS on somatosensory response confirmed directly with concurrent TMS-fMRI. J Neurosci 28: 13202–13208, 2008. Butefisch CM, Wessling M, Netz J, Seitz RJ, Homberg V. Relationship between interhemispheric inhibition and motor cortex excitability in subacute stroke patients. Neurorehabil Neural Repair 22: 4 –21, 2008. Caria MA, Kaneko T, Kimura A, Asanuma H. Functional organization of the projection from area 2 to area 4gamma in the cat. J Neurophysiol 77: 3107–3114, 1997. Cheng S, Tan K, Bilston LE. The effects of the interthalamic adhesion position on cerebrospinal fluid dynamics in the cerebral ventricles. J Biomech 43: 579 –582, 2010. Clarey JC, Tweedale R, Calford MB. Interhemispheric modulation of somatosensory receptive fields: evidence for plasticity in primary somatosensory cortex. Cereb Cortex 6: 196 –206, 1996. Cohen MS. Handedness Questionnaire. www.brainmapping.org/shared/Edinburgh.php [September 15, 2013]. Daskalakis ZJ, Christensen BK, Fitzgerald PB, Chen R. Transcranial magnetic stimulation: a new investigational and treatment tool in psychiatry. J Neuropsychiatry Clin Neurosci 14: 406 – 415, 2002a. Daskalakis ZJ, Christensen BK, Fitzgerald PB, Roshan L, Chen R. The mechanisms of interhemispheric inhibition in the human motor cortex. J Physiol 543: 317–326, 2002b. De Gennaro L, Ferrara M, Bertini M, Pauri F, Cristiani R, Curcio G, Romei V, Fratello F, Rossini PM. Reproducibility of callosal effects of transcranial magnetic stimulation (TMS) with interhemispheric paired pulses. Neurosci Res 46: 219 –227, 2003. Delorme A, Makeig S. EEGLAB: an open source toolbox for analysis of single-trial EEG dynamics including independent component analysis. J Neurosci Methods 134: 9 –21, 2004. Duque J, Hummel F, Celnik P, Murase N, Mazzocchio R, Cohen LG. Transcallosal inhibition in chronic subcortical stroke. Neuroimage 28: 940 – 946, 2005. Duque J, Murase N, Celnik P, Hummel F, Harris-Love M, Mazzocchio R, Olivier E, Cohen LG. Intermanual differences in movement-related interhemispheric inhibition. J Cogn Neurosci 19: 204 –213, 2007. Eickhoff SB, Grefkes C, Fink GR, Zilles K. Functional lateralization of face, hand, and trunk representation in anatomically defined human somatosensory areas. Cereb Cortex 18: 2820 –2830, 2008. Ferbert A, Priori A, Rothwell JC, Day BL, Colebatch JG, Marsden CD. Interhemispheric inhibition of the human motor cortex. J Physiol 453: 525–546, 1992. Ferreri F, Ponzo D, Hukkanen T, Mervaala E, Kononen M, Pasqualetti P, Vecchio F, Rossini PM, Maatta S. Human brain cortical correlates of
J Neurophysiol • doi:10.1152/jn.00074.2014 • www.jn.org
1476
INTERHEMISPHERIC INHIBITION BETWEEN PRIMARY SENSORY CORTICES
short-latency afferent inhibition: a combined EEG-TMS study. J Neurophysiol 108: 314 –323, 2012. Fling BW, Benson BL, Seidler RD. Transcallosal sensorimotor fiber tract structure-function relationships. Hum Brain Mapp 34: 384 –395, 2013. Frot M, Mauguiere F. Timing and spatial distribution of somatosensory responses recorded in the upper bank of the sylvian fissure (SII area) in humans. Cereb Cortex 9: 854 – 863, 1999. Garcia-Larrea L, Bastuji H, Mauguiere F. Mapping study of somatosensory evoked potentials during selective spatial attention. Electroencephalogr Clin Neurophysiol 80: 201–214, 1991. Garvey MA, Ziemann U, Becker DA, Barker CA, Bartko JJ. New graphical method to measure silent periods evoked by transcranial magnetic stimulation. Clin Neurophysiol 112: 1451–1460, 2001. Geyer S, Schleicher A, Zilles K. Areas 3a, 3b, and 1 of human primary somatosensory cortex. Neuroimage 10: 63– 83, 1999. Goldring S, Aras E, Weber PC. Comparative study of sensory input to motor cortex in animals and man. Electroencephalogr Clin Neurophysiol 29: 537–550, 1970. Hlushchuk Y, Hari R. Transient suppression of ipsilateral primary somatosensory cortex during tactile finger stimulation. J Neurosci 26: 5819 –5824, 2006. Hoechstetter K, Rupp A, Stancak A, Meinck HM, Stippich C, Berg P, Scherg M. Interaction of tactile input in the human primary and secondary somatosensory cortex—a magnetoencephalographic study. Neuroimage 14: 759 –767, 2001. Iwamura Y. Bilateral receptive field neurons and callosal connections in the somatosensory cortex. Philos Trans R Soc Lond B Biol Sci 355: 267–273, 2000. Iwamura Y, Taoka M, Iriki A. Bilateral activity and callosal connections in the somatosensory cortex. Neuroscientist 7: 419 – 429, 2001. Jones EG. Cerebral Cortex. Amsterdam: Elsevier, 2004, p. 769 –773. Jones EG, Coulter JD, Hendry SH. Intracortical connectivity of architectonic fields in the somatic sensory, motor and parietal cortex of monkeys. J Comp Neurol 181: 291–347, 1978. Jones EG, Powell TP. An anatomical study of converging sensory pathways within the cerebral cortex of the monkey. Brain 93: 793– 820, 1970. Jung P, Baumgartner U, Magerl W, Treede RD. Hemispheric asymmetry of hand representation in human primary somatosensory cortex and handedness. Clin Neurophysiol 119: 2579 –2586, 2008. Jung P, Klein JC, Wibral M, Hoechstetter K, Bliem B, Lu MK, Wahl M, Ziemann U. Spatiotemporal dynamics of bimanual integration in human somatosensory cortex and their relevance to bimanual object manipulation. J Neurosci 32: 5667–5677, 2012. Kaas JH. The functional organization of somatosensory cortex in primates. Ann Anat 175: 509 –518, 1993. Kaas JH. What, if anything, is SI? Organization of first somatosensory area of cortex. Physiol Rev 63: 206 –231, 1983. Kastrup A, Baudewig J, Schnaudigel S, Huonker R, Becker L, Sohns JM, Dechent P, Klingner C, Witte OW. Behavioral correlates of negative BOLD signal changes in the primary somatosensory cortex. Neuroimage 41: 1364 –1371, 2008. Killackey HP, Gould HJ 3rd, Cusick CG, Pons TP, Kaas JH. The relation of corpus callosum connections to architectonic fields and body surface maps in sensorimotor cortex of new and old world monkeys. J Comp Neurol 219: 384 – 419, 1983. Klingner CM, Ebenau K, Hasler C, Brodoehl S, Gorlich Y, Witte OW. Influences of negative BOLD responses on positive BOLD responses. Neuroimage 55: 1709 –1715, 2011.
Krubitzer L, Clarey JC, Tweedale R, Calford MB. Interhemispheric connections of somatosensory cortex in the flying fox. J Comp Neurol 402: 538 –559, 1998. Krubitzer LA, Kaas JH. The organization and connections of somatosensory cortex in marmosets. J Neurosci 10: 952–974, 1990. Lines CR, Rugg MD, Milner AD. The effect of stimulus intensity on visual evoked potential estimates of interhemispheric transmission time. Exp Brain Res 57: 89 –98, 1984. Lipton ML, Fu KM, Branch CA, Schroeder CE. Ipsilateral hand input to area 3b revealed by converging hemodynamic and electrophysiological analyses in macaque monkeys. J Neurosci 26: 180 –185, 2006. Manzoni T, Conti F, Fabri M. Callosal projections from area SII to SI in monkeys: anatomical organization and comparison with association projections. J Comp Neurol 252: 245–263, 1986. Meehan SK, Dao E, Linsdell MA, Boyd LA. Continuous theta burst stimulation over the contralesional sensory and motor cortex enhances motor learning post-stroke. Neurosci Lett 500: 26 –30, 2011. Nelson AJ, Hoque T, Gunraj C, Ni Z, Chen R. Bi-directional interhemispheric inhibition during unimanual sustained contractions. BMC Neurosci 10: 31, 2009. Netz J, Ziemann U, Homberg V. Hemispheric asymmetry of transcallosal inhibition in man. Exp Brain Res 104: 527–533, 1995. Oldfield RC. The assessment and analysis of handedness: the Edinburgh inventory. Neuropsychologia 9: 97–113, 1971. Olry R, Haines DE. Interthalamic adhesion: scruples about calling a spade a spade? J Hist Neurosci 14: 116 –118, 2005. Pinault D. The thalamic reticular nucleus: structure, function and concept. Brain Res Brain Res Rev 46: 1–31, 2004. Premji A, Ziluk A, Nelson AJ. Bilateral somatosensory evoked potentials following intermittent theta-burst repetitive transcranial magnetic stimulation. BMC Neurosci 11: 91, 2010. Ragert P, Nierhaus T, Cohen LG, Villringer A. Interhemispheric interactions between the human primary somatosensory cortices. PLoS One 6: e16150, 2011. Reed JL, Qi HX, Kaas JH. Spatiotemporal properties of neuron response suppression in owl monkey primary somatosensory cortex when stimuli are presented to both hands. J Neurosci 31: 3589 –3601, 2011. Reis J, Swayne OB, Vandermeeren Y, Camus M, Dimyan MA, HarrisLove M, Perez MA, Ragert P, Rothwell JC, Cohen LG. Contribution of transcranial magnetic stimulation to the understanding of cortical mechanisms involved in motor control. J Physiol 586: 325–351, 2008. Rothman KJ. No adjustments are needed for multiple comparisons. Epidemiology 1: 43– 46, 1990. Saron CD, Davidson RJ. Visual evoked potential measures of interhemispheric transfer time in humans. Behav Neurosci 103: 1115–1138, 1989. Srebro R. The topography of scalp potentials evoked by pattern pulse stimuli. Vision Res 27: 901–914, 1987. Staines WR, Black SE, Graham SJ, McIlroy WE. Somatosensory gating and recovery from stroke involving the thalamus. Stroke 33: 2642–2651, 2002. Voineskos AN, Farzan F, Barr MS, Lobaugh NJ, Mulsant BH, Chen R, Fitzgerald PB, Daskalakis ZJ. The role of the corpus callosum in transcranial magnetic stimulation induced interhemispheric signal propagation. Biol Psychiatry 68: 825– 831, 2010. Wolters A, Schmidt A, Schramm A, Zeller D, Naumann M, Kunesch E, Benecke R, Reiners K, Classen J. Timing-dependent plasticity in human primary somatosensory cortex. J Physiol 565: 1039 –1052, 2005. Zapallow CM, Jacobs MF, Lee KG, Asmussen MJ, Tsang P, Nelson AJ. Continuous theta-burst stimulation over the primary somatosensory cortex modulates interhemispheric inhibition. Neuroreport 24: 394 –398, 2013.
J Neurophysiol • doi:10.1152/jn.00074.2014 • www.jn.org