Exploring Usability Effects of Increasing Security in Click-based Graphical Passwords Elizabeth Stobert, Alain Forget, Sonia Chiasson, Paul van Oorschot, Robert Biddle Carleton University, Ottawa, Canada
[email protected],
[email protected],
[email protected],
[email protected],
[email protected] ABSTRACT Graphical passwords have been proposed to address known problems with traditional text passwords. For example, memorable user-chosen text passwords are predictable, but random system-assigned passwords are difficult to remember. We explore the usability effects of modifying system parameters to increase the security of a click-based graphical password system. Generally, usability tests for graphical passwords have used configurations resulting in password spaces smaller than that of common text passwords. Our two-part lab study compares the effects of varying the number of click-points and the image size, including when different configurations provide comparable password spaces. For equivalent spaces, no usability advantage was evident between more click-points, or a larger image. This is contrary to our expectation that larger image size (with fewer clickpoints) might offer usability advantages over more clickpoints (with correspondingly smaller images). The results suggest promising opportunities for better matching graphical password system configurations to device constraints, or capabilities of individual users, without degrading usability. For example, more click-points could be used on smartphone displays where larger image sizes are not possible.
1.
INTRODUCTION
The problems of knowledge-based authentication, typically text-based passwords, are well known. Users often create memorable passwords that are easy for attackers to guess, but strong system-assigned passwords are difficult for users to remember [24]. Users also tend to reuse passwords across many accounts [16] and this increases the potential impact if one account is compromised. Alternatives such as graphical passwords [4, 25] use images instead of text for authentication. They attempt to leverage the pictorial superiority effect [22] which suggests that humans are better able to remember images than text. Some graphical password systems also provide cueing [8], whereby a memory retrieval cue is provided to help users remember and distin-
Permission to make digital or hard copies of all or part of this work for personal or classroom use is granted without fee provided that copies are not made or distributed for profit or commercial advantage and that copies bear this notice and the full citation on the first page. To copy otherwise, to republish, to post on servers or to redistribute to lists, requires prior specific permission and/or a fee. ACSAC ’10 Dec. 6-10, 2010, Austin, Texas USA Copyright 2010 ACM 978-1-4503-0133-6/10/12 ...$10.00.
guish their passwords. In this paper we explore methods to increase the security of cued-recall graphical passwords1 . We chose to study Persuasive Cued Click-Points (PCCP), a click-based graphical password system in which users select click-points on more than one image [5]. PCCP has been shown to have good usability, while avoiding hotspots that have been shown to affect the security of other click-based graphical password systems [6]. We address the threat of guessing attacks. This danger arises when the total number of possible passwords is small, or when attackers can predict likely passwords. The design of PCCP reduces the predictability of passwords by influencing users during password creation. The number of possible passwords with its standard configuration is 243 , slightly less than that of 7-character random text passwords. A gap in previous literature is that usability tests for graphical password schemes (in general) have only been tested for configurations with password spaces smaller than that of common text passwords. To address this, we explored increasing security in PCCP, conducting a study modifying two parameters: the size of the images presented, and the number of click-points in each password. The study included 82 participants who completed two sessions scheduled two weeks apart. Our results show that both manipulations affect the usability of the system and memorability of the passwords. Moreover, when adjusted to provide the same level of security, both manipulations have similar effects on usability and memorability. This suggests that when increasing security, constraints of devices and user preferences might be accommodated. For example, when designing for mobile devices, smaller images and more click-points might be used due to smaller screen sizes. The remainder of this paper is organized as follows: we first provide some general background on graphical passwords, and more detail on PCCP. We then introduce our study methodology, and its results. Finally, we discuss the implications of the results and offer our conclusions.
2.
BACKGROUND
Graphical password systems [4, 25] are a type of knowledgebased authentication that rely on the human ability to better recognize and remember images than textual or verbal information [22]. They fall into three main categories: Recall: (also known as drawmetric [10]) Users recall and reproduce a secret drawing on a blank canvas (which may 1 An early version of part of this work was an extended abstract in the ACM CHI 2010 student research competition.
include grid-lines for guidance). Example systems include Draw-A-Secret [19] and Pass-Go [26]. Recognition: (also known as cognometric [10] or searchmetric [23]) Users recognize and identify images from a previously memorized portfolio from a larger set of decoy images. Example systems include PassFaces [9] and D´ej` a Vu [12]. Cued-recall: (also known as locimetric [10]) Users identify and target previously selected locations within one or more images. The images act as memory cues to help recall these locations. Example systems include PassPoints [30] and Persuasive Cued Click-Points [5]. Other approaches to authentication are token-based systems and biometrics. While applicable in some cases, these have potential drawbacks, such as risks of loss, and privacy implications [20]. Password managers have also been proposed, but usability issues and the dangers of centralization remain unsolved problems [7]. In cued-recall click-based graphical passwords [4, 30], passwords consist of clicking on specific locations on one or more images. To log in, the user must click on these previously selected locations. The user is not expected to repeat exact pixel selections. In most systems, an invisible tolerance square is defined around each click-point so that any of the enclosed pixels are considered acceptable. Alternatively, a grid may be visible to users [3]. In this paper, we focus on Persuasive Cued Click-Points (PCCP) [5]. In PCCP, a user is presented with a number of images in sequence, and must choose one click-point per image. The first image is assigned by the system, but each subsequent image is determined by the user’s previous click. In other words, clicking on different locations on an image results in different next images. This provides users with feedback about the correctness of their password entry attempt — if they see the correct next image, they can be fairly certain they have selected the correct click-point. However, this implicit feedback is not useful to attackers who do not know the correct sequence of images. Earlier click-based password schemes have a security weakness which makes passwords easier for attackers to predict. Users tend to select similar locations on images, forming hotspots [18, 14, 29, 28]. They also tend to select their clickpoints in predictable geometric patterns [6, 28]. To help create more secure passwords, PCCP includes “persuasive” elements. As shown in Figure 1, the system assists users only during password creation by providing a viewport that highlights a random part of the image. Users must select a click-point within this viewport. If users are unable to find a memorable point in the current viewport, they may press the shuffle button to randomly reposition the viewport. Studies [5, 6] show that this viewport, together with the shuffle button, causes click-points to be more randomly distributed, addressing the predictability problem seen in earlier schemes. PCCP is stronger against password-guessing attacks than other click-based password systems and also maintains login times and success rates comparable to text passwords [5]. However, to be seriously considered as a replacement for text passwords, PCCP needs to be at least as secure as standard text passwords. We can adjust the security of PCCP by manipulating several parameters, which in turn affect the size of the theoretical password space. However, no study of a click-based graphical password system has ever made these manipulations.
Table 1: Theoretical password space for different text passwords. Number of Characters n Password Space (bits) 95 6 39 95 8 53 95 10 66
Table 2: System parameters for the six experimental conditions and distribution of participants (N). Click- Condition Password w h points Name Space N (in bits) Small 451 331 5 S5 44 14 451 331 6 S6 53 14 451 331 7 S7 61 14 Large 800 600 5 L5 52 14 800 600 6 L6 63 12 800 600 7 L7 73 14
The theoretical password space for a password system is the total number of unique passwords that could be generated according to the system specifications. Ideally, a larger theoretical password space lowers the likelihood that any particular password may be guessed. For text passwords, the theoretical password space is typically reported as 95n , where n is the length of the password, and 95 is the number of typeable characters on the US English keyboard. Table 1 gives the theoretical password space for text passwords of different lengths. For PCCP, the theoretical password space is calculated as: ((w × h)/t2 )c , where the size of the image in pixels (w × h) is divided by the size of a tolerance square (t2 , typically 192 ), to get the total number of tolerance squares per image, then is raised to the power of the number of click-points (c). Table 2 shows the theoretical password space for PCCP with different parameters. As shown in the tables, the theoretical password space for PCCP can be adjusted to approximate the space of text passwords of varying lengths. For example, an 8-character text password has approximately the same password space (253 or 53 bits) as a PCCP password with a small image size (451 × 331 pixels) and 6 click-points, or a large image size (800 × 600 pixels) and 5 click-points. The effective password space represents the set of passwords that users are likely to create. For example, in the absence of enforced rules, users of text passwords typically include only lowercase letters, limiting the effective password space to 26n . For an 8-character password, this would result in a password space of 38 bits. Only rough estimates of the effective password space are available because user choice is based on personal preference rather than mathematical principles. Commonly available text password attack tools such as John the Ripper [11] include dictionaries of up to 40 million entries, or 25 bits. Similarly, hotspots and patterns reduce the effective password space in click-based graphical passwords. Since PCCP significantly reduces the occurrence of hotspots and patterns, its effective password space approaches the theoretical password space. By matching the theoretical password space of PCCP to that of text passwords, the corresponding effective password space of PCCP is at least as large (and likely larger) than for text passwords.
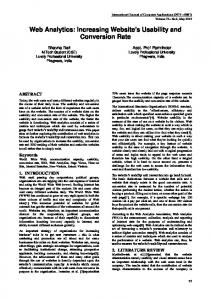
Figure 1: User interface for password creation for the small and large image sizes in PCCP.
3.
STUDY
Our study was designed to explore ways of increasing the password space of PCCP by changing the configuration of the system. With PCCP, three parameters can be manipulated: the image size, the number of click-points per password, and the size of the tolerance square. In this study, we increased the number of click-points in each password and increased the size of the images presented. Our goal was to determine which manipulation resulted in better usability and memorability for approximately equivalent password spaces (as a proxy for security). We chose to keep the size of the tolerance square constant (set to 19 × 19 as in previous studies) because its size is constrained by human visual acuity [15] and fine motor control. We had three hypotheses: Hypothesis 1(a): Increasing the number of click-points will decrease usability (as defined below). Hypothesis 1(b): Increasing the size of the image will decrease usability. Hypothesis 2: For conditions with approximately comparable theoretical password spaces, the condition with the larger image size will have better usability (i.e., L5 would have better usability than S6, and L6 would have better usability than S7). Our rationale for hypothesis 2 was that conditions with more click-points would have lower usability because we speculated that the cognitive load and the physical task of entering another click-point would dominate the inspection task of finding a click-point on a larger image.
Our independent variables were the image size and the number of click-points. As shown in Table 2, there were six experimental conditions: S5 (small image, 5 click-points); S6 (small image, 6 click-points); S7 (small image, 7 clickpoints); L5 (large image, 5 click-points); L6 (large image, 6 click-points); and L7 (large image, 7 click-points). The small image size was 451 × 331 pixels (the size used in the original PCCP study [5]) and the large image size was 800×600 pixels (standardizing to a 4:3 aspect ratio). These specific settings were chosen to approximate the theoretical password space of text passwords. Our dependent variables concerned usability, and were success rates, duration of password entry, and number of errors. Conditions with shorter durations, fewer errors and higher success rates were judged to have better usability. The level of security was based on the theoretical password space as determined by the independent variables. We also intended to explore the effects of the different conditions on user behaviour in click-point selection, possibly resulting in clustering which reduces the effective password space. A between-subjects design was used, and the 82 participants (47 females and 35 males) were randomly assigned to one of six study conditions. All participants were regular computer users accustomed to using text passwords. The majority of the participants were university undergraduates, but no participants were studying computer security. Participants took part in two one-on-one sessions with the experimenter, scheduled approximately two weeks apart. The sessions were 1 hour and 30 minutes long, respectively. Based on previous data, we anticipated that users would be very successful at remembering their passwords during their first session. We had participants wait two weeks before their second session in an effort to counteract ceiling effects and provide measurable differences. Previous studies have shown ceiling effects where participants are extremely successful at remembering their passwords within an hour of creating them, and thus most success rates are close to 100%, providing no measurable differences when in fact differences between conditions may be present. In their first session, participants initially practiced creating and re-entering passwords for two fictitious accounts, a blog and an online gaming account. This was used to explain the experimental process and familiarize participants with the system. The practice data was discarded and participants did not need to remember these passwords later on. Next, participants created and re-entered PCCP passwords for six fictitious accounts (library, email, bank, online dating, instant messenger, and work). In their second session, participants tried to re-enter these same six passwords. The experiment used a custom stand-alone J# application running on a Windows desktop computer. A set of 465 images was used, and no images were repeated between or within passwords for a given user. The small and large image conditions shared the same images except that they were displayed at different resolutions. Figure 1 shows the user interface for creating passwords with the two different image sizes. The size of the viewport during password creation was kept consistent at 75 × 75 pixels across all conditions. Similarly, the tolerance square during all password re-entry phases was 19 × 19 for all conditions. There were five experiment phases over the two sessions. In the first session, participants completed the create, confirm, login and recall-1 phases. In the second session, participants com-
Table 3: Success rates on first attempt, within 3 attempts and multiple attempts (eventual success) per phase. First Attempt Within 3 Attempts Eventual Success Session 1 Session 2 Session 1 Session 2 Session 1 Session 2 Condition Login Recall-1 Recall-2 Login Recall-1 Recall-2 Login Recall-1 Recall-2 S5 91% 87% 25% 100% 95% 37% 100% 99% 42% S6 83% 89% 28% 99% 93% 40% 100% 93% 48% S7 92% 85% 18% 99% 91% 32% 100% 96% 42% L5 91% 82% 18% 100% 94% 33% 100% 94% 45% L6 94% 93% 18% 98% 97% 27% 100% 100% 36% L7 92% 82% 5% 100% 96% 14% 100% 100% 36%
p = 0.914
p = 0.643
Within 3 Attempts Session 2 Recall-2 p = 0.043 p = 0.017
6 5 4 3 2 0
1
2
3
4
successes
5
6
For durations, we took the mean of successful password entry times for each user. For errors, we again calculated the mean number of errors for successful password entries. To test hypotheses 1(a) and 1(b), statistical tests evaluating for main effects of number of click-points and image size were necessary. For statistical tests exploring the effect of number of click-points, we created three distributions grouped on the number of click-points and ignoring image size (i.e., one distribution combining S5 and L5 data, one including S6 and L6, and one including S7 and L7). Similarly, to explore the effect of image size, we created two distributions based solely on image size (i.e., one distribution including S5, S6, and S7, and one distribution including L5, L6, and L7).
1
RESULTS
In this section, we report on the effects of the independent variables (number of click-points and image size) on success rates, errors and durations of password entry. We used statistical analysis to determine whether differences in the data were likely to reflect actual differences between conditions or whether these might reasonably have occurred by chance. Specific tests will be described throughout the section as they are reported. In all cases, we regard a value of p < .05 as indicating statistical significance. In such cases there is less than a 5% probability that these results occurred by chance. In the tables reporting statistics, results in bold are statistically significant. Several figures in this section show boxplots to illustrate distributions. Boxplots show the median, the inner quartiles (as a box), and the outer quartiles (as whiskers). We report on each dependent variable individually, assessing each in relation to the two hypotheses. The phases from Session 1 (create, confirm, login, recall-1) provide a measure of usability in the short-term, while Session 2’s recall-2 phase provides a measure of usability after two weeks. Results for each hypothesis are summarized at the end of this section. Since each user had six separate passwords, we aggregated the data by users to ensure independence in the data. For success rates, we tabulated the number of successful password entries per user, giving a number between 0 and 6.
Number of Click-points Image Size
First Attempt Session 1 Login Recall-1 p = 0.906 p = 0.762
0
4.
Table 4: Regression tests for success rates for each phase, only the most relevant measure is reported.
successes
pleted the recall-2 phase, and were debriefed and compensated for their time. Descriptions of the experiment phases are given below. For each of the six accounts: Create Phase (Session 1): Participants selected points on images to create their password. Confirm Phase (Session 1): Participants re-entered the same password to make sure they remembered it. They could re-try as many times as necessary and could reset their password if it was forgotten. Login Phase (Session 1): Participants attempted to log in to the account using the same password. They could re-try as many times as necessary and could reset their password if it was forgotten. Once the user had created all their passwords: Recall-1 Phase (Session 1): Participants attempted to log in to each account in a shuffled order. Multiple attempts were allowed and participants could say they had forgotten a password to move to the next account. Recall-2 Phase (Session 2): Two weeks later, participants attempted to log in to their accounts in the same shuffled order. Multiple attempts were allowed and participants had the option of saying they had forgotten a password to move to the next account.
5
6
7
Click-points
451x331
800x600
Image Size
Figure 2: Recall-2 number of successes per user by click-points (left) and by image size (right).
4.1
Success Rates
We report success rates at three different levels: first time success, success within three attempts, and eventual success. First time success occurs when the password is entered correctly on the first attempt, with no mistakes or restarts. Success rates within three attempts indicate that fewer than three mistakes or restarts occurred. Eventual success rates indicate that the participant made multiple attempts, but was eventually successful. Mistakes occur when the participant presses the Login button but the password entry is
Table 5: Mean times in seconds and two-way ANOVA results comparing all 6 conditions for each phase. Session 1 Session 2 Condition Create (s) Confirm (s) Login (s) Recall-1 (s) Recall-2 (s) S5 66.9 21.2 16.1 21.5 50.5 S6 109.1 23.3 19.6 20.9 61.5 S7 81.1 28.6 20.8 25.0 75.1 L5 106.2 24.1 18.1 19.3 74.3 L6 103.8 30.2 20.8 23.7 90.5 L7 95.1 32.7 22.0 27.9 81.0 Number of F (2, 76) = 0.99, F(2, 76) = 4.56 F(2, 76) = 5.46 F (2, 76) = 2.40 F (2, 57) = 0.98 Click-points p = 0.375 p = 0.013 p = 0.006 p = 0.097 p = 0.382 Image Size F (1, 76) = 1.68 F(1, 76) = 4.39 F (1, 76) = 1.73 F (1, 76) = 0.24 F (1, 57) = 3.51 p = 0.200 p = 0.039 p = 0.193 p = 0.623 p = 0.066
200 150 100 50
50
100
seconds
150
200
Hypothesis 2: Wilcoxon tests showed no significant differences between S6 and L5 in any phase. Similarly, no significant differences in success rates were found between S7 and L6. Therefore, we have no evidence that having a larger image or more click-points had a larger impact on participants’ ability to remember their passwords, offering no support for hypothesis 2.
seconds
incorrect. Restarts occur when the participant presses the Reset button midway through password entry and restarts password entry. They are analogous to pressing delete while entering text, except that PCCP’s implicit feedback helps users detect and correct mistakes during login. Success rates were examined for the login, recall-1 and recall-2 phases. For hypotheses 1(a) and 1(b), linear regressions were used to look for significant effects of number of click-points and image size. In hypothesis 2, we used Wilcoxon (Mann-Whitney) tests to compare the distributions of the conditions with similar levels of security. Wilcoxon tests are similar to independent sample t-tests, but make no assumptions about the distributions of the compared samples, which is appropriate to the count data in these individual conditions. During the first session (login and recall-1), we consider success on first attempt to be the most important measure of success since users’ memory of the password will still be fresh. For recall-2, occurring after two weeks, we consider success within 3 attempts as the most appropriate measure since it most closely reflects account lockout practices for real systems. Results of statistical tests in this section are based these two choices. Table 3 reports success rates for the login, recall-1 and recall-2 phases. Success rates were very high in Session 1, indicating that participants were very successful at remembering their passwords after a short time period. Success rates after two weeks were much lower, reflecting the difficulty of the memory task. For clarity, Table 3 shows percentages, but the statistical tests were based on the count of successes per user over the six accounts, yielding a number from 0 to 6. Figure 4 shows boxplots indicating the ranges of these counts, distinguishing the different ranges by both click-points and image sizes. Table 4 shows the results of statistical tests using regression to determine whether the differences between the ranges might have occurred by chance. Hypothesis 1(a): Table 4 shows that in Session 1, neither the login or recall-1 phases showed any significant effects for the number of click-points. For recall-2, there was a significant effect of number of click-points (p = 0.043) when considering success within three attempts. This evidence supports hypothesis 1(a) with respect to success rates. Hypothesis 1(b): As shown in Table 4, varying the image size did not lead to any significant effects in the login or recall-1 phases. In the recall-2 phase, there was a significant effect of image size (p = 0.017). This evidence supports hypothesis 1(b) with respect to success rates.
5
6 Click-points
7
451x331
800x600
Image Size
Figure 3: Recall-2 times per user by click-points (left) and by image size (right). Table 6: t-tests for times: Hypothesis 2 Session Phase S6 vs. L5 S7 vs. L6 Create t(25) = 0.108 t(16) = −1.426 p = 0.915 p = 0.173 Confirm t(23) = −0.319 t(24) = −0.362 p = 0.753 p = 0.720 Session 1 Login t(26) = 1.058 t(15) = 0.018 p = 0.300 p = 0.986 Recall-1 t(14) = 0.851 t(21) = 0.303 p = 0.409 p = 0.765 Session 2 Recall-2 t(8) = −0.790 t(2) = −0.049 p = 0.453 p = 0.965
4.2
Times
Times were measured for each password entry from when the first image appeared on the screen until the participant successfully logged in. This included the time to enter their username, as well as any time making mistakes (pressing the login button and having the system say that the password is incorrect) or resulting from restarts (analogous to pressing the backspace key when entering a text password). All eventually successful password attempts were included
Participants in all conditions made very few errors when entering their passwords during Session 1. For the confirm, login and recall-1 phases, the mean number of errors per account for each phase was less than 1 (Table 7). After two weeks (recall-2), participants made many more errors, as reflected in means ranging between 1.08 and 4.88 errors. This contributed to the longer recall-2 times seen in Section 4.2. The boxplots in Figure 4 show the mean number of errors per user in the recall-2 phase. Hypothesis 1(a): Kruskal-Wallis tests showed no effect of number of click-points on errors in any phase, therefore offering no support for hypothesis 1(a). Hypothesis 1(b): In Session 1, increasing the image size had no significant effect on errors. However, there was a significant effect of image size (χ2 (1, n = 63) = 8.846, p = 0.003) in the recall-2 phase, indicating that having larger images caused participants to make more errors after two weeks. This result supports hypothesis 1(b), which stated that increasing image size would decrease usability. Hypothesis 2: Wilcoxon tests were used to compare the number of errors between S6 and L5 and between S7 and L6. Results showed no significant differences in any phases, providing no evidence to support hypothesis 2.
10 8 6
errors
2 0 5
6 Click-points
7
451x331
800x600
Image Size
Figure 4: Recall-2 number of errors per user by click-points (left) and by image size (right).
4.3
Table 7: Mean number of errors per phase. Session 1 Session 2 Condition Confirm Login Recall-1 Recall-2 S5 0.43 0.17 0.49 1.33 S6 0.28 0.29 0.05 1.08 S7 0.35 0.11 0.33 2.40 L5 0.45 0.10 0.12 1.79 L6 0.35 0.10 0.17 4.88 L7 0.75 0.10 0.48 4.28
4.4
4
6 4 0
2
errors
8
10
in the time calculations. We ran two-way ANOVAs to examine the main effects of number of click-points and image size. ANOVAs compare variance of the means for multiple samples and identify whether any of the samples are likely to come from different distributions. We used independent samples t-tests to test for significant differences in times between S6 and L5, and between S7 and L6. These tests compare variance of the means between two distributions. Mean times for each phase are reported in Table 5 and the distributions for recall-2 are seen in Figure 3. No clear pattern emerges in the mean times taken to create passwords, but a general increase in median times can be seen in other phases as more click-points or larger images are used. As should be expected, participants took much longer to reenter their passwords after two weeks (recall-2), but as intended, this allows comparison between conditions. Table 5 also displays the two-way ANOVA results for main effects of number of click-points and image size. Hypothesis 1(a): As seen in Table 5, only the confirm and login phases show statistically significant differences for number of click-points. These duration results provide little evidence to support hypothesis 1(a). Hypothesis 1(b): During recall-2, small increases in median times can be seen in Figure 3 as larger images are used. The only statistically significant effect of image size is seen in the confirm phase. These results offer very little evidence that image size affects time for password entry, and do not support hypothesis 1(b). Hypothesis 2: As shown in Table 6, no significant differences in durations were seen for S6 vs. L5 or for S7 vs. L6. Participants in conditions with comparable theoretical password spaces could create and recall their passwords equally quickly. We therefore found no evidence to support hypothesis 2 with respect to times.
Errors
An error was recorded every time a participant restarted their password attempt or failed to login because their password was incorrect. Since error distributions were nonnormal, we used several non-parametric tests for analysis. When comparing across all conditions, we ran Kruskal-Wallis tests (conventionally reported as χ2 ), which are similar to ANOVAs, but used when the distribution of the samples is skewed, as is common with error counts. When comparing two specific conditions, we conducted Wilcoxon (MannWhitney) tests to check for significant differences.
Summary of Results
We chose three measures of usability: success rates, times and number of errors. As we describe above, phases from the first session (create, confirm, login, and recall-1) use success on first attempt as the measure of success. Recall-2 uses success within 3-attempts instead. Times and errors include all activity until successful login. Hypothesis 1(a): Increasing the number of click-points will decrease usability. We found partial support for hypothesis 1(a). Although several results indicate a trend towards decreased usability with additional click-points, few statistically significant results were found. The statistically significant differences were in the recall-2 success rates, and in the times taken to confirm and login with passwords. Hypothesis 1(b): Increasing the size of the image will decrease usability. We found evidence supporting hypothesis 1(b). Significant effects of image size were seen in the recall-2 phase for both successes and errors. Users with large images had lower success rates and made more errors than those with small images. A similar trend was seen in recall-2 time results, but statistical tests were not significant. Hypothesis 2: For conditions with approximately comparable theoretical password spaces, the condition with the larger image size will have better usability. There were no significant differences for success rates, times, or number of errors. Our results provide no support for hypothesis 2.
J(9) on all MPCCP images with all passwords scaled to 451×311 1.5 ●
1.0
● ● ●
● ● ●
● ● ●
●
1.0 ●
●
●
● ● ● ● ●
●
●
●
0.5
●
J(9)
●
● ●
●
●
0.5
0.0
alphamat bangles bento busymap canal cars cdcovers chinatown classroom climb ducks eastereggs faces fallendown goldenpigs harbour ispy monopoly mural noticeboard paperclips philadelphia pinkmap pool porch smarties statue teapots tribal truck
0.0
Figure 5: J-statistics for distributions of 5, 6, or 7 click-points. Data from the larger image is scaled to allow for aggregation.
5.
451×331 800×600 Scaled
CLICK-POINT CLUSTERING
During PCCP password creation, users pressed the shuffle button when they were unable or unwilling to select a click-point within the currently highlighted viewport. We expect fewer shuffles to lead to more randomly distributed passwords, and hence greater security. In this study, there was large variability in the number of shuffles but no clear pattern emerged. The median number of shuffles per password for all conditions is less than five, indicating that most participants pressed the shuffle button less than once per image (passwords consisted of between 5 and 7 images). Passwords should be as random as possible while still maintaining memorability. Clustering of click-points on an image across users creates what are known as hotspots. Attackers who can determine likely hotspots (through image analysis or by gathering a sample of passwords from even a small number of people [29]) would be better positioned to launch an effective dictionary guessing attack. Ideally, a system would minimize the occurrence of hotspots. PCCP attempts to accomplish this through the randomly-positioned viewport, however, users may shuffle the viewport to find a memorable location. We explored whether either image size or number of click-points had an effect on user choice. To analyze the randomness and clustering of our twodimensional spatial data, we turned to point pattern analysis [13] commonly used in biology and earth sciences. Our analysis used spatstat [2], a spatial statistics package for the R programming language. We used the J-statistic [27] as a measure of click-point clustering on a subset of images for which we had sufficient data. Our system ensured that 30 of the images were shown to every participant, giving enough data points for analysis on these particular images. To measure the clustering of points in a dataset, the J-statistic combines nearestneighbour calculations and empty-space measures for a given radius r. When J(r) = 0, it indicates that all points cluster at the same location. When J(r) = 1, the points are randomly dispersed across the space. Finally, when J(r) > 1, the points are uniformly distributed. For passwords, we want results closer to J(r) = 1 since this would be least predictable by attackers. We examined clustering at J(9). A radius of 9 approximates the size of the 19 × 19 tolerance squares used by our system during password re-entry. Figure 5 shows the level of clustering for the 30 images, with image names on the x-axis. This figure illustrates the
alphamat bangles bento busymap canal cars cdcovers chinatown classroom climb ducks eastereggs faces fallendown goldenpigs harbour ispy monopoly mural noticeboard paperclips philadelphia pinkmap pool porch smarties statue teapots tribal truck
J(9)
●
●
●
J(9) on all MPCCP images with all passwords 1.5
5 click−points 6 click−points 7 click−points
Figure 6: J-statistic for distributions of small and large images. Data from the larger images is scaled to allow generation of comparable J-statistics.
effects of the number of click-points on clustering. Points on each line contain statistics for passwords created using either 5, 6, or 7 click-points. The J-statistic for each image is distinct; the connecting lines are only included for readability. As with earlier analysis in this paper, data from the small (451 × 331) and large (800 × 600) images are grouped together based on the number of click-points per password. For example, the 5 click-point line represents all passwords containing 5 click-points regardless of whether they were created on small or large images. The point coordinates on the large images are re-scaled to the coordinate system of the small image so that all data is presented at 451× 331 dimensions. This aligns features on the small and large versions of the same images. The lines on the graph do not show any consistent relationship between each other. To our knowledge, there is no statistical test to compare sets of J-statistics to each other. If we regard the data as categorical, we can identify six categories stemming from the possible orderings: 5-6-7, 5-7-6, 6-5-7, 6-7-5, 7-5-6, 7-65. For example, in Figure 5 the alphamat image falls in the 5-7-6 category because J(9) for 5 click-points is larger than J(9) for 7 click-points, which is larger than J(9) for 6 clickpoints. We can then apply a chi-squared test between the observed results and the expected results (equal probability for each category). This test shows no significant differences (χ2 (5, n = 60) = 5.675, p = 0.339). We therefore find no evidence for a difference in clustering between the different numbers of click-points. Figure 6 shows the level of clustering for the 30 images, distinguishing the effects of image size. Each line contains the statistics for passwords created on either the small or large images. For each of the two cases, data from 5, 6, and 7 click-points are combined. In other words, all passwords created on large images (regardless of how many click-points) are grouped together, and all passwords created on small images (regardless of how many click-points) form a second group. The data from the large images are again scaled to ensure comparability of the J-statistic. For most images, the graph indicates that the larger images have less clustering (J(9) closer to 1) than the smaller images. If we regard the data as categorical, we could distinguish two categories representing whether the small or large image size has stronger clustering. We applied a chisquared test between the observed results and the expected results (equal probability for each category). This test shows
a significant difference in clustering for the small and large images (χ2 (1, n = 60) = 9.603, p = 0.002), indicating that larger images have significantly less clustering. In summary, from Figure 5 it appears that additional click-points do not lead to user behaviour resulting in more clustering. However, larger images appear to influence user choice towards less clustering. This is probably due to the relatively smaller size of the viewport on the larger images. This result suggests that PCCP’s shuffle mechanism and viewport (if kept at the same size) is more effective in reducing clustering, and therefore promoting security, when used with larger images.
6.
DISCUSSION
We did not see large differences in how the number of click-points and image size affected usability. We expected that increasing the image size would have little or no effect on usability and memorability but we found that it had a similar effect to increasing the number of click-points. This presents an opportunity, suggesting that other considerations can be taken into account when increasing security. In a situation where choosing a click-point is comparatively difficult (as for a person with a poor fine motor control), this might be accommodated by having fewer clickpoints, but larger images. More click-points might be appropriate in a situation where screen size was limited, such as on a mobile device. The equivalent demands on usability when increasing security thus give increased flexibility in design. The conditions under which participants created and used their passwords are clearly artificial. In real life, it is extremely unlikely that a user would create six passwords in a row, then not see them again for two weeks, until they tried to log into all six accounts. The design of our study was meant to emphasize differences between the six conditions by making the task harder. The results of the study for the create, confirm, and login phases are similar to results seen in an earlier study of PCCP [5] and are consistently good, with only small differences between conditions. Further work is needed to confirm real-life usability. We have developed a web-based infrastructure that will allow us to conduct such tests in the near future. Table 8: Image sizes required, by space and clicks. Bits Clicks X(pixels) Y(pixels) X(cm) Y(cm) 52 6 442 332 11 9 52 5 806 605 21 16 52 4 1986 1489 51 38 52 3 8916 6687 229 171 52 2 179727 134795 4608 3456 62 6 788 591 20 15 62 5 1613 1210 41 31 62 4 4723 3542 121 91 62 3 28305 21229 726 544 62 2 1016688 762516 26069 19552
Multiple passwords are an important issue in authentication. Users typically have many different accounts and are asked to remember many different passwords [16]. This places an increased memory burden on users, and can lead to security and usability problems such as forgetting passwords, and confusing passwords across accounts [17]. Re-
membering a password for one account can disrupt the memory of a password for another account. This psychological phenomenon is known as interference [1]. In our study, participants each created six passwords, each of which was only tenuously linked to a user account. These accounts (library, email, bank, blog, online dating, instant messenger, and work) were denoted only by coloured banners on the login screen (see Figure 1). Although we attempted to emphasize to the user that each account was distinct, there was no practical difference between them. In real life, accounts would be separated from each other by appearance of the website, or created at different times. Participants likely had a hard time distinguishing their passwords from each other, and this interference might have led to more difficulty in remembering them after two weeks. Although our study focused on several specific configurations of PCCP, it is important to consider the general underlying principles involved. Image Size: The size of the images shown in each password seems to relate to several human factors. The user likely responds to the appearance of the image with a quick visual survey of the image. While principles of visual attention apply to this survey, the nature of the survey may change with familiarity, or even with exposure to other images or events that relate to the image. The human visual system involves several approaches, including taking in the overall impression, and responding to various attractors. Our initial speculation was that these might be the dominant factors, and we did not expect them to vary much with image size. For closer inspection of an image, however, the eye will be directed to specific parts of the image. Such close visual inspection requires high acuity vision using the fovea, the area of the retina with a high density of photoreceptor cells [15]. The size of the fovea limits foveal vision to an angle of approximately 1◦ within the direct line to the target of interest. At a normal viewing distance for a computer screen, say 60cm, this results in sharp vision over an area of approximately 4cm2 . The size of the image, and the number of attractors, will then determine the number of foveal areas the user will inspect, and the distance of the saccades as they move from one target to another will also be a factor. Several factors will affect how PCCP users survey an image. PCCP is a cued-recall scheme, so users will be looking for cues to remind them where to click. PCCP also gives implicit feedback with each image about the previous click, by displaying the correct image if user choose the correct clickpoint. This means that the user will be assessing whether or not the current image is familiar to them. Then, once users have recognized the image and found their click-point, they must position the cursor correctly using a mouse, touchpad or other pointing device. The time taken to position the cursor may be predicted by Fitts’ Law, which determines targeting time from the distance and target size [21]. However, we typically observe users moving the cursor to follow their gaze as they examine the image, so the final movement to a click-point is typically very short. Click-points: The number of click-points in a PCCP password requires a repetition of all the elements involved in finding and clicking on a single point. We initially assumed this repetition would make the number of click-points a more important factor than the size of the image in determining the usability, but the study results did not support this. In
a pure-recall system, we would expect to see serial memory effects, which cause people to better remember the items at the beginning and end of an ordered list. With PCCP’s cued-recall, however, we expect milder serial memory effects, because participants respond to each picture as an individual cue. However, it is certainly possible that users begin to learn the pattern of click-points and anticipate where to focus their gaze, and move their cursor. This anticipation may reduce the work needed per image in ways that have not yet been fully explored. Table 9: Click numbers required, by space and size. Bits 52 52 52 52 52 62 62 62 62 62
X(pixels) 800 451 320 240 80 800 451 320 240 80
Y(pixels) 600 331 480 320 120 600 331 480 320 120
Tolerance 19 19 38 38 38 19 19 38 38 38
Clicks 5 6 8 9 19 6 7 9 11 23
Alternative Configurations: It appears that factors such as increasing the number of click-points or image size balance each other out, at least for the settings in our study. To consider the general underlying principles, we might speculate about more extreme possibilities. In our study, the two image sizes used were 451 × 331 pixels and 800 × 600 pixels. The tolerance region of the scheme was 19 × 19 pixels, which meant that the images had approximately 414 and 1330 click areas distinguishable to the system, respectively. Our LCD display measured 43cm (17in) diagonally with a resolution of 1280 × 1024 pixels. The small image measured about 12cm × 9cm, or 84cm2 , and the large image about 21cm × 16cm or 336cm2 . Our study showed that users can cope with inspecting and selecting click-points on images of both sizes within a reasonable amount of time: mean login times were approximately 20 seconds, including entry of username and all click-points. In our S6 and L5 conditions, the theoretical password space is approximately 52 bits. In S7 and L6, it is about 62 bits. Knowing that the image sizes in these conditions were usable, we explore larger sizes in order to decrease the number of click-points while keeping the password space the same. Table 8 shows some possibilities. For example, even requiring only 3 clicks and keeping the aspect ratio the same would require an image size of 8916 × 6687 pixels for 52 bits, and 28305×21229 pixels for 62 bits. These would seem to be unreasonable sizes for graphical password images, and would involve a very large number of areas to be inspected. As the number of click-point required decreases, the size of the images implied must grow exponentially, and quickly reaches the bounds of usability. We do navigate on very large virtual displays when using cartographic browsers such as Google Earth. This is only manageable, however, through the use of the zoom and pan capabilities, and so the interaction in fact involves a number of clicks.
Implications for Mobile Devices: Our participants managed well with passwords of 5, 6, and 7 click-points in length, so an alternative exploration might be to consider more click points, and allow the image size to be reduced while still maintaining a large password space. Table 9 shows possibilities, using typical small sizes on mobile devices. For example, a small mobile phone might have 120 × 80 pixels, whereas a Blackberry Curve 8300 has 320× 240 pixels, while the Blackberry Bold and the Apple iPhone have 480 × 320 pixels. Mobile devices sometimes involve a touchscreen instead of a stylus, and often use a dense pixel pitch so images appear physically smaller than the equivalent dimensions on a computer screen. In the table, we accommodate this by using a tolerance region for the mobile devices of 38 × 38: the size of square onscreen keyboard elements on an iPhone. For the iPhone screen, this would require 8 clicks for a 52 bit password space. These numbers seem potentially acceptable, especially as we frequently type words of that many characters. This suggests that a graphical password scheme such as PCCP might be usable on mobile devices. The small screens will not be compatible with the current viewport because its current size highlights too much of the image to effectively reduce clustering. We are currently exploring a redesigned viewport mechanism. The increasing use of mobile devices for secure online transactions indicates a need for more secure passwords than simple screen unlock mechanisms, and we believe a system such as PCCP has potential for both usability and security.
7.
CONCLUSION
In this paper, we explored the issue of how increasing the security of a click-based graphical password scheme would affect usability and memorability. We tested PCCP with different parameters in order to evaluate its usability when the theoretical password space is increased. We found that increasing the number of click-points or increasing the image size both have usability and memorability impacts. While varying parameters to hold constant the size of the theoretical password space, we found no evidence of differences between configurations varying the number of click-points and image size. Additionally, we explored the effects of number of click-points and image size on user behaviour resulting in clustering of click-points. We found no evidence that the number of click-points had an effect, but it appeared that larger images led to less clustering. These results have important implications for practical configuration of graphical password schemes in various contexts. For example, the results suggest that for mobile devices with small screens, it might be possible to increase security by using smaller images and more click-points while retaining usability and memorability. Conversely, larger images appear to lead to less clustering, suggesting an issue that should be considered in future research.
8.
ACKNOWLEDGMENTS
The second author acknowledges NSERC Postgraduate Scholarship funding. The fourth author is Canada Research Chair in Internet Authentication and Computer Security, and acknowledges NSERC funding of this chair, a Discovery Grant, and a Discovery Accelerator Supplement. The fifth author acknowledges funding of an NSERC Discovery Grant. Partial funding from the NSERC Internetworked Systems Security Network (ISSNet) is also acknowledged.
9.
REFERENCES
[1] M. Anderson and J. Neely. Interference and inhibition in memory retrieval. In E. Bjork and R. Bjork, editors, Handbook of Perception and Cognition, pages 237–313. Academic Press, 1996. [2] A. Baddeley and R. Turner. R. Spatstat: An R package for analyzing spatial point patterns. Journal of Statistical Software, 12(6):1–42, 2005. [3] K. Bicakci, M. Yuceel, B. Erdeniz, H. Gurbaslar, and N. Atalay. Graphical Passwords as Browser Extension: Implementation and Usability Study. In Third IFIP WG 11.11 International Conference on Trust Management, Purdue University, USA, June 2009. [4] R. Biddle, S. Chiasson, and P. C. van Oorschot. Graphical passwords: Learning from the first generation. Technical Report TR-09-09, Computer Science, Carleton University, www.scs.carleton.ca/research/tech_reports, 2009. [5] S. Chiasson, A. Forget, R. Biddle, and P. C. van Oorschot. Influencing users towards better passwords: Persuasive Cued Click-Points. In Human Computer Interaction (HCI), British Computer Society, 2008. [6] S. Chiasson, A. Forget, R. Biddle, and P. C. van Oorschot. User interface design affects security: Patterns in click-based graphical passwords. International Journal of Information Security, 8(5), 2009. [7] S. Chiasson, P. C. van Oorschot, and R. Biddle. A usability study and critique of two password managers. In 15th USENIX Security Symposium. Usenix, August 2006. [8] R. G. Crowder and R. L. Greene. Serial Learning: Cognition and Behaviour. In E. Tulving and F. I. Craik, editors, The Oxford Handbook of Memory, chapter 8. Oxford University Press, 2000. [9] D. Davis, F. Monrose, and M. Reiter. On user choice in graphical password schemes. In 13th USENIX Security Symposium, August 2004. [10] A. De Angeli, L. Coventry, G. Johnson, and K. Renaud. Is a picture really worth a thousand words? Exploring the feasibility of graphical authentication systems. International Journal of Human-Computer Studies, 63(1-2):128–152, 2005. [11] S. Designer. John the Ripper password cracker. http://www.openwall.com/john/. [12] R. Dhamija and A. Perrig. D´ej` a Vu: A user study using images for authentication. In 9th USENIX Security Symposium, August 2000. [13] P. Diggle. Statistical Analysis of Spatial Point Patterns. Academic Press: New York, NY, 1983. [14] A. Dirik, N. Menon, and J. Birget. Modeling user choice in the Passpoints graphical password scheme. In 3rd ACM Conference on Symposium on Usable Privacy and Security (SOUPS), July 2007. [15] A. Duchowski. Eye Tracking Methodology: Theory and Practice. Springer, 2nd edition, 2007. [16] D. Florencio and C. Herley. A large-scale study of WWW password habits. In 16th ACM International World Wide Web Conference (WWW), May 2007. [17] S. Gaw and E. Felten. Password management strategies for online accounts. In 2nd Symposium On Usable Privacy and Security (SOUPS), July 2006.
[18] K. Golofit. Click passwords under investigation. In 12th European Symposium On Research In Computer Security (ESORICS), LNCS 4734, September 2007. [19] I. Jermyn, A. Mayer, F. Monrose, M. Reiter, and A. Rubin. The design and analysis of graphical passwords. In 8th USENIX Security Symposium, August 1999. [20] L. Jones, A. Anton, and J. Earp. Towards understanding user perceptions of authentication technologies. In ACM Workshop on Privacy in Electric Society, 2007. [21] I. S. MacKenzie. Fitts’ law as a research and design tool in human-computer interaction. Human-Computer Interaction, 7(1):91–139, 1992. [22] D. Nelson, V. Reed, and J. Walling. Pictorial Superiority Effect. Journal of Experimental Psychology: Human Learning and Memory, 2(5):523–528, 1976. [23] K. Renaud. Guidelines for designing graphical authentication mechanism interfaces. International Journal of Information and Computer Security, 3(1):60 – 85, June 2009. [24] M. A. Sasse, S. Brostoff, and D. Weirich. Transforming the ‘weakest link’ – a human/computer interaction approach to usable and effective security. BT Technology Journal, 19(3):122–131, July 2001. [25] X. Suo, Y. Zhu, and G. Owen. Graphical passwords: A survey. In Annual Computer Security Applications Conference (ACSAC), December 2005. [26] H. Tao and C. Adams. Pass-Go: A proposal to improve the usability of graphical passwords. International Journal of Network Security, 7(2):273–292, 2008. [27] M. van Lieshout and A. Baddeley. A nonparametric measure of spatial interaction in point patterns. Statistica Neerlandica, 50(3):344–361, 1996. [28] P. van Oorschot, A. Salehi-Abari, and J. Thorpe. Purely automated attacks on passpoints-style graphical passwords. IEEE Trans. Info. Forensics and Security, 5(9):393–405, 2010. [29] P. van Oorschot and J. Thorpe. Exploiting predictability in click-based graphical passwords. Journal of Computer Security, to appear, 2011. [30] S. Wiedenbeck, J. Waters, J. Birget, A. Brodskiy, and N. Memon. PassPoints: Design and longitudinal evaluation of a graphical password system. International Journal of Human-Computer Studies, 63(1-2):102–127, 2005.