Exploring Web Search Results by Visually Specifying Utility Functions Orland Hoeber Department of Computer Science Memorial University of Newfoundland St. John’s, NL, Canada A1B 3X5
[email protected]
Abstract In general, Web search engines perform well for users whose information needs are well-defined. When searchers can provide specific terms that adequately describe the information they are seeking, the top search results are commonly very relevant. However, when users wish to explore a topic, little assistance is provided by Web search engines to help users in finding the information they seek. In this paper, a system that supports exploratory search through the visual specification of utility functions is presented. Users are able to recognize potentially relevant terms using a term frequency histogram, and can indicate their preferences for these in a visual manner. The search results are re-sorted based on the corresponding utility function; colour coding allows users to easily locate the selected terms within the search results list.
1. Introduction One of the primary focuses of Web search research has been on the process of matching a user-supplied query to Web document indices. Algorithms such as PageRank [3] and HITS [8] take advantage of the linked structure of the Web to produce a ranked list of documents that match the query. The fundamental premise is that if a user provides a query that accurately reflects their information needs, then the search results will contain many relevant documents. In general, Web search engines perform well when users’ information needs are well defined. However, difficulties arise for users who are unable to accurately describe their information needs. These situations occur when users have inadequate knowledge about their goals, or when their search tasks are inherently ambiguous. They will commonly submit tentative queries and explore the corresponding search results, seeking cues for what to do next [15]. The current generation of Web search engines provide little support for users in this exploratory
search process. There are no features to assist users in exploring the search results list, and little support is provided for users to refine their queries. Supporting users in such exploratory Web search situations requires a much higher degree of interaction than that provided by today’s Web search engines. Users need to be able to manipulate and explore the search results sets, experiment with potentially relevant terms, and easily modify and refine their queries as they seek to craft an accurate description of their search goal. Throughout these tasks, exploratory searchers continue to learn about what it is that they are seeking, as well as identify details about what they are not looking for. In previous work, WordBars was developed as a means for supporting users’ Web search tasks of query refinement and search results exploration [6]. This work was subsequently extended in WordBars2, providing a visual representation of where the terms of interest to the user were located in each document surrogate [7]. In this paper, a further extension of the WordBars system is described. WordBars3 allows users to visually assign positive and negative weights to frequently appearing terms from the titles and snippets of the top search results, resulting in the specification of a utility function. The search results are automatically re-sorted based on this utility function, and the use of the selected relevant and non-relevant terms are highlighted within the search results list (see Figure 1). This new functionality in WordBars3 supports the specific needs of exploratory Web searchers. Users can readily recognize terms of interest from the term frequency histogram, assigning positive weights to the terms that are relevant and negative weights to the terms that are not relevant. The top search results are automatically re-sorted, bringing those that use the relevant terms to the top, and pushing those that use the non-relevant terms to the bottom. Users can readily identify the weighted terms via colourcoding within the search results list. These features operate in an interactive manner, allowing modifications to be easily made to the utility functions, and the outcomes of
preference relation, resulting in a ranking of items or options based on the preferences of a user. Such a relation can easily be transformed into a weighting method. For example, Wong and Yao showed that Rocchio’s method for relevance feedback in a vector-based (weighted) model [10] essentially provides the specification of a utility function [18]. In WordBars3, users are able to explicitly specify a utility function in an interactive and visual manner, using the frequently appearing terms from the top document surrogates in the search results set. This utility function produces a re-sorting of the search results based on preferences for term relevance with respect to the user’s information need.
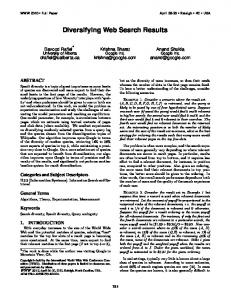
2.2 Figure 1. WordBars3 supports the visual specification of a utility function, producing re-sorting and term highlighting within the search results set.
such modifications to be determined within the search results set. Users can take advantage of the features of WordBars3 to learn how potentially relevant terms are being used within the context of their current search. At any time, they can refine their queries, adding relevant terms and removing non-relevant terms, as they move toward more accurate descriptions of their information needs. The remainder of this paper is organized as follows: In the following section, an overview of the use of utility functions in information retrieval is provided, along with a description of recent interfaces for supporting exploratory search. Section 3 describes the specific features of WordBars3. Conclusions and an overview of future work are provided in Section 4.
2. Background 2.1
Exploratory Search Interfaces
A primary characteristic of an exploratory search interface is the support provided for user tasks such as learning, investigating, and exploring. This is in contrast to traditional search interfaces that are primarily concerned with lookup tasks. Regardless of the type of search being performed, the primary objective of any search interface is to improve the search experience for the user. In a recent issue of the Communications of the ACM (April 2006, vol. 49, no. 4), a number of exploratory search interfaces were presented, dealing with search domains such as video, music, photo, and recipe libraries, personal information, social networks, document collections, and the Web. Although each interface focused on the specific needs for exploratory searching within the specific domain, common themes included the high degree of user interaction and the dynamic updating of the search results based on the interactive selections made by the users [15]. WordBars 3 also provides a high degree of user interaction and a dynamic updating of the search results representation. However, unlike many of these systems, the interactive and dynamic nature of WordBars3 is based on visualization within the search results list, and interactive re-sorting of the search results based on interests expressed by the users.
Utility Theory in Information Retrieval
Utility theory has been used in information retrieval research for many years, both as a means for discussing the use of weighted term indexing [4, 11] and as a method for supporting query formulation and relevance feedback [18]. In general, the goal is to take into consideration the potential value or utility of an element based on user preference. A primary outcome is that the search results can be ranked, such that those appearing at the top of the list have a higher utility for the user than those appearing at the bottom of the list. Fundamentally, one can define a utility function as a
3. WordBars3 Features 3.1
Meta-Search and Term Selection
WordBars3 operates as a meta-search engine, using the Web search results provided by the Google API [5]. For a given query, the system retrieves the top 100 search results. Each document surrogate consists of the title of the document, a snippet generated by Google showing the use of the search terms in the context of the document text, the URL of the document, as well as other descriptive information.
As specified in the original WordBars system, a term frequency histogram provides users with a visual indication of how often the most frequently appearing terms occur within the document surrogates. For each document surrogate in the search results set, the following steps are performed in order to generate corresponding term frequency vectors: 1. The title and snippet from each document surrogate in the search results subset are combined in a bag-ofwords approach resulting in a document descriptor for each document surrogate. 2. Stop words (commonly appearing terms with little descriptive value) and terms that contain less than three characters are eliminated from the document descriptors. 3. Porter’s stemming algorithm [9] is used to reduce all terms in the document descriptors to their stem (root) forms. 4. For each document descriptor, the frequency of each unique stem is counted and a term frequency vector is created to store this information. The outcome is that for each document surrogate dsi , a term frequency vector F~i = (fi1 , fi2 , · · · , fin ) is created, where fij is the frequency of the stemmed term j within the document surrogate dsi , and n is the total number of unique stems appearing in all the document surrogates processed. In addition to the generation of the term frequency vectors F~i , a single master vector is generated to represent the sum of the frequencies of the stems over all 100 document surrogates in the search results set: 100 100 100 X X X ~ =( M fi1 , fi2 , · · · , fin ) i=1
i=1
i=1
Term frequency is generally considered to be an inadequate measure of term importance in information retrieval research [13, 1]. However, its use here is not based on the full textual contents of the documents; only the title and snippet of the document surrogates as provided by Google are considered. The title is generally descriptive of the contents of the document, and the snippet contains other terms that are used in close proximity to the query terms. We have experimented with other information retrieval measures such as TF-IDF [13], but have found them to be sensitive to the relatively small number of document surrogates being considered and the limited amount of information present for each document surrogate.
3.2
Visual Representation of Term Information
Rather than providing a simple list of frequently appearing terms from the top search results, a term frequency histogram is generated to provide a visual representation of
Figure 2. The visual specification of the utility function is supported within the term frequency histogram.
this information. This histogram is produced by sorting the ~ and representing the frequencies of the top master vector M 30 terms (this limit is due to vertical space limitations in the interface). This gives users an impression of the relative frequencies of the commonly used terms within the title and snippet of the top search results; users can see this frequency information without having to read it. The term frequency histogram is vertically-oriented, and colour coded. Both the size and colour of the bars are used to represent the frequency of the terms. The colour scale was selected to vary on both the yellow-blue colour channel and the luminance channel, resulting in a perceptually continuous colour scale [14]. Frequently appearing terms are represented using large, dark blue bars; infrequent terms are represented using small, light yellow bars. Although the stemmed versions of the words provide the basis for the term frequency histogram, the term labels use the word format of the first instance of each stem appearing in the search results set.
3.3
Visual Specification of Utility Function
One of the primary benefits WordBars3 provides for exploratory searching is the ability for users to visually specify a utility function based on commonly appearing terms provided by the term frequency histogram. Beside each frequency bar, a set of controls are provided to allow users to visually indicate the relevance or non-relevance of specific terms that appear in the top search results (see Figure 2). By default, a neutral relevance is selected for each term, as indicated by a gray circle in the middle of these controls. To the left of the gray circle are two “positive” icons, indicating strongly positive relevance (the large positive icon)
and weakly positive relevance (the small positive icon). To the right of the gray circle are two “negative” icons, indicating strongly negative relevance (the large negative icon) and weakly negative relevance (the small negative icon). Initially, these positive and negative relevance icons are displayed using subtle outlines, following Tufte’s principle of using the smallest effective difference to represent visual elements in a display [12]. If the user clicks on any of these icons, the interior is filled with colour (green for the positive icons, and red for the negative icons). At the same time, a box with a corresponding shade of the positive or negative colour is placed around the histogram bar and term label to indicate its selection in the utility function. Two different shades of each colour are used for representing the strong and weak selections. As a result, the user can visually identify which terms have been selected as strongly positive, weakly positive, strongly negative, and weakly negative. The colours were selected to be easily decoded as positive and negative colours based on a traffic light metaphor. As a result of the user selecting various levels of positive and negative relevance among the terms in the histogram, a utility function is generated. This utility function takes the form of a utility vector: ~ = (u1 , u2 , · · · , un ) U where n is the total number of unique stems that are present in the search results set, and the utility index ui is given by: +2 if term i is selected as a strongly positive term +1 if term i is selected as a weakly positive term 0 if term i is not selected ui = −1 if term i is selected as a weakly negative term −2 if term i is selected as a strongly negative term Since only the top 30 stems are represented in the term fre~ may have nonquency histogram, at most 30 elements in U zero values.
3.4
Term Highlighting and Search Results ReSorting
~ is used in two The visually specified utility function U different ways to support users in their exploratory search tasks: highlighting the selected terms within the search results list, and re-sorting the search results based on the use of selected terms. As a result, users can visually identify the positive and negative terms within the document surrogates, and document surrogates that make frequent use of positive terms and infrequent use of negative terms are moved to the top of the search results list. As users specify utility functions using the controls in the term frequency histogram, the corresponding terms within
the search results list are highlighted using the same colour coding scheme as used in the histogram. This allows users to easily make the visual connection between their utility function and the terms appearing within the search results set. For each document surrogate dsi , a sort weight swi is computed to represent the importance of the document surrogate with respect to the user-specified utility function. This is achieved by calculating the dot product between the ~ and the term frequency vector F~i : utility function vector U swi
~ ~ = U P•n Fi = j=1 uj fij
The search results list is then re-sorted based on the sort weights swi , in descending order. The outcome is that document surrogates at the top of the list will make frequent use of the strongly positive terms, and the document surrogates at the bottom of the list will make frequent use of the strongly negative terms. This re-sorting calculation occurs fast enough so as to give the impression of an instantaneous re-organization of the search results based on the specification and modification of the utility function.
3.5
Interaction with WordBars3
As the search results are retrieved from the Google API, the document surrogates are automatically loaded into the document list window, and the term frequency histogram is updated as each document surrogate is processed. This has the effect of providing an animation of the growth and re-ranking of the terms used in the search results set. A video showing this animation, as well as a complete usage scenario, is available on the author’s Web site1 . Once data begins to be displayed in the term frequency histogram, the user can interact with this interface by either clicking on the utility function controls to make changes to the utility function, or double-clicking a term label to add or remove the term from the query. These simple interaction methods were chosen to reduce the learning curve associated with using WordBars3. Clicking on any of the utility function controls results in a visual indication of the positive or negative relevance value given to the selected term. The corresponding term is highlighted both in the histogram and in the search results list. The search results are instantly re-sorted based on the updated utility function. As a result, users can easily explore the search results based on the terms they feel are relevant to their information needs. Within WordBars3, the search results are provided in a list-based representation that is similar to that used by the major search engines. The document number from the original order of the search results provided by the Google API 1 http://www.cs.uregina.ca/
˜hoeber/WordBars3/
is included to highlight the effects of the re-sorting features. Clicking on any document surrogate will open that document in a new window, and will change the link colour from blue to purple (as per the de-facto standard for visited links in a Web page). This allows users to easily identify documents that have already been visited, even after the search results are subsequently re-sorted by modifying the utility function.
4. Conclusions and Future Work The human element is a fundamental part of exploratory searching. Tools that support exploratory searching should be designed to promote and enhance the cognitive abilities of the users. The term frequency histogram in WordBars3 allows users to recognize potentially relevant terms, rather than requiring that they remember them. Through the visual specification of the utility function, users can learn how the terms are being used in the top search results before committing to adding them to their query. The techniques used in WordBars3 were specifically designed to be easy to understand and operate. The use of the histogram and utility function controls require minimal training. There are no complex interactions required to interactively explore the search results and refine the query. Colour-coding is used to represent information within the interface, supporting the visual connection of related information between interface elements. All the interactive elements operate sufficiently fast to provide the illusion of the instantaneous updating of the interface. Since the term frequency histogram is generated based on the commonly appearing terms in the title and snippet of the top search results, if few of the search results are actually relevant to the user’s information needs, WordBars3 may not be able to assist in the task. However, a term frequency histogram containing few relevant terms provides an indication to users that their initial query needs to be refined manually. A further negative aspect of the system is that if many terms are used in the specification of the utility function, a large degree of colour coding is added to the search results list, producing visual noise. However, when only a few terms are selected in an interactive and exploratory manner, the highlighting of these terms within the search results list can be a very valuable feature. Due to the complexity of the interaction that occurs within an exploratory search interface, evaluating such systems is very challenging [16]. Plans are currently underway to evaluate this system both in a simulated setting [17] and in a controlled environment using realistic scenarios [2]. In addition, a number of future enhancements and experiments are planned. Only simple queries are currently supported; the histogram could be altered to include additional icons to support the specification of more complex queries. The
ability to personalize the search results based on the selection of past utility functions may improve search performance. There is a need for further experiments on methods for generating lists of potentially relevant search results based on document surrogates.
References [1] R. Baeza-Yates and B. Ribeiro-Neto. Modern Information Retrieval. Addison-Wesley, 1999. [2] P. Borlund. The IIR evaluation model: A framework for evaluation of interactive information retrieval systems. Information Research, 8(3), 2003. [3] S. Brin and L. Page. The anatomy of a large-scale hypertextual Web search engine. In Proceedings of the Seventh International World Wide Web Conference, 1998. [4] W. S. Cooper and M. E. Maron. Foundations of probabilistic and utility-theoretic indexing. Journal of the ACM, 25(1):67–80, 1978. [5] Google. Google web api. http://www.google.com/apis/. [6] O. Hoeber and X. D. Yang. Interactive Web information retrieval using WordBars. In Proceedings of the IEEE/WIC/ACM International Conference on Web Intelligence, 2006. [7] O. Hoeber and X. D. Yang. Visual support for exploration within Web search results lists. In Proceedings of the IEEE Information Visualization Conference, 2007. [8] J. M. Kleinberg. Authoritative sources in an hyperlinked environment. Journal of the ACM, 46(5):604–632, 1999. [9] M. Porter. An algorithm for suffix stripping. Program, 14(3), 1980. [10] J. J. Rocchio. Relevance feedback in information retrieval. In The SMART System - Experiments in Automatic Document Processing. Prentice Hall, 1971. [11] G. Salton and H. Wu. A term weighting model based on utility theory. In Proceedings of the ACM SIGIR Conference on Research and Development in Information Retrieval, 1980. [12] E. Tufte. Envisioning Information. Graphics Press, 1990. [13] C. J. van Rijsbergen. Information Retrieval. Butterworths, 1979. [14] C. Ware. Information Visualization: Perception for Design. Morgan Kaufmann, 2004. [15] R. W. White, B. Kules, S. M. Drucker, and m. c. schraefel. Supporting exploratory search. Communications of the ACM, 49(4):37–39, 2006. [16] R. W. White, G. Muresan, and G. Marchionini. Evaluating exploratory search systems. In Proceedings of the ACM SIGIR Workshop on Evaluating Exploratory Search Systems, 2006. [17] R. W. White, I. Ruthven, J. M. Jose, and C. J. van Rijsbergen. Evaluating implicit feedback models using searcher simulations. ACM Transactions on Information Systems, 23(3):325–361, 2006. [18] S. K. M. Wong and Y. Yao. Query formulation in linear retrieval models. Journal of the American Society for Information Science, 41(5):334–341, 1990.