EXPOSURE TO HIGH FREQUENCY ELECTROMAGNETIC FIELDS IN URBAN ENVIRONMENTS Daniele Trinchero, Riccardo Tascone, Guido Perrone Carlo Arnelli, Giorgio Roggia
Ivan Cerato, Aurelio Pellutié, Ivo Riccardi, Walter Sartor
CNR- IRITI and Dipartimento di Elettronica Politecnico di Torino, C.so Duca degli Abruzzi 24, I-10129 Torino, Italy email:
[email protected]
Area Fisica, Dipartimento di Cuneo, Agenzia Regionale Protezione Ambiente Piemonte, via Massimo d'Azeglio 4, I-12100 Cuneo, Italy email: Ivan Cerato [
[email protected]]
Abstract - Recently, the evaluation and estimation of the effective amount of electromagnetic field distribution in areas connected with human activities has grown in importance, in order to satisfy public and governmental requests of information [1] - [10]. Following a study performed by the Regional Agency for Environment Protection of Piedmont, in this paper a statistical comparison between different expositions in different kinds of inhabited areas is reported. I. INTRODUCTION This paper illustrates the experimental results obtained during an electromagnetic site survey campaign, devoted to monitor of the Radiofrequency Electromagnetic Background in urban and sub-urban environments. The mapping technique was applied to several urban and sub-urban areas, located in Italy, in the region of Cuneo, in the surroundings of Torino. Cuneo, the capital of the region, has got about 55000 inhabitants, with some emitters for mobile telecommunications installed inside the urban area. Some FM radio emitters are installed over the hills, not far from the city. An MW emitter is installed at about 2 kilometres from the city centre. For this reason, the city has been chosen to activate a monitoring activity, to produce maps of electric and magnetic field and to evaluate the average electromagnetic field distribution in the urban area. Once the monitoring operation was performed, some other municipalities in the region requested an analogous monitoring activity. On the basis of the results obtained during this monitoring activity, which is actually in progress, an interesting statistical evaluation between the measured results has been performed. The effective exposition due to different distributions of emitters: number, kind of deployment (inside or outside the urban area), type of service, has finally been evaluated and reported. II. MAPPING TECHNIQUE To evaluate the electromagnetic field background, initially we have analysed the spectral components of
the electromagnetic field, performing measurements in some reference points. The measurements were performed, according to the most important International Measuring Standards [11] - [15]. To simplify as much as possible the choice of the reference measuring points, a field prediction tool has been realised [16] - [17]. The tool is based on the application of the method of moments, to evaluate the average current distribution on the field source. Once the reference points have been chosen, narrow band measurement have been performed, for all the bands interested by the monitoring activity. From this operation we have deduced that the main field component is usually due to the TV/radio emitters, while the radio-telephonic signal becomes meaningful in the surroundings of mobile stations. The choice of the measuring points has been done in an automatic way, using an adequate software procedure; a suitable grid has been superimposed on the topographic map of the city, obtaining a coordinate system that defines univocally the measuring points. The standard grid step has been fixed to 50 metres. In various points the grid has been fitted, for example (concerning the electric field measurements) when the measured electric field was higher then the threshold of 1 V/m, or in the streets with high field gradients. In these cases, the step has been reduced to 10 metres. On the whole, we have chosen 2100 measuring points only in the capital of the region. When these points were located inside narrow streets, or courts, to suitably represent the field variation, more measurements have been performed. Measures were performed deploying the instrumentation at 1.80 metres, in the streets, inside the courts, in open spaces (squares, parks, gardens), but never inside buildings. The measuring errors were minimised, deploying the instrumentation at the necessary distance from conducting bodies and from the operators.
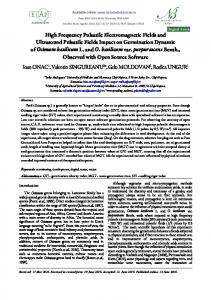
From this figure it is possible to evaluate the average field measured in the city, which is about 120 mV/m. In Fig.3 and Fig.4 an interesting comparison between the field distribution in a recent quarter and an historical quarter is represented. Two quarters with the same number of mobile radio stations have been chosen, in order to guarantee homogeneity. As it can be noticed, in the recent one the average electric field is higher, due to the presence of large streets and open spaces.
Number of samples Fk
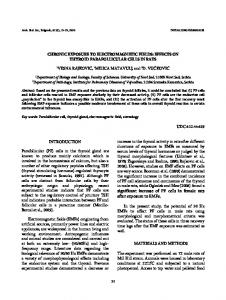
III. RESULTS The experimental results are reported in the included figures. Fig. 1 reports the electric field map measured in the city of Cuneo. As it can be expected, due to the lack of medium and high power emitters inside the urban area, the average electric field value is globally under the governmental limits [18] - [19]. In Italy, these limits recommend to maintain the electric field under the threshold of 6 V/m, in correspondence with inhabited areas. In Fig.2 the statistical distribution of the electric field measured in the same city is reported. Even if a field higher then 1 V/m has been locally measured, the analysis is restricted to the field comprised between 0 V/m and 1 V/m, because in this range an high percentage of samples are comprised. The field levels have been classified in classes of 50 mV/m. Fig.2 shows the statistical distribution of the electric field measured on an ideal grid of 5 metres, over the entire city. In ordinate the frequency Fk of each class is reported. Fk is defined as the ratio between the number of samples n k belonging to the k class and the total number of samples: Fk = n k/N.
0.4 0.3 0.2 0.1 0 0 0.1 0.2 0.3 0.4 0.5 0.6 0.7 0.8 0.9 Electric Field (V/m)
Figure 2 Electric field distribution in the city of Cuneo
Number of samples Fk
0.5 0.4 0.3 0.2 0.1 0 0 0.05 0.1 0.15 0.2 0.25 0.3 0.35 0.4 0.45 0.5 Electric Field (V/m)
Number of samlpes Fk
Figure 3 Electric Field distribution in a recent quarter of Cuneo 0.4 0.35 0.3 0.25 0.2 0.15 0.1 0.05 0 0
0.1
0.2
0.3
0.4
0.5
Electric Field (V/m)
Figure 1 Electric field distribution in the city of Cuneo
Figure 4 Electric Field distribution in an historical quarter of Cuneo
0.6
Fig. 5 reports the electric field map measured in the city of Bra, a city of about 20000 inhabitants. In this case, the average electric field background is lower, compared to the field measured in the city of Cuneo, due to the different deployment of FM and TV emitters, which are installed in remote positions from the urban area. In Fig.6 the statistical distribution of the electric field measured in the same city is reported. From this figure it is possible to evaluate the average field, which is about 90 mV/m. From a total of about ten urban areas analysed during the campaign, it was possible to estimate an average exposition of about 110 mV/m when the city was more than 45.000 inhabitants, and about 80 mV/m, when the city was less than 45.000 inhabitants.
A particular kind of exposition occurs in little urban and sub-urban areas, when radio and TV emitters are installed in the surroundings of civil buildings. As an example, Fig. 7 shows the electric field distribution measured in Guarene, a village of about 700 inhabitants. In this case, an average exposition level of about 1.5 V/m was measured.
Figure 7 Electric field distribution in the village of Guarene
Number of samples Fk
Figure 5 Electric field distribution in the city of Bra
0.4 0.3 0.2 0.1 0 0 0.1 0.2 0.3 0.4 0.5 0.6 0.7 0.8 0.9 Electric Field (V/m)
Figure 6 Electric field distribution in the city of Bra
IV. CONCLUSIONS The results reported here represent a little example of an important data-base, build in the last years by the Regional Agency for Environment Protection of Piedmont. The data-base collects several measures performed in different environments, comprising rural areas, urban and sub-urban regions. This bundersome activity has been simplified, thanks to a set of software tools developed by the Politecnico di Torino, devoted to the characterization of the field radiated by a great category of emitters. From the database it was possible to perform some statistical evaluation, concerning the average public exposition to the radio-frequency electromagnetic field. It will be very interesting, in the next years, to update the database, in order to make a comparison between the present and future field distribution, which will be definitely different, due to the exponential growth of radio-frequency emitters, and the increasing request of telecommunication services based on free-space links.
REFERENCES [1]
WHO, "Electromagnetic Fields and Public Health - Radiofrequency electromagnetic fields effect", Promemoria n.183, 1998.
[2]
M. Feliziani, “Environmental EM Characterization”, EMC Zurich 1999, vol. 2, pp. 139--144, February 16-18 1999.
[3]
G. d’Amore, L. Anglesio, A. Benedetto, M. Tasso, “Background ELF magnetic fields in a great urban area”, 2 nd Word Congress for Electricity and Magnetism in Biology and Medicine, 8-13 June, 1997.
[4]
American National Standard Institute, “American National Standard Safety Levels with Respect to Human Exposure to Radio Frequency Electromagnetic Fields, 300 kHz to 100 GHz”, no. ANSI C95.1-1982, 1982.
[5]
Institute of Electrical and Electronic Engineers, “Safety Levels with Respect to Human Exposure to Radio Frequency Electromagnetic Fields, 3 kHz to 100 GHz”, no. ANSI/IEEE C95.1-1991, 1991.
[6]
CENELEC, “Human exposure to electromagnetic fields - High frequency (10 kHz to 300 GHz)”, no. ENV 50166-2, Jan. 1995.
[7]
ICNIRP, “Guidelines for limiting exposure to time-varying electric, magnetic and electromagnetic fields (up to 300 GHz)”, Health Physics, vol. 74, no. 4, pp. 494--592, Apr. 1998.
[8]
Federal Communication Commission, “Guidelines for Evaluating the Environmental Effects of Radiofrequency Radiation”, no. FCC 96-326, August 1 1996.
[9]
C. Polk and E. Postow, Handbook of Biological Effects of Electromagnetic Fields, CRC Press, New York, 2nd edition, 1995.
[10] R. Kitchen, RF Radiation Safety Handbook , Butterworth-Heinemann Ltd, Oxford, 1995. [11] Institute of Electrical and Electronic Engineers, “IEEE Recommended Practice for an Electromagnetic Site Survey”, no. IEEE Std 473-1985, 1985, IEEE, New York, U.S.A. [12] Institute of Electrical and Electronic Engineers, “IEEE Standard recommended practice for the measurement of potentially hazardous electromagnetic fields”, no. ANSI/IEEE C95.31991, 1991, IEEE, New York, U.S.A.
[13] Institute of Electrical and Electronic Engineers, “IEEE Standard Methods for Measuring Electromagnetic Field Strength of Sinusoidal Continuous Waves, 30 Hz to 30 GHz", no. IEEE Std 291-1991, 1991, IEEE, New York, U.S.A. [14] Institute of Electrical and Electronic Engineers, “IEEE Standard Methods for Measuring Electromagnetic Field Strength for Frequencies Below 1000 MHz in Radio Wave Propagation ", no. IEEE Std 302-1969, 1969, IEEE, New York, U.S.A. [15] International Telecommunication Union, “Determination and measurement of the power of amplitude-modulated radio transmitters”, no. ITU-R SM 326.7, 1997, ITU, Geneva, Swiss. [16] D. Trinchero, R. Tascone, I. Cerato, I. Riccardi, “Electric Field Mapping in the Surroundings of RF Emitters”, International Conference on Electromagnetics in Advanced Applications (ICEAA99), Torino, 13-17 September 1999, pp. 707-710. [17] D. Trinchero, R. Tascone, I. Cerato, I. Riccardi, “An Interactive Procedure for Environment Monitoring of Electric Field Distributions”, 29th European Microwave Conference, Munich, 5-7 October 1999, pp. 244-247. [18] Decreto n. 381 del 10 Settembre 1998, “Regolamento recante norme per la determinazione dei tetti di radiofrequenza compatibili con la salute umana”, Gazzetta Ufficiale dello Repubblica Italiana, no. 257, pp. 9--14, 3 Novembre 1998. [19] Ministero dell'Ambiente, Ministero delle Comunicazioni, Ministero della Sanità, “Regolamento recante norme per la determinazione dei tetti di radiofrequenza compatibili con la salute umana: linee guida applicative”, Roma, luglio-settembre 1999.