Mechanisms of Development 113 (2002) 99–102 www.elsevier.com/locate/modo
Gene expression pattern
Expression of the helix-loop-helix gene id3 in the zebrafish embryo Thomas Dickmeis a, Sepand Rastegar a, Chen Sok Lam d, Pia Aanstad b, Matthew Clark b, Nadine Fischer a, Fre´de´ric Rosa c, Vladimir Korzh d, Uwe Stra¨hle a,* a
Institut de Ge´ne´tique et de Biologie Mole´culaire et Cellulaire, CNRS/INSERM/ULP, BP 163, F-67404 Illkirch Cedex, C.U. de Strasbourg, Strasbourg, France b Max Planck Institut fu¨r Molekulare Genetik, 73 Ihnestrasse, D-14195 Berlin (Dahlem), Germany c U 368 INSERM, Ecole Normale Supe´rieure, 46, rue d’ Ulm. F-75230 Paris Cedex 05, France d Institute of Molecular Agrobiology, National University of Singapore, 1 Research Link, Singapore Received 15 October 2001; received in revised form 21 December 2001; accepted 21 December 2001
Abstract Proteins of the Extramacrochaetae and Id subfamily of Helix-Loop-Helix (HLH) proteins are negative regulators of bHLH transcription factors. We cloned a cDNA from zebrafish which encodes a member of the id3 subfamily. High levels of transcripts accumulated in the germ ring and in the embryonic shield. Towards the end of gastrulation, Id3 was highly expressed in the anterior prechordal plate and hypoblast. At later stages, id3 expression was turned on and off in a large variety of tissues within short periods of time. These include the lateral mesoderm, the cornea, the lens, the brain, the neural crest, the retina and the fins. q 2002 Elsevier Science Ireland Ltd. All rights reserved. Keywords: Helix–loop–helix; Extramacrochaetae; id3; Germ ring; Embryonic shield; Retina
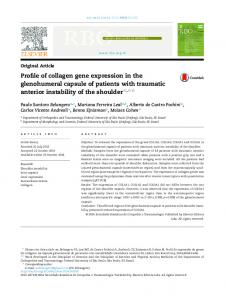
1. Results and discussion In a screen for Nodal responsive genes (Dickmeis et al., 2001) we identified a 1211 bp cDNA clone, 12A1, with an open reading frame of 116 amino acids containing a helix– loop–helix (HLH) domain (Fig. 1B). The presence of a stop codon 98 bp upstream of the ATG indicated that the cDNA codes for a full-length protein. Phylogenetic analysis revealed that the encoded protein is a divergent member of the Id3 subgroup of HLH transcriptional repressors (Fig. 1A). In addition to the HLH protein interaction domain, the eight amino acids following the amino-terminal methionine are highly conserved among Id factors. Within this region, a cyclin-E/cyclin-A–CDK2 phosphorylation site is present in the Id2, Id3 and Id4 proteins (Fig. 1B), and Id2 and Id3 proteins were shown to be phosphorylated at Ser5 during late G1/early S-phase of the cell cycle. This changes the specificity of heterodimerization and abolishes their role in promoting S-phase of the cell cycle (Hara et al., 1997). Two smaller regions of homology are present between zebrafish Id3 and members of the Id2 and Id3 subgroups, respectively (Fig. 1B, boxed regions). Thus, conserved features of both Id3 and Id2 subgroups are combined in zebrafish clone 12A1, underscoring the divergent character
* Corresponding author. Tel.: 133-3-8865-3359; fax: 133-3-8865-3201. E-mail address:
[email protected] (U. Stra¨hle).
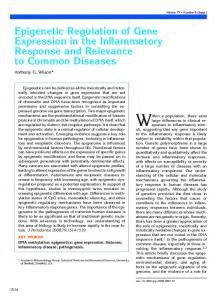
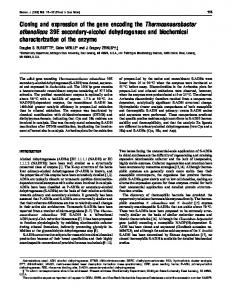
of this id gene. As the overall sequence homology is slightly closer to that of the Id3 subfamily, we refer to clone 12A1 as zebrafish id3. id3 was mapped on the Tu¨bingen radiation hybrid panel (Geisler et al., 1999) between 44.5 and 47.1 cM from the top of LG17. We performed Northern hybridization to analyse transcript size (Fig. 2). In RNA derived from 1 to 8 cell stage embryos, a weak maternal signal was visible which runs at about 1 kb. At early gastrulation and at 24 h, this band became stronger, and additional bands appeared at approximately 1.25 and 3.1 kb. The size of the smaller zygotic transcript suggests that cDNA clone 12A1 corresponds to the full length 1.25 kb mRNA. By in situ hybridization expression of id3 became visible at about 4.5 hours post fertilization (hpf) in the putative dorsal sector of the germring (Fig. 3A). Maternal expression could not be detected by in situ hybridization. At the 30– 40% epiboly stage, expression expanded around the margin (Fig. 3B). At 50% epiboly, strong staining marked the future dorsal region while weaker staining was detected in the entire germ ring (Fig. 3C). Slightly later, at the 60% epiboly stage, expression was detectable in the anterior hypoblast of the shield which represents the early involuting prechordal plate cells (Fig. 3D). During gastrulation, the initially very narrow band of expression in the germring (Fig. 3C) transformed into a wider band consisting of scattered hypoblast cells (Fig. 3D,E). This band of scattered cells translocated
0925-4773/02/$ - see front matter q 2002 Elsevier Science Ireland Ltd. All rights reserved. PII: S 0925-477 3(02)00006-0
100
T. Dickmeis et al. / Mechanisms of Development 113 (2002) 99–102
Fig. 1. Phylogenetic analysis of zebrafish Id3. (A) Phylogenetic tree of vertebrate and Drosophila id related genes generated with the entire protein sequence and the Clustal X program (Thompson et al., 1997). The clone 12A1 groups together with the Id3 family. (B) Protein sequence alignment of the members of the vertebrate Id2 and Id3 families created with the Clustal W program (Thompson et al., 1994). Asterisks indicate fully conserved residues, : and. indicate conserved residues of strong or weaker groups as defined by (Thompson et al., 1997). The helix–loop–helix region is indicated by white text, underlaid in black for the two helix regions and in dark grey for the loop region. Light grey shading indicates the conserved cyclinE/A-CDK2 phosphorylation site SPVR. Additional regions of homology between zebrafish Id3 and either the Id2 or the Id3 group are boxed. The GenBank accession number of zebrafish id3 is AY065841.
Fig. 2. Northern analysis of id3 expression. Twenty micrograms of total RNA were loaded in each lane. As a loading control, 28S rRNA was visualized with methylene blue. RNAs were extracted at the 1–8 cell stage (Mat, maternal RNA), 60% epiboly (60%) and at 24 h post fertilization (24 h). Arrows indicate the size of the major transcripts of id3.
towards the animal pole, generating an area of non-expressing cells at the blastoderm margin at 80% epiboly (Fig. 3E). Their morphology suggests that these hypoblast cells are endoderm cells (Warga and Nusslein-Volhard, 1999), and this pattern is reminiscent to that of foxA2 (axial, HNF3b ), a marker expressed later in the anterior gut tube (Strahle et al., 1993, 1996). At the 6- to 9-somite stages, expression was detectable in the polster (Fig. 3F), the anterior derivative of the prechordal plate, in the notochord and in the lateral mesoderm (Gering et al., 1998) flanking the somites (Fig. 3G,H). The centre of the tail bud also expressed id3 transcripts at these stages (Fig. 3I). At the 9-somite stage, two dorsal stripes of expression marked rhombomeres 3 and 5 (Fig. 3I), as revealed by double in situ hybridization analysis with Krox20 (Oxtoby and Jowett, 1993, and data not shown). The eye primordium expressed id3 weakly at the 9-somite stage (Fig. 3I, arrow). By the 16–18-somite stage, strong expression was detectable in the lens and the cornea (Fig. 4A). Also, expression was observed in cephalic and trunk neural crest cells (Fig. 4A,B, arrowheads, and data not shown). In the nascent forebrain of 18-somite stage embryos, the ventral diencephalon and a group of cells in the ventral telencephalon showed high levels of expression
T. Dickmeis et al. / Mechanisms of Development 113 (2002) 99–102
101
(Fig. 4B, arrows). At 24 hpf, expression persisted in the forebrain and the lens of the eye. The embryonic kidney expressed id3 also at this stage (Fig. 4C). While transcripts were no longer detectable in the lens, the inner nuclear layer of the retina expressed id3 at 48 hpf (Fig. 4D, arrow, G,H, inl). Expression of id3 can be detected also in the adult zebrafish eye (data not shown). It is expressed at high levels in cells located between the sclera and iris (Kardong, 2002) and at low levels in cells immediately below the ganglion cell layer. In the brain at 48 hpf expression was visible in the epiphysis, the telencephalon, the dorsal tegmentum, at the midbrain-hindbrain boundary, in the central hypothalamus and the anterior hindbrain (Fig. 4E,G). Another new region of expression in the 2-day-old embryo was the developing pectoral fins (Fig. 4F). Retinal expression of id3 complements that of Islet1,
Fig. 3. Expression of id3 during early embryogenesis. (A) Dome stage, lateral view, dorsal right. Expression is visible at the putative dorsal margin (arrow). (B) Thirty to forty percent epiboly stage, animal pole view, dorsal right. Expression has expanded around the margin, with higher expression in the future dorsal side (arrow). (C) Fifty percent epiboly stage, dorsal view. Strong staining is visible in the dorsal region. A narrow band of cells is visible in the germring laterally (arrowheads). (D) Sixty percent epiboly stage, dorsal view. Strong expression is detectable in the anterior part of the shield (arrow). In more lateral regions of the germring, the band of expression is now composed of scattered hypoblast cells (arrowheads). (E) Eighty percent epiboly stage, lateral view, dorsal right. Expression continues in the anterior axial hypoblast (arrow) and in a broader lateral band of hypoblast cells (arrowheads). Dots indicate the level of the migrating blastoderm margin. (F–H) Six-somite stage. (F) Frontal view, dorsal up. id3 expression is detected in the polster. (G,H) Expression is visible in the notochord (arrow) and the lateral mesoderm (arrowheads). (G) Optical transverse section at trunk level, dorsal up. Dots indicate the borders between neural keel and somites. (H) Dorsal view, anterior up. (I) Nine-somite stage, lateral view, dorsal right. The tailbud expresses id3 as during the six-somite stage. Additional expression domains have appeared in the eye (arrow) and in rhombomeres 3 and 5 of the hindbrain (arrowheads).
Fig. 4. Expression of id3 in late and post-somitogenesis embryos. (A,B) Eighteen-somite stage. (A) Dorsal view of the head. id3 is expressed in lens and cornea of the eye (arrow) and in cephalic neural crest (arrowhead). (B) Lateral view of the head. Expression is seen in the cephalic neural crest (arrowhead), in the ventral diencephalon (arrow) and a spot in the ventral telencephalon (broken arrow). The eyes were removed. (C) Twenty-four hours post fertilization, dorsal view of the trunk. id3 is expressed in the developing kidney. (D–F) Forty-eight hours post fertilization. (D) Lateral view of eye. id3 is expressed in the bipolar cell layer (arrow) of the retina. (E) Side view of the anterior part of the embryo (eyes removed). Expression domains are located in the epiphysis (e), dorsal telencephalon (dt), intermediate telencephalon (it), ventral telencephalon (vt), caudal midbrain (m), cerebellum (c) and hypothalamus (ht). (F) Dorsal view of head and anterior trunk. The pectoral fins express id3 (arrow). (G,H) Expression of id3 (blue) complements Islet1 (brown) expression. Transverse cryostat sections of 48 (G) and 50 hpf (H) embryos, dorsal up. In the brain, id3 is expressed in the dorsal tegmentum (tg), the central part of the hypothalamus (ht) and the eye. id3-Positive cells occupy the inner layers of the hypothalamus, where less differentiated cells reside. While id3 is detectable in the entire inner nuclear layer of the eye at 48 hpf (D), expression is confined to the inner nuclear layer (inl) of the dorsal peripheral retina at 50 hpf (H). id3 expression,which is initially uniform in the inl (D) becomes patchy (asterisk) and, finally, is turned off in further differentiated regions characterized by expression of Islet1. c, cerebellum; dt, dorsal telencephalon; e, epiphysis; gcl, ganglion cell layer; ht, hypothalamus; inl, inner nuclear layer; it, intermediate telencephalon; l, lens; m, caudal midbrain; onl, outer nuclear layer; ot, optic tectum; r, retina; tg, tegmentum; vp, ventral patch; vt, ventral telencephalon.
which defines the ganglion cell layer and the ventral patch. The ventral patch is the earliest site of expression of the neurodifferentiation markers NeuroD and Islet1 in the retina (Korzh et al., 1998). Also in the brain, expression of id3 could be found in areas associated with less differentiated cells, like the inner germinal layer of the neural tube (Fig. 4G). This suggests that in the brain and the eye, id3 expression is confined mainly to undifferentiated cells.
102
T. Dickmeis et al. / Mechanisms of Development 113 (2002) 99–102
2. Experimental procedures 2.1. Cloning and sequence analysis The id3 cDNA was identified in a subtractive screen for Taram-A inducible genes using a macro-array of a shield stage library (RZPD library no. 637 (Clark et al., 1999, and unpublished). Details of the screen have been published elsewhere (Dickmeis et al., 2001). Multiple alignments and phylogenetic tree building were carried out using the Clustal X and W programs (Thompson et al., 1994, 1997). 2.2. Northern hybridization Total RNA was isolated with the RNeasy Maxi kit (Qiagen) and Northern analysis was carried out using random primed 32P-labelled 12A1 cDNA and stringent washing conditions (Sambrook et al., 1989). 2.3. In situ hybridization and immunohistochemistry Embryos were staged according to Kimmel et al. (1995). In situ hybridization and immunohistochemistry were carried out as described previously (Dheen et al., 1999; Oxtoby and Jowett, 1993). In situ hybridization on cryostat sections of adult zebrafish was carried out as described (Strahle et al., 1994). Acknowledgements We thank Trevor Jowett for probes, Thomas Edlund for the rabbit anti-Islet1 polyclonal antibody, Robert Geisler for mapping data and Charles Plessy for critically reading the manuscript. We are grateful to D. Biellmann, A. Karmin and O. Nkundwa for care of the fish. This work was supported by a Boehringer Ingelheim fellowship to T.D. We are also grateful to the Institut National de la Sante´ et de la Recherche Medicale, the Centre National de la Recherche Scientifique, the Hoˆ pital Universitaire de Strasbourg, AFM, ARC and ACI. References Clark, M.D., Panopoulou, G.D., Cahill, D.J., Bussow, K., Lehrach, H., 1999. Construction and analysis of arrayed cDNA libraries. Methods Enzymol. 303, 205–233. Dheen, T., Sleptsova-Friedrich, I., Xu, Y., Clark, M., Lehrach, H., Gong, Z.,
Korzh, V., 1999. Zebrafish tbx-c functions during formation of midline structures. Development 126, 2703–2713. Dickmeis, T., Aanstad, P., Clark, M.D., Fischer, N., Herwig, R., Mourrain, P., Blader, P., Rosa, F., Lehrach, H., Strahle, U., 2001. Identification of Nodal signaling targets by array analysis of induced complex probes. Dev. Dyn. 222, 571–580. Geisler, R., Rauch, G.-J., Baier, H., van Bebber, F.V., Brobeta, L., Dekens, M.P.S., Finger, K., Fricke, C., Gates, M.A., Geiger, H., GeigerRudolph, S., Gilmour, D., Glaser, S., Gnu¨ gge, L., Habeck, H., Hingst, K., Holley, S., Keenan, J., Kirn, A., Knaut, H., Lashkari, D., Maderspacher, F., Martyn, U., Neuhauss, S., Neumann, C., Nicolson, T., Pelegri, F., Ray, R., Rick, J.M., Roehl, H., Roeser, T., Schauerte, H.E., Schier, A.F., Scho¨ nberger, U., Scho¨ nthaler, H.-B., SchulteMerker, S., Seydler, C., Talbot, W.S., Weiler, C., Nu¨ sslein-Volhard, C., Haffter, P., 1999. A radiation hybrid map of the zebrafish genome. Nat. Genet. 23, 86–89. Gering, M., Rodaway, A.R., Gottgens, B., Patient, R.K., Green, A.R., 1998. The SCL gene specifies haemangioblast development from early mesoderm. EMBO J. 17, 4029–4045. Hara, E., Hall, M., Peters, G., 1997. Cdk2-dependent phosphorylation of Id2 modulates activity of E2A-related transcription factors. EMBO J. 16, 332–342. Kardong, K., 2002. Vertebrates: Comparative Anatomy, Function, Evolution, . 3rd EditionMcGraw-Hill, New York. Kimmel, C.B., Ballard, W.W., Kimmel, S.R., Ullmann, B., Schilling, T.F., 1995. Stages of embryonic development of the zebrafish. Dev. Dyn. 203, 253–310. Korzh, V., Sleptsova, I., Liao, J., He, J., Gong, Z., 1998. Expression of zebrafish bHLH genes ngn1 and nrd defines distinct stages of neural differentiation. Dev. Dyn. 213, 92–104. Oxtoby, E., Jowett, T., 1993. Cloning of the zebrafish krox-20 gene (krx-20) and its expression during hindbrain development. Nucleic Acids Res. 21, 1087–1095. Sambrook, J., Fritsch, E.F., Maniatis, T., 1989. Molecular Cloning, A Laboratory Manual, Cold Spring Harbor Laboratory Press, Cold Spring Harbor, NY. Strahle, U., Blader, P., Henrique, D., Ingham, P.W., 1993. Axial, a zebrafish gene expressed along the developing body axis, shows altered expression in cyclops mutant embryos. Genes Dev. 7, 1436–1446. Strahle, U., Blader, P., Adam, J., Ingham, P.W., 1994. A simple and efficient procedure for non-isotopic in situ hybridisation to sectioned material. Trends Genet. 10, 75–76. Strahle, U., Blader, P., Ingham, P.W., 1996. Expression of axial and sonic hedgehog in wildtype and midline defective zebrafish embryos. Int. J. Dev. Biol. 40, 929–940. Thompson, J.D., Higgins, D.G., Gibson, T.J., 1994. CLUSTAL W: improving the sensitivity of progressive multiple sequence alignment through sequence weighting, position-specific gap penalties and weight matrix choice. Nucleic Acids Res. 22, 4673–4680. Thompson, J.D., Gibson, T.J., Plewniak, F., Jeanmougin, F., Higgins, D.G., 1997. The CLUSTALX windows interface: flexible strategies for multiple sequence alignment aided by quality analysis tools. Nucleic Acids Res. 25, 4876–4882. Warga, R.M., Nusslein-Volhard, C., 1999. Origin and development of the zebrafish endoderm. Development 126, 827–838.