Extended Summary of the Arc Segmentation Contest Liu Wenyin1, Jian Zhai2, and Dov Dori3 1
Dept of Computer Science, City University of Hong Kong Hong Kong SAR, PR China
[email protected] 2 Dept. of Computer Science and Technology, Tsinghua University Beijing 100084, PR China
[email protected] 3 Faculty of Industrial Engineering and Management Technion, Haifa 32000, Israel
[email protected]
Abstract. The Arc Segmentation Contest, as the fourth in the series of graphics recognition contests organized by IAPR TC10, was held in association with the GREC’2001 workshop. In this paper we present the extended summary of the contest: the contest rules, performance metrics, test images and their ground truths, and the outcomes.
1
Introduction
This contest on arc segmentation held at the fourth International Workshop on Graphics Recognition (GREC’2001), Kingston, Ontario, Canada, September 7-8, 2001 is the fourth in the series of graphics recognition contests organized by the International Association for Pattern Recognition's Technical Committee on Graphics Recognition (IAPR TC10). The first contest, held at the GREC’95 workshop, focused on dashed line detection [1,2,3]. The second contest, held at the GREC’97 workshop, attempted to evaluate complete raster to vector conversion systems [4,5,6,7]. The third contest, held off-line in association with the GREC’99 workshop, also aimed to evaluate complete raster to vector conversion systems. The purpose of this series of contests is to encourage third-party independent and objective evaluation of the industrial and academic solutions to the graphics recognition problem and therefore push the research in this area. Following the success of these three contests, in this contest we focused on testing the abilities of participating algorithms and systems to detect solid arcs from raster images. The participating systems were tested on-site with synthesized and real scanned images at different levels of quality and complexity. An overall performance metric based on a previously developed line detection performance evaluation protocol [8] was used to measure each system and determine the winners. In this paper we present the extended summary of the contest, including the contest rules, performance metrics, test images and their ground truths, the outcomes, and discussions. D. Blostein and Y.-B. Kwon (Eds.): GREC 2002, LNCS 2390, pp. 343-349, 2002. Springer-Verlag Berlin Heidelberg 2002
344
Liu Wenyin et al.
2
General Rules
We require the participants to correctly recognize solid arcs in raster images. Therefore we measure the recognition accuracy of solid arcs as the performances of the participants. The recognition accuracy is measured in terms of the difference between the geometric parameters of the recognized solid arcs and the corresponding expected solid arcs (which are also referred to as ground truth) by the differences in the geometry of the detected and expected (ground truth) arcs. The smaller the difference, the higher the accuracy, and hence, the better the performance. The details of the performance metrics are defined in Section 4. Although we measure solid arcs only, the participating systems can compute anything they wish in order to improve the arc segmentation. For example, text and other type of graphics can be segmented to help reduce false alarms of arc segmentation. However, since detection of text, symbols, and other graphics may also produce false alarms, which are actually solid arcs, the impact of other detections on the overall performance is not known precisely. There is a tradeoff in this aspect. Participants were required to fix the graphics recognition processes and configurations (e.g., thresholds) of their systems during the test. That is, the participating systems were required to run on-site as black boxes, which accepted input files and yielded output files. No other human intervention was allowed. Each participating system was required to run on the same set of testing images, which include four synthesized images and three scanned images. We present details of the test images in Section 3. All images are binary (black and white) and in common TIFF format. The output file format was VEC, defined by Atul Chhabra [9]. The system’s score on each test images is calculated independently according to performance metrics defined in Section 4. If there were no result produced for any image due to any reason (e.g., system crash, dead loop, etc.), the score for that image is taken as zero. An overall average score for these seven images is used as the unique measure to judge the system’s performance. The contest rules are summarized below. • • • • •
3
Recognition accuracy of solid arcs was measured. System configuration was fixed during the contest. Seven images were tested: four synthesized and three scanned. The Input file format was binary TIFF and the output file format was VEC. An overall average score was used as the unique measure of performance.
Test Images and Their Ground Truths
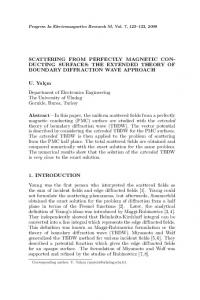
The four synthesized images were generated by the following way. First of all, we composed a ground truth vector drawing containing arcs of various radii, central angles, and line widths, as shown in Fig.1. The vector drawing was then converted into four images. During the conversion processes, four types of noise: Gaussian (Level 5), high frequency (Level 3), hard pencil (Level 3), and geometry distortion (Level 3), were added to the four images separately. Parts of the four test images are shown in
Extended Summary of the Arc Segmentation Contest
345
Fig. 2, which also show the effects of these noise types. The modeling processes of these noises are described in detail in [10].
Fig.1. The ground truth vector drawing for the four synthesized test images
(a) Gaussian Noise
(b) High Frequency
(c) Hard Pencil
(d) Geometrical Noise
Fig.2. Parts of the four synthesized test images, each showing the effect of one type of noises
The three scanned test images were yielded by scanning two real engineering drawings from a textbook. One test image is scanned from the drawing shown in Fig. 3.The other two test images are scanned from the same drawing shown in Fig. 4 but with different resolutions. The ground truth vector files for these real images are obtained by manually measuring their geometry parameters.
346
Liu Wenyin et al.
All ground truth vector files were also stored in the VEC format. These test images and other pre-contest training images are now available at the contest website [11].
Fig.3. Once real scanned drawing
4
Fig.4. The other real scanned drawing
Performance Measurement
As we mentioned in Section 2, the recognition performance was measured in terms of the differences between the recognized arcs and ground truth arcs. To measure the difference between ground truth arcs and recognized arcs, correspondences between them should be established by matching ground truth arcs with the recognized ones. We define the matching degree of a pair of arcs based on the overlap area and the extent to which the endpoints match. Let c = k ∩ g denote the arc segment of the recognized arc k that overlaps the ground truth arc g. The method of calculating c is presented and illustrated in Fig. 5. doverlap = Hausdorf distance between the matched pair, in the overlap area. g
k d1
d2
k
g d1
d2
Fig.5. Illustration of the matching of arcs. (a) two arcs. (b) an arc and a line
A ground truth arc and a recognized arc are defined to be overlapping if the overlapping distance (doverlap) is smaller than half the ground truth line width. As Fig. 5 shows, the overlap distance is defined as the Hausdorf distance—the maximum of all minimum distances between the points on k and g in the overlap area. The overlapping distance and the distances between the two arcs at the overlapping segment’s two endpoints (denoted by d1 and d2) are used to define the vector detection quality of the overlapping segments and to calculate the following performance metrics. In a nutshell, the vector detection quality is measured by the detection accuracy using a number of criteria, including the endpoints, the location offset, the line width, the geome-
Extended Summary of the Arc Segmentation Contest
347
try, and the line style. We compute and record the vector detection quality of these overlapping segments, as well as their lengths, for both the ground truth arcs and their matched recognized arcs. The Basic Quality, (Qb) is then computed as the length weighted sum of the vector detection qualities of overlapping segments. Additionally, we compute the Fragmentation Quality, (Qfr), which is the measure of the detection fragmentation and/or consolidation, and the Total Quality, (Qv), which is the product of Qb and Qfr, for both the ground truth arcs and their corresponding recognized arcs. The total Vector Detection Rate, Dv, is length weighted sum of Qv of all ground truth arcs. The total Vector False Alarm Rate, Fv, is the length weighted sum of 1–Qv of all recognized arcs. Since a good algorithm/system should recognize as many arcs as possible and produce as few false recognition as possible, we define the overall recognition performance (called Vector Recovery Index) for a single test image as VRI=(Dv+1–Fv)/2. These concepts were presented in detail in [8]. Once we obtain the VRI for each image, we define the overall performance of a system as the average of the average performance of the four synthesized images and the average performance of the three real scanned images: VRIall = ½ [(VRI1 +VRI2 +VRI3 +VRI4)/4 + (VRI5 + VRI6 + VRI7)/3], where VRI1~4 are the VRI values of the four synthesized test images and VRI5~7 for the three real scanned images. The performance evaluation software is also available at the contest website [11].
5
Winners and Their Scores
Initially, several groups had expressed interest in participating in the contest. However, only two systems actually made it to the contest: Dave Elliman [12] and Xavier Hilaire [13]. The scores (VRIs) of their systems are listed in Table 1. Elliman’s system obtained an overall score of 0.681 and won the First Place while Hilaire’s obtained an overall score of 0.630 and won the Honorable Mention Prize. Table 1. The scores of the participants
Test Synthesized Images (filenames) Scanned Images (filenames) Images Gau_05 Frq_03 Pen_03 Geo_03 P1 P2 P3 0.853 0.896 0.927 0.547 Dave 0.904 0.482 0.371 Elliman’s Average: 0.895 Average: 0.467 scores Overall (VRIall): 0.681 Xavier 0.891 0.311 0 0.889 0.944 0.958 0.707 Hilaire’s Average: 0.339 Average: 0.921 scores Overall (VRIall): 0.630
6
Summary and Discussion
We have presented the rules, the test images, the performance metrics, and the outcomes of the arc segmentation contest. From the scores in Section 5 we can see that
348
Liu Wenyin et al.
both systems were very good at synthesized drawings. Elliman’s system was better on Gaussian noise and Hilaire’s was better on the other three images. The average difference is only 2%. However, both exhibited almost equally insufficient performance on the three scanned drawings. While Hilaire’s is better on the simple drawing p1, Elliman’s is better on the other two complex drawings. An unexpected event was that Hilaire’s system crashed on the scanned image P3 and therefore obtained a zero score. This made its overall score about 5% behind Elliman’s. From the contest results we can see that current solutions to real life test drawings are still far from satisfactory and this leaves the graphics recognition research community with a lot of room for improvement in arc segmentation. Another finding is that an individual approach may work better on some images but worse on others. Hence, a large number of test images should be used to obtain a reliable overall performance metric, as mentioned by Karl Tombre. From this contest and other previous contests we can see that it is possible to set up such a third-party independent and objective performance evaluation database within this research community although this requires some effort. Actually, it has taken us more than 10 hours to manually obtain the ground truth data for the three scanned test drawings. We have also spent a lot of time on developing the noise models and pretesting all of these test images. We plan to continue to augment the database and welcome any help from researchers in this community. Especially, we would like the feedback on this contest from the community, on all issues, including rules, test drawings, performance scores. Moreover, we suggest that researchers use this performance evaluation protocol and the dataset to test their algorithms and compare with other algorithms. In this way, more problems can be found and the performance evaluation protocol can then be improved. It is even better to publish and contribute their performance evaluation results on a public site, such that comparison among existing algorithms can be carried out efficiently, thereby advancing the state-of-theart in this area. Obviously, much work still needs to be done. Particularly, as Karl Tombre pointed out just after the contest, we need more real-life drawing images with ground truths as test images. We also need more experiments to improve the performance evaluation protocol, such that it can be accepted by most people as a standard. We may also need more efforts to simulate more types of noise in real scanned images. Though we did not evaluate other aspects of the recognition performance, e.g., memory, time, and system robustness, we believe that these are also important factors that should be considered in future contests.
Acknowledgement First of all, we thank all participants for their interest, support, and effort, which has made this contest meaningful. We also thank the workshop chairs, Dorothea Blostein and Yong-Bin Kwon for their support, Arnold Smeulders for his suggestion on stress testing, and Karl Tombre and Atul Chhabra for their discussion on the contest organization.
Extended Summary of the Arc Segmentation Contest
349
References 1.
2. 3. 4.
5.
6. 7. 8. 9. 10.
11. 12. 13.
Kasturi R. and Tombre K. (eds.): Graphics Recognition: Methods and Applications, First International Workshop, University Park, PA, USA, August 1995, Selected papers published as Lecture Notes in Computer Science, volume 1072, Springer (1996) Kong B., et al.: A Benchmark: Performance Evaluation of Dashed Line Detection Algorithms. In: Graphics Recognition: Methods and Applications, Lecture Notes in Computer Science, volume 1072, Springer (1996) Dori D., Liu W., and Peleg M.: How to Win a Dashed Line Detection Contest. In: Graphics Recognition: Methods and Applications, Lecture Notes in Computer Science, volume 1072, Springer (1996). Chhabra A. and Phillips I.: The Second International Graphics Recognition Contest - Raster to Vector Conversion: A Report. In: Graphics Recognition: Algorithms and Systems, Lecture Notes in Computer Science, volume 1389, Springer (1998). Phillips I., Liang J., Chhabra A. and Haralick R.: A Performance Evaluation Protocol for Graphics Recognition Systems. In: Graphics Recognition: Algorithms and Systems, Lecture Notes in Computer Science, volume 1389, Springer (1998). Chhabra A. and Phillips I.: A Benchmark for Graphics Recognition Systems. In: Proc. IEEE Workshop on Empirical Evaluation Methods in Computer Vision, Santa Barbara (1998). Phillips I. and Chhabra A.: Empirical Performance Evaluation of Graphics Recognition Systems. IEEE Trans. on Pattern Analysis and Machine Intelligence 21(9) (1999) 849-870. Liu W. and Dori D.: A Protocol for Performance Evaluation of Line Detection Algorithms. Machine Vision and Applications 9 (1997) 240-250. http://graphics.basit.com/iapr-tc10/contests/contest97/pre-contest97.html Liu W., Zhai J., Dori D., Tang L.: A System for Performance Evaluation of Arc Segmentation Algorithms. In: Proc. of third CVPR Workshop on Empirical Evaluation Methods in Computer Vision, Hawaii (2001) (http://www.cs.cityu.edu.hk/~liuwy/ ArcContest/NoiseModels.pdf). http://www.cs.cityu.edu.hk/~liuwy/ArcContest/ArcSegContest.htm Elliman D. TIF2VEC, An Algorithm for Arc Segmentation in Engineering Drawings. In: Post-Proc. of GREC2001, Lecture Notes in Computer Science (This volume), Springer (2002). Hilaire X. RANVEC and the Arc Segmentation Contest. In: Post-Proc. of GREC2001, Lecture Notes in Computer Science (This volume), Springer (2002).