Extending Business Process Management to Determine Efficient IT Investments Thomas Neubauer
Christian Stummer
Secure Business Austria - Security Research
School of Business, Economics, and Statistics
Vienna, Austria
University of Vienna, Austria
[email protected]
[email protected]
ABSTRACT
In many sectors, companies model and optimize their business processes in order to better manage the external value that comes from these processes. Supporting the execution of corporate business processes with an optimal set of IT investments is crucial to a company’s success. However, existing business process management (BPM) approaches do not integrate methods for evaluating and selecting efficient IT investments and traditional evaluation methods are often inadequate. This paper proposes an extension that aims at a more adequate valuation, allocation, and selection of IT investments with respect to the requirements of the given corporate business processes. Such an extension allows decision makers in process-oriented organizations to interactively determine and continually optimize IT investments. At the same time, the extension improves the decision makers’ awareness of the efficiency of their investments and, thus, reduces the gap between technology and business by further completing the traditional BPM methodology. This paper implements such an approach in a decision support system and illustrates its application by means of an example. Categories and Subject Descriptors
H.4 [Information Systems Applications]: Miscellaneous General Terms
Management Keywords
Business IT alignment, business process management, decision support 1.
INTRODUCTION
Companies model and optimize their business processes as a means for increasing the (external) value gained from
Permission to make digital or hard copies of all or part of this work for personal or classroom use is granted without fee provided that copies are not made or distributed for profit or commercial advantage and that copies bear this notice and the full citation on the first page. To copy otherwise, to republish, to post on servers or to redistribute to lists, requires prior specific permission and/or a fee.
SAC'07
March 11-15, 2007, Seoul, Korea
these processes [21]. As the majority of business processes in today’s highly automated world are supported by IT systems [35], the success of a business strategy is also linked to the availability of the appropriate IT systems: poor IT investment decisions may entail corporate failure. This is the case if (i) IT systems do not fully support the specific business processes (e.g., using only standard software that lacks the appropriate adaptations), (ii) the IT systems are inefficient with respect to the firm’s strategic objectives, or (iii) the core functions are shared and freely available. Note that “IT does not matter” in the latter case since competitive advantages come from having things that are unavailable to competitors or doing things that are unique. While advantages can be realized through technology that is owned by a single company (such as an innovative process that is hard to replicate, a patent or exclusive rights), it is a matter of course that standard software or ASPs do not provide a particular competitive advantage [4]. Consequently, investments in IT typically account for a considerable share of corporate spending [4]. This fact confronts decision makers with the challenge of finding an optimal level of IT investments based on the given business processes and business strategy. When seeking to select the most appropriate set of measures and, thus, the right level of IT investments, managers have to take into consideration multiple objectives that are often mutually exclusive. These objectives include the minimization of costs and the maximization of business value, as well as the varying and changing preferences of multiple stakeholders and the costefficient usage of the available resources. While companies strive for cost-conscious solutions, they are frequently unaware of the level of their IT capital expenditure and/or, even more importantly, whether these investments are effective [13]. In fact, companies more often than not buy, implement, and maintain systems that do not contribute to the corporate value, as competitive advantages are only offered by the alignment, valuation and allocation of IT systems according to the corporate business processes and strategic objectives provided by a unique IT landscape. Although managers generally question whether their IT investments are efficient and/or whether their investments adequately support the corporate business processes, existing Business Process Management (BPM) methodologies exclusively focus on discovering, designing, deploying, and executing business processes with IT systems (and in doing so, seek to optimize and analyze end-to-end processes), but typically neglect the evaluation of corresponding IT investments that are required for the execution of the processes.
$5.00.
Copyright 2007 ACM 1-59593-480-4 /07/0003 ...
1250
Of course, this valuation could be done separately, but in practice decision makers usually skip this important task for a variety of reasons including a simple lack of skills [7]. This attitude results in massive overspending: Morgan Stanley estimates that U.S. companies spent $ 130 billions from 2000 to 2002 on unnecessary software and other technology; according to Gartner, companies waste as much as 20 percent of the annual (worldwide) technology investments of $ 2.7 trillion. For this reason, a thorough valuation should be considered as an integral part of BPM methodologies aiming at supporting decision makers in identifying the “best” level of IT investments. Existing approaches do not yield satisfying results [6]. This paper therefore extends traditional BPM methodologies by integrating an additional phase that enables the valuation, allocation, and selection of IT investments required by given business processes. By doing so, we propose a multiobjective decision support approach that allows managers to intuitively evaluate IT investments without their having to provide extensive a priori information on their preferences or to set irreversible resource constraints. To this end, we have adopted ideas from an earlier approach on multiobjective portfolio selection (cf. [34]). The resulting BPM extension reduces the gap between technology and business by further completing the traditional BPM methodology and supporting decision makers in defining an optimal level of IT investments according to the requirements given by the business processes. In addition, our approach helps to improve cost/benefit awareness. This paper implements it in a decision support system and illustrates its application by providing an example with a (small) set of business processes from the healthcare sector. 2.
BACKGROUND
Several approaches for business process management have been proposed during the past decade (e.g., [2, 10, 15, 18, 24, 27, 33]). All of these approaches deal with analyzing, modeling, and optimizing business processes as well as with executing these processes. While their focus was initially on reengineering (cf. [12]), nowadays BPM approaches support the continuous improvement of the full business process life cycle. Corresponding systems provide a wide spectrum of functionality [17] that in some cases also includes the manual allocation of resources required by the execution of the business processes (cf. [15]). However, BPM systems so far do not provide methodical support for the valuation and selection of efficient solutions for IT investments. Their inability to provide an appropriate alignment of business processes and corporate strategy is a shortfall, as IT investments made in the absence of such an alignment can only speed up poor processes but cannot add considerable business benefits and advantages [11]. For this reason, IT investments should only be made on the basis of specific business process requirements [1, 20] and by aligning them with business requirements that will foster a firm’s strategic objectives [22, 28]. Existing BPM methodologies particularly lack appropriate procedures to measure the potential benefits of new information technologies, although increasing competition is driving organizations to focus intensely on connections between technical activities and economic results [3]. Many evaluation techniques from disciplines such as accounting, finance, and economics have been adapted to assess the po-
tential success of IT investments [6]. Common measures are the Return on Investment (ROI), Net Present Value (NPV), Internal Rate of Return (IRR), and Payback Period. Others like the Cost Benefit Analysis are even (mis-)used to justify an investment after the decision to introduce a new technology has already been made (post-purchase rationalization) [5]. All in all, researchers and practitioners agree that simple cost-valuation methods most often are inadequate for the valuation of IT investments [13, 19, 23, 32], while more sophisticated evaluation methods such as the Real Options approach [25] confront decision makers with a degree of complexity that usually causes skepticism about the practical applicability of this method. In general, valuation methods that focus solely on financial measures seem ill-suited for IT investments because they aggregate all benefits to a single value while ignoring that (i) it is not always possible to aggregate measures from different dimensions and (ii) stakeholders may vary strongly in their utility functions (i.e., their view on how much a unit of criterion A is “worth” compared to one unit of criterion B with respect to the already achieved levels of performance in criteria A and B). To some degree this also holds for popular techniques such as the Weighted Scoring Method (WSM) and the Analytical Hierarchy Process (AHP). 3.
EXTENDING BPM WITH VALUATION
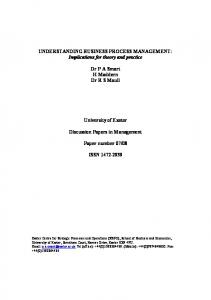
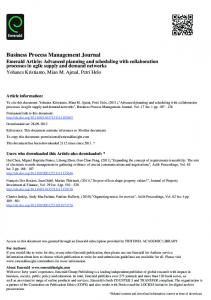
Individual business strategies, which are usually unique and provide a competitive advantage, set the basis for defining business processes and IT systems. At the same time, competitive advantages can only be realized if the business processes and IT systems are properly designed. To ensure this realization, our approach provides an extension of existing BPM methodologies by adding a so-called “Valuation Level” that provides decision makers with support for valuating, allocating, and selecting requisite IT investments with respect to given business processes determining multiple objectives and resource constraints. Figure 1 outlines the extended BPM life cycle and shows its data flows. The graphic makes clear that the business strategy sets the basis for defining corporate business processes and, thus, determines the IT strategy (cf. [29, 30, 31]). This IT strategy in turn strongly influences the design of the IT portfolio, since the criteria (e.g., costs, manpower, level of protection) used for its evaluation are defined according to these strategies; note that they may be derived from a Balanced Scorecard [14]. For instance, a bank may focus on maximizing security issues and pays little heed to the costs involved, while a low cost call center will focus heavily on minimizing such costs. Analogously, the corporate strategy determines the business processes and, ultimately, also which IT systems are part of the IT portfolio. The newly introduced valuation level is designed as an interface between the process level and the technology level in a reflection of the fact that business processes are usually executed by several IT systems that are selected from a large set of alternatives and, furthermore, each IT system may have interdependencies with others. This approach supports decision makers in finding the “best” set of IT investments based on (i) a set of business processes, (ii) a set of potential IT systems and (iii) a set of criteria determined by the corporate strategy. Compared to traditional methods our approach does not require extensive a priori preference information (such as
1251
fine selection criteria that are aligned with the given business strategy and thus may also include intangible criteria (a process that supports the identification of proper criteria is described by [26]). Consequently, this step results in a set of resource and benefit categories that provide the basis for the valuation of the IT investment candidates defined in the next step. We recognize that collecting precise data of the IT under consideration may be tricky: however, this difficulty also holds true for all other decision support/valuation approaches to the same degree and we will not further elaborate this problem, as this would go beyond the scope of the paper. 4.2
Figure 1: Value-based BPM life cycle
weights, or the highly problematic assumption of linear utility functions), allows for an evaluation that addresses multiple objectives that are often opposing, and provides interactive decision support while guaranteeing that only efficient solution portfolios are considered. We have implemented this approach in a system that may be used as an extension to existing BPM systems such as Adonis [16]. Our decision support system makes it possible to import BPM models from Adonis, permits the definition and valuation of IT investment candidates and their dependencies and supports the mapping between the business processes and the potential IT systems needed for their execution.
4.3 4.
BUSINESS PROCESS-BASED SELECTION OF IT INVESTMENTS
4.1
Criteria Definition
The first of four steps in the newly introduced valuation phase is devoted to appointing benefit and resource categories with respect to the given corporate strategy. A typical set of selection criteria may comprise criteria such as functionality, usability, or costs for both implementation and maintenance. Of course, decision makers have to de-
Data Collection
In the second step, decision makers define and, more importantly, thoroughly analyze and rate IT investment candidates with respect to resource and benefit categories (e.g., the implementation costs for a document management system may be valued in terms of 10k monetary units). In addition, decision makers must define the business processes under consideration and, finally, identify the relation between the investment candidates and existing business processes (e.g., the document management system fulfills the requirement of carrying out the activity “setting the metadata of a document”). The effort for this step can typically be minimized (especially when the step is conducted periodically) by using existing business process models that already contain the majority of the data needed. Our system provides an interface to the BPM system Adonis that makes it possible to import the business processes under consideration. Business process models provide the necessary information, e.g., regarding the costs and duration for executing the business processes. They may also provide information on existing IT systems that are needed for executing the business processes. This step results in a set of business processes, the mapping of these processes to existing or new IT systems that are needed for their execution, and the valuation of the IT systems according to the relevant resource and benefit criteria (cf. Tables 1 and 2 for an example). One of the major problems regarding valuation is the uncertainty of input data. We address this issue by collecting the data needed for valuation through monitoring the operative execution of the business processes (cf. the monitoring phase and the loop back to the valuation phase in Figure 1). For instance, the system monitors the annual occurrence of a defined security attack. This rate is used for the re-evaluation of the investment portfolio during continuous improvement. In addition, the approach provided by Neubauer et al. [26] makes it possible to refine data by eliciting preferences of multiple stakeholders. Generation of IT Investment Portfolios
Our approach provides decision makers with multiobjective decision support to determine (feasible) Pareto-efficient investment solution alternatives: this technically constitutes a multiobjective combinatorial optimization (MOCO; for a survey cf. [8]) problem. The approach strives to identify Pareto-efficient combinations (i.e., portfolios) of IT systems in which the binary variables xi indicate whether or not a system i is selected (xi = 1 if so, and xi = 0 otherwise). An IT portfolio solution can be represented as vector x = (x1 , . . . , xN ) with N being the number of investment alternatives. The MOCO problem lies in maximizing K ob-
1252
jectives (such as functionality or costs) maximize
uk (x)
for k = 1, . . . , K.
(1)
Note that objective functions referring to criteria that should be minimized (e.g., costs) can easily be transformed to ones focused on maximization by simply multiplying them by (−1). Further note that functions uk (x) may take any form (linear, non-linear, etc.) and may also have points of discontinuity in them as long as they are defined for all (feasible) IT portfolios x. Any procedure applied in this phase is supposed to identify (at least an approximation of) the set of all IT portfolio solutions that are Pareto-efficient (i.e., there is no other solution with equal good or better values in all K objectives and a strictly better value in at least one objective). Of course, all solutions taken into consideration have to be feasible with respect to limited resources (e.g., development costs or maintenance costs), which may be formulated simply as
X
riq xi ≤ Rq
Figure 2: Status of the DSS at the beginning for q = 1, . . . , Q,
(2)
i
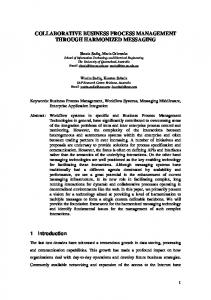
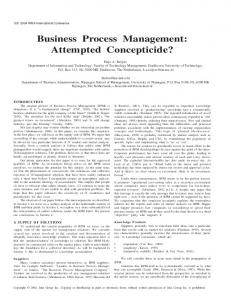
have remained after decision makers have made decisions in their interactive exploration of solution space. Two moveable horizontal lines with small triangles at one side represent lower and upper bounds. After their initialization with minimum and maximum objective values taken from the alternatives in solution space, these lines make it possible to restrict the set of remaining solutions in a step-by-step manner (e.g., by raising the minimum bound in one of the objectives) or for expanding it (e.g., by once again relaxing some bounds) according to the decision makers preferences. In all cases, the system provides immediate feedback about the consequences with regard to what alternatives remain. This setting primarily filters out those IT portfolio solutions that arrive with relatively high implementation costs, but low maintenance costs and high functionality.
where riq represents the amount of resources of type q required by system i and Rq stands for the maximum available amount of resources. Corresponding terms must be added in the event of synergy or cannibalism effects affecting the total resource consumption. Depending on its size (i.e., the number of potential IT investments being considered, the number of objectives as well as the form and number of interdependencies between IT investments), the MOCO problem may be solved exactly through complete enumeration or by means of a metaheuristic approach. Note that this type of problem is NP-difficult, i.e., the search space of potential solutions doubles with each additional IT investment candidate. As a rule of thumb, the problem may be solved exactly within reasonable computation time as long as the number of decision variables xi is somewhat below 40, although complete enumeration of all potential IT investment combinations may be a worthwhile option even for higher numbers given that severe interdependencies makes it possible to reduce the numerical complexity. Otherwise, complete enumeration may become too time-consuming and metaheuristic procedures should come into play (for a survey cf. [9]). While there is no guarantee that they will actually find all efficient solutions, these procedures usually identify the vast majority at a fraction of the runtime that is required by complete enumeration. 4.4
Interactive Selection of IT Investment Portfolios
The final selection of an optimal portfolio is supported by an interactive graphical interface that elaborates the costs and benefits categories. The interactive selection lets decision makers “playfully” explore the solution space of all efficient IT portfolios until they find the most suitable portfolio out of the x-thousand alternatives identified in the preceding phase. This approach is based on interactive modifications of lower and upper bounds for one or more objectives. To this end, the decision support system (DSS) starts with displaying K bars (cf. Figure 2). For each objective, the system provides information on what can be achieved by (i) the efficient IT portfolios from solution space (the corresponding marks may visually grow together to vertical blocks) and (ii) the alternatives that
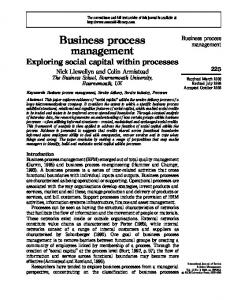
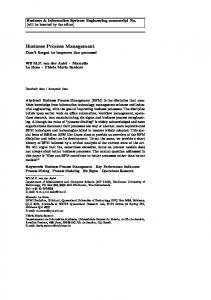
Figure 3: Status of the DSS after two settings By doing so, it also reduces the options in the other objectives and results in corresponding changes in the position and size of the “flying” bars. Raising the minimum value for functionality narrows the set of remaining alternatives even further since many low-price alternatives, in particular, drop out (cf. Figure 3).
1253
In the following phase, decision makers continue playing with minimum and maximum bounds and by doing so learn about the consequences of their decisions and thereby obtain a much better “feeling” for the problem in terms of what can be achieved in the objectives, and at what “price” in terms of opportunity costs for other objectives. After several cycles of restricting and once again expanding the opportunity set, the decision makers end up with an IT investment portfolio that offers an individually satisfying compromise between the relevant objectives. Note that during the whole procedure, decision makers do not have to explicitly specify weights for objectives or to state how much one solution is better than another: instead, they receive ample information on the specific IT investment problem. The DSS ensures that the final solution will be an optimal (i.e., Pareto-efficient) one with no other feasible solution available that is “better” from an objective point of view. 5.
NUMERICAL EXAMPLE
implementation costs for CMS-A are 50k monetary units or the effort for implementing IS-J are 100 hours). The criteria “Functionality” is not defined in this step because this value is calculated by comparing overall requirements with the requirements covered by the components of a defined portfolio (e.g., if 20 requirements are given by the stakeholder and 15 of these requirements are fulfilled by the IT systems of a portfolio the value of the criteria “Functionality” accounts for 75 (percent)).
Table 2: Mapping of business activities to IT systems under consideration Business Activity IT System First Contact Scheduling IS-A; IS-B; CMS-A; HIS-A; HIS-B IS-A; IS-B; CMS-A; CMS-B Check Records Get Record IS-C; IS-D; DMS-B; Collect Claims Data IS-E; IS-F; DMS-A; DMS-B; HIS-A
The novel approach is illustrated by means of a numerical example referring to a typical set of business processes taken from the healthcare sector. We define three benefit categories and three resource categories, as well as units for measuring these criteria, namely user acceptance (UA) measured in points, cost reduction (CR) in thousand monetary units, functionality in percent of coverage, implementation costs (IC) in thousand monetary units, maintenance costs (MC) in thousand monetary units, and effort (EF) in working hours needed for implementation. In this example we consider a business process with three sub-processes and four activities. Table 1: Data of IT System CMS-A CMS-B DMS-A DMS-B HIS-A HIS-B HIS-C IS-A IS-B IS-C IS-D IS-E IS-F IS-G IS-H IS-I IS-J
IT systems under consideration UA CR IC MC EF 6 14 50 10 150 4 17 90 9 200 8 11 80 20 250 6 16 120 24 200 9 32 180 27 500 5 27 150 24 1000 7 37 300 15 700 7 19 50 5 100 3 9 30 6 80 4 7 40 8 90 1 4 80 12 150 9 5 60 12 50 7 6 35 7 90 6 12 50 10 70 9 1 70 7 40 5 9 80 8 150 8 11 90 12 100
In addition, we consider seventeen IT investment candidates including standard software like document management systems (DMS), content management systems (CMS), and domain-specific hospital information systems (HIS) as well as individual systems (IS) and software components that make it possible to extend the standard system’s functionality but can also be existing or new stand-alone systems. Table 1 presents an overview of these systems and their characteristics regarding the defined criteria (e.g., the
Control Claims Data Create Health Record Enter Claims Data
IS-E; IS-F; DMS-A; DMS-B; HIS-A IS-G; DMS-A; HIS-B IS-E; IS-G; DMS-B; CMS-A; HIS-B
Plan Diagnosis Check Diagnostics Check Scheduling Scheduling
IS-H; IS-I; HIS-A; HIS-C IS-A; IS-B; HIS-A; HIS-B IS-A; IS-B; HIS-A; HIS-B
Forward Patient
IS-H; IS-J; DMS-B
Ward Admission Welcome Patient Hand Over Inform. Assign Room/Bed Collect Claims Data Order Food Type Order Medication
IS-H; DMS-B; HIS-A; HIS-B IS-J; HIS-A IS-E; IS-F; DMS-A; DMS-B; HIS-A IS-I; DMS-B; HIS-B IS-J; DMS-B; HIS-A
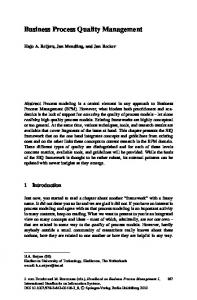
Table 2 lists the relation of the potential IT systems to the requirements (the requirements written in Italic are shown in Figure 4, the others are part of the sub-processes and are not shown in the figure) of the business process. Data for the business processes and their characteristics (e.g., cost, execution time, waiting time for each activity) as well as for the IT systems is usually taken from existing business process diagrams. Figure 4 shows such a business process modeled with the BPM system Adonis that serves as the basis for our example. Each of these processes is assigned with time and costs needed for executing a specific activity of the process. Applying the mathematical programming model outlined in Section 4.3 to this scenario identifies about 2500 Pareto-efficient portfolios. By using our interactive graphical interface, decision makers can elaborate the cost and benefits categories. The decision maker may continue playing with minimum and maximum bounds until he/she finds a portfolio that meets his/her preferences. We assume that the decision maker interactively defines the following resource constraints for the six criteria as follows (resource constraints for benefit/resource categories indicate that at least/at most the defined level must be met in the solution portfolio): user acceptance minimum 30 points, cost
1254
Figure 4: Final mapping of selected IT investments to the corresponding business process reduction minimum 80k monetary units/year, functionality minimum 70 percent of the given requirements, implementation costs maximum 500k monetary units, maintenance costs maximum 65k monetary units, and effort maximum 950 hours. These restrictions reduce the number of Paretoefficient portfolios to five solutions that are shown in Table 3. Table 3: Numerical description of the remaining portfolios Category Sol. 1 Sol. 2 Sol. 3 Sol. 4 Sol. 5 User Acceptance 35 35 33 38 41 83 83 83 83 83 Cost Reduction Functionality 81.25 100 75 87.5 75 Implement. C. 365 450 400 435 405 Maintenance C. 54 60 58 64 62 Effort 910 920 850 840 890
Let us finally have a closer look to the numerical results of Solution 2. The IT portfolio is composed of systems HISA, IS-A, IS-G, IS-I and IS-J and, thus, is characterized by a vector x = (0, 0, 0, 0, 1, 0, 0, 1, 0, 0, 0, 0, 0, 1, 0, 1, 1). Refer to Table 3 for an overview of its benefits and resource consumptions, whereas Figure 4 shows the resulting portfolio of IT systems and their connections to the corresponding activities of the business process. 6.
on the selection problem at hand and gives them the opportunity to thoroughly explore the set of Pareto-efficient solution alternatives until finding the individually most attractive IT investment portfolio. Thus, our approach provides some comfortable means to narrow the gap between technology and business by further completing the traditional BPM methodology. Further work will focus on tools aiming at generating “better” data in terms of both quantity and quality. This may be accomplished by means of a workshop-based process (cf. [26] for an example) or by further developing monitoring as the basis for the collecting the data needed for valuation (as dealt with briefly in this paper). We plan to conduct additional case studies that apply the system in practice. 7.
ACKNOWLEDGMENTS
This work was performed at the Research Center Secure Business Austria and funded by the Federal Ministry of Economics and Labor of the Republic of Austria (BMWA) as well as the federal province of Vienna. 8.
REFERENCES
[1] S. Alter. Information Systems: Foundation of E-Business. 4th ed., Prentice-Hall, 2001. [2] M. Amberg. Prozessorientierte betriebliche Informationssysteme. Springer, 1999. [3] B. Boehm and K. Sullivan. Software economics: status and prospects. Information and Software Technology, 41:937-946, 1999. [4] N.G. Carr. IT doesn’t matter. Harvard Business Review, 81(5):41-58, 2003. [5] C. Changehit, K.D. Joshi, and A.L. Lederer. Process and reality in information systems benefit analysis. Information Systems Journal, 8(2):145–162, 1998. [6] R. Clarke and K. Steven. Evaluation or justification? The application of cost/benefit analysis to computer matching schemes. In Proceedings of European Conference on Computer Systems (ECIS’97), 1997. [7] S. Dekleva. Justifying investments in IT. Journal of Information Technology Management, 16(3):1–8, 2005. [8] M. Ehrgott and X. Gandibleux, “A survey and annotated bibliography of multiobjective combinatorial optimization,” OR Spectrum, vol. 22, no. 4, pp. 425–460, 2000.
CONCLUSIONS AND FURTHER WORK
Managers are regularly confronted with the challenge of IT investment planning in terms of selecting the best combination of alternative systems from a typically large set of candidates. This task is demanding because decision makers must consider multiple, often opposing, objectives, various stakeholders’ preferences, as well as the requirements given by the corporate business processes and the corporate strategy. In this paper we described how to extend existing BPM methodologies with an approach for the valuation, allocation, and selection of IT investments based on the given business processes and business strategy. In contrast to traditional approaches the introduced decision support system does not force the decision maker to provide a priori preference information such as criteria weights for utility functions. Instead it provides decision makers with an interactive interface that provides them with information
1255
[9] M. Ehrgott and X. Gandibleux. Approximative solution methods for multiobjective combinatorial optimization. Top, 12(1):1–63, 2004. [10] A. Gadatsch. Management von Gesch¨ aftsprozessen. 2nd ed., Vieweg, 2002. [11] S.K. Goodman. Measuring the value added by records and information management programs. ARMA Records Management Quarterly, 28(2):3–13, 1994. [12] M. Hammer and J. Champy. Reengineering the Corporation: A Manifesto for Business Revolution. Harper, 1994. [13] C.D. Ittner and D.F. Larcker. Coming up short on financial measurement. Havard Business Review, 81(11):88–95, 2003. [14] R. S. Kaplan and D. P. Norton. The Balanced Scorecard Measures That Drive Performance. Harvard Business Review, 70(1):72–79, 1992. [15] D. Karagiannis. BPMS: business process management systems. SIGOIS Bulletin, 16(1):10–13, 1995. [16] D. Karagiannis, S. Junginger, H. Kuehn, and R. Strobl. Ein Gesch¨ aftsprozessmanagement-Werkzeug der n¨ achsten Generation – ADONIS: Konzeption und Anwendungen. Wirtschaftsinformatik, 42:392–401, 2000. [17] D. Kopperger, R. Naegele, and P. Schreiner. Business Process Management Tools: Eine evaluierende Marktstudie u ¨ber aktuelle Werkzeuge. Fraunhofer-Institut fuer Arbeitswirtschaft und Organisation IAO, Stuttgart, 2002. [18] G. Krallmann, H. Derszteler. Workflow Management Cycle: An Integrated Approach to the Modelling, Execution and Monitoring of Workflow-Based Processes. Springer, 1996. [19] D.M. Lander and G.E. Pinches. Challenges to the practical implementation of modelling and valuing real options. The Quarterly Review of Economics and Finance, 38 (special issue):537–567, 1998. [20] F. Leymann and W. Altenhuber. Managing business process as an information resource. IBM Systems Journal, 22(2):326–348, 1994. [21] H. Loeffler and M. Oman. IT-Survey 2004. KPMG Austria, 2004. [22] J. Luftman. Competing in the Information Age: Practical Applications of the Strategic Alignment Model. Oxford University Press, 1996. [23] M. Martinsons, R. Davidson, and D. Tse. The Balanced Scorecard: a foundation for the strategic management of information systems. Decision Support Systems Journal, 25:71–78, 1998. [24] M. zur Muehlen and M. Rosemann. Multi-paradigm process management. In Proceedings of CAiSE’04 Workshops – 5th Workshop on Business Process Modeling, Development and Support (BPMDS 2004), pp. 169–175, 2004. [25] S.C. Myers. Determinants of corporate borrowing. Journal of Financial Economics, 5:147–175, 1977. [26] T. Neubauer, C. Stummer, and E. Weippl. Workshop-based multiobjective security safeguard selection. IEEE Proceedings of the First International Conference on Availability, Reliability and Security (ARES 2006), pp. 366–373, 2006.
[27] H. Oesterle. Business in the Information Age: Heading for New Processes. Springer, 1995. [28] R. Papp. Determinants of Strategically Aligned Organizations: A Multi-Industry, Multi-Perspective Analysis. PhD thesis, Hoboken, New Jersey: Stevens Institute of Technology, 1995. [29] W. Robson. Strategic Management and Information Systems: An Integrated Approach. Pitman, London, 1994. [30] J. Rockart, M. Earl, and J. Ross. Eight imperatives for the new IT organization. Sloan Management Review, 38(1):43–55, 1996. [31] L. Rogers. Alignment revisited. CIO Magazine, May 15, 1997. [32] S.D. Ryan and M.S. Gates. Inclusion of social sub-system issues in IT-investment decisions: an empirical assessment. Information Resources Management Journal, 17(1):1–18, 2004. [33] A.-W. Scheer. ARIS: Vom Gesch¨ aftsprozess zum Anwendungssystem. Springer, 1998. [34] C. Stummer and K. Heidenberger. Interactive R&D portfolio analysis with project interdependencies and time profiles of multiple objectives. IEEE Transactions on Engineering Management, 50(2):175–183, 2003. [35] R. Witty, J. Dubiel, J. Girard, J. Graff, A. Hallawell, B. Hildreth, N. MacDonald, W. Malik, J. Pescatore, M. Reynolds, K. Russell, A. Weintraub, and V. Wheatman. The Price of Information Security, Gartner Strategic Analysis Report, 2001.
1256