Extending Document Summarization to Information Graphics
Recommend Documents
Data mining, text mining, document summarization, Positive Pointwise Mutual Information, ..... http://www.dlsi.ua.es/~elloret/publications/TextSummarization.pdf.
International Journal of Computer Science & Information Technology (IJCSIT) Vol 4, No 2, April 2012. DOI : 10.5121/ijcsit.2012.4204. 47. DOCUMENT ...
1 Department of Computer Science, City University of Hong Kong, Hong Kong SAR, ... sentences according to the document structure [1, 2]. .... more than one year. .... Changing the degree will not change the intra-stories relationship; they are.
1 Department of Computer Science, City University of Hong Kong, Hong ... both automatic summarization [1] and human abstraction [2]. .... more than one year. .... Changing the degree will not change the intra-stories relationship; they are.
Abstract: Problem statement: Text summarization can be of different nature ranging from indicative summary that identifies the topics of the document to ...
Sep 3, 1995 - common information across documents and em- ... that can adequately convey the common ... missile- and rocket-armed Cobra helicopters.
Aug 6, 2015 - In general, Centrality-based models are used to produce generic summaries, while the MMR fam-. arXiv:1508.01420v1 [cs.IR] 6 Aug 2015 ...
1. GENERAL ACCIDENT, the leading British insurer, said yesterday that insurance claims arising from Hurricane Andrew could 'cost it as much as Dollars 40m.'.
A Study on Position Information in Document Summarization ... Position information has been frequently used in ..... meeting, said: 'On the basis of emerging.
Jul 24, 2008 - comments-oriented summary, a post can be ranked high if the query .... denoted by Sc (Sc â D), that best represents the topic(s) presented in D ...
Jul 24, 2008 - Many existing blog search engines rank results by recency of ... techniques for ranking comments (i.e., in the feature-biased approach) can be ...
AbstractâMany previous research studies on extractive text summarization consider a ... tomatic text summarization can be categorized as single document ...
Sep 3, 1995 - cluded in the summary and sentence generation .... external constraints such as length or read- ... last week at Zvornik" and "Bosnian Serb.
AllCat-CatFreqScore summary: The Vatican Museums (Italian: Musei Vaticani), ... Michelangelo did the ceiling for Pope Julius II, and it shows the Creation of the ...
Jul 10, 2015 - President Bill Clinton said Friday he will appeal a fed- eral judge's ruling that struck down a law giving the pres- ident the power to veto specific ...
Boulder, Colorado, June 2009. cO2009 Association for Computational Linguistics
. Exploring Content Models for Multi-Document Summarization. Aria Haghighi.
tween relevant and shallow information in an HTML document1. For a few years, .... between anchor texts and text spans consists in taking the whole sentence ...
Returning multiple sentence answers â whether in the form of a list or a .... How many students were suspended after threatening to take over their school?
spite a great performance, is known as NP- hard (Khuller et al., 1999). ..... Combinatorica, 4:373â. 395. Samir Khuller, Anna Moss, and Joseph (Seffi) Naor. 1999.
sentence and Greenspan is a discourse-new entity, while in (b) it is discourse-old. The syntactic difference in the re- ferring expression realization indicates (and ...
the sentences in each cluster using a word-graph ... sists of the following two steps: (1) Aligning similar sen- ... tem outperforms the best extractive summarizer on both the ..... We randomized the sets of summaries to avoid any bias. The four summ
gies that can help the user find relevant information; multi- document summarization ... new (first mention in the current discourse) vs discourse-old. (subsequent ... new, but hearer-old since a reference by last name presup- poses that the ...
Indian Institute of Information Technology, Allahabad 211 012, India. Abstract ... evaluation strategy, degree of representativeness (DOG) is used. DOG gives on average ... ranked and top 10 would be selected in the summarization. Paper's ...
unit of input (word, sentence, passage) by means of statistical or machine learning methods. The stage ... Sentence weighting: summing over all signature word weights, modifying the weights by some other .... ation of electronic publications by.
Extending Document Summarization to Information Graphics
as bar charts or line graphs) are an important component of multimedia documents. Often such graphics convey information that is not contained elsewhere in ...
Extending Document Summarization to Information Graphics ∗Sandra Carberry, ∗∗Stephanie Elzer, ∗ ∗ ∗Nancy Green, ∗Kathleen McCoy and ∗Daniel Chester ∗Dept. of Computer Science, University of Delaware, Newark, DE 19716 (carberry, mccoy, [email protected]) ∗∗Dept. of Computer Science, Millersville Univ., Millersville, PA 17551 ([email protected]) ∗ ∗ ∗Dept. of Math. Sciences, Univ. of North Carolina at Greensboro, Greensboro, NC 27402 ([email protected]) Abstract Information graphics (non-pictorial graphics such as bar charts or line graphs) are an important component of multimedia documents. Often such graphics convey information that is not contained elsewhere in the document. Thus document summarization must be extended to include summarization of information graphics. This paper addresses our work on graphic summarization. It argues that the message that the graphic designer intended to convey must play a major role in determining the content of the summary, and it outlines our approach to identifying this intended message and using it to construct the summary.
1 Introduction Summarization work has focused primarily on the written words in a document. However, graphics are an important part of many documents, and they often convey information that is not included elsewhere in the document. Thus as text summarization branches out, it is essential that it consider the summarization of graphical information in documents. Graph summarization has received some attention. (Yu et al., 2002) has used pattern recognition techniques to summarize interesting features of automatically generated graphs of time-series data from a gas turbine engine. (Futrelle and Nikolakis, 1995) developed a constraint grammar formalism for parsing vector-based visual displays and producing structured representations of the elements comprising the display. The goal of Futrelle’s project is to produce a graphic that summarizes one or more graphics from a document (Futrelle, 1999). The summary graphic might be a simplification of a graphic or a merger of several graphics from the document, along with an appropriate summary caption. Thus the end result of summarization will itself be a graphic. Our project is concerned with information graphics (non-pictorial graphics such as bar charts or line graphs). Our current focus is on providing an ini-
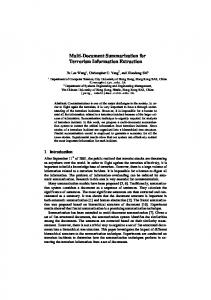
tial summary of an information graphic, within a larger interactive natural language system that can respond to followup questions about the graphic. There are several useful applications for a system that can summarize information graphics. For digital libraries, the initial summary of the graphic will be used in conjunction with the document text/summary to provide a more complete representation of the content of the document to be used for searching and indexing. In the case of environments with low-bandwidth transmission and miniature viewing facilities, such as cellular telephones for accessing the web, the initial summary and followup capability will provide an alternative modality for access to the document. However, the most compelling application of the overall system is to provide effective access to information graphics for individuals with sight impairments. The rapidly growing Information Infrastructure has had a major impact on society and the development of technology. However, the growing reliance on visual information display paradigms obliges society to ensure that individuals with visual impairments can access and assimilate information resources as effectively as their sighted counterparts. The underlying hypothesis of our work is that alternative access to what the graphic looks like is not enough — the user should be provided with the message and knowledge that one would gain from viewing the graphic in order to enable effective and efficient use of this information resource. Thus our system will present the user with an initial summary that includes the primary message that the graphic designer intended to convey, augmented with relevant interesting features of the graphic, and then interactively allow the user to access more detailed summaries of information contained in the graphic. As an example of the kinds of summaries that we envision, consider the information graphic in Figure 1. The graphic designer’s communicative goal is ostensibly to convey the sharp increase in bankruptcies in 2001 compared with the previous decreasing trend. More detailed features that might be of inter-
est include 1) that bankruptcies had been decreasing at a steady rate since 1998, 2) that bankruptcies had been decreasing slowly since 1998, 3) the percentage decrease each year, 4) the percentage increase in bankruptcies in 2001, 5) the absolute increase in bankruptcies in 2001, and 6) the total number of bankruptcies in 2001. Thus the initial summary of this graphic might be This graphic shows that although Delaware bankruptcy personal filings decreased slowly and steadily from 1998 to 2000, they rose sharply in 2001. Note that the proposed summary includes the hypothesized intended message of the graphic, along with the first two of the additional interesting features of the graphic. The selection of additional features to augment the summary is discussed further in Section 3.3. The system would then respond to user requests for additional information by presenting some or all of the other interesting features that had been identified, as discussed in Section 3.4. This paper provides an overview of our project. Section 2 discusses the essential role of intention recognition in graphics summarization. It argues not only that the intended message of the graphic designer must be inferred and included in a summary of a graphic, but also that the intended message significantly influences the additional propositions that should be included in the summary. Section 3 presents our approach to graph summarization. It discusses how we use a computer vision module to construct an XML representation that captures the components of the graphic and their relationship to one another, and how we use a Bayesian belief network to hypothesize the intentions of the graph designer. The paper then discusses our plans for constructing a summary that includes the graphic designer’s intended message along with highly ranked additional propositions, and how the lesser ranked propositions will be used in an interactive natural language system that responds to the user’s requests for further summaries of additional features of the graphic.
2 The Role of Intention in Graphics Summarization Text summarization has generally relied on statistical techniques and identification and extraction of key sentences from documents. However, it is widely acknowledged that to truly understand a text and produce the best summary, one must understand the document and recognize the intentions of the author. Recent work in text summarization has
Delaware bankruptcy personal filings 3000 2500 2000 1500 1000 1998
1999
2000
2001
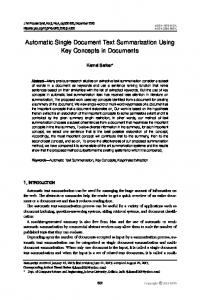
Figure 1: Graphic from a City Newspaper Median Income In thousands of 2001 dollars $15 White women 10 Black women 5
1948
60
70
80
90
01
Figure 2: Graphic from Newsweek Magazine
begun to address this issue. For example, (Marcu, 2000) presents algorithms for automatically identifying the rhetorical structure of a text and argues that the hypothesized rhetorical structure can be successfully used in text summarization. Information graphics are an important component of many documents. In some cases, information graphics are stand-alone and constitute the entire document. This is the case for many graphics appearing in newspapers, such as the graphic shown in Figure 1. On the other hand, when an article is comprised of text and graphics, the graphic generally expands on the text and contributes to the discourse purpose (Grosz and Sidner, 1986) of the arti-
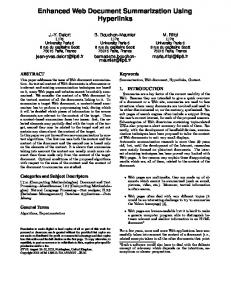
cle. For example, Figure 2 illustrates a graphic from Newsweek showing that the income of black women has risen dramatically over the last decade and has reached the level of white women. Although this information is not conveyed elsewhere in the article, it contributes to the overall communicative intention of this portion of the article — namely, that there has been a “monumental shifting of the sands” with regard to the achievements of black women. Our project is concerned with the understanding and summarization of information graphics: bar charts, line graphs, pie charts, etc. We contend that analyzing the data points underlying an information graphic is insufficient. One must instead identify the message that the graphic designer intended to convey via the design choices that were made in constructing the graphic. (Although one might suggest relying on captions to provide the intended message of a graphic, Corio and Lapalme found in a large corpus study (Corio and Lapalme, 1999) that captions are often missing or are very general and uninformative; our collected corpus of information graphics supports their observations.) Design choices include selection of chart type (bar chart, pie chart, line graph, etc.), organization of information in the chart (for example, aggregation of bars in a bar chart), and attention-getting devices that highlight certain aspects of a chart (such as coloring one bar of a bar chart different from the others). Not only should the graphic designer’s intended message comprise the primary component of any summary, but this intended message has a strong influence on the salience of additional propositions that might be included in the summary. To see the importance of recognizing the graphic designer’s intended message, consider the two graphics in Figure 3. The one on the left, Figure 3a, appeared in an NSF publication. Both graphics were constructed from the same data set. The intended message of the graphic in Figure 3a is that the salary of females is consistently less than that of males for each of the science and engineering disciplines.1 Notice that the graphic designer selected an organization for the graphic in Figure 3a that facilitated the comparison between male and female salaries in each field. A different display of the same data would facilitate different analyses. For example, the graph in Figure 3b depicts the same data as the graph in Figure 3a, yet the organization tends to draw attention to comparisons within male and female groups rather than between them,
and perhaps an integration/comparison of the messages conveyed by the two subgraphs. Thus the intended message of the graphic in Figure 3b appears to be that the ranking of the disciplines by salary are about the same for both men and women. The distinctions between presentation formats illustrate the extent to which the format can itself convey information relevant to the graphic designer’s intended message. Now let us consider how the intended message influences additional information that might be included in a summary. Suppose that 1) the salary differential between females and males was significantly larger in the life sciences than in other disciplines and 2) the average salary for both females and males was much larger in engineering than in any of the other disciplines. Feature 1) would be particularly interesting and relevant to the intended message of Figure 3a, and thus should be included as part of the graphic’s summary. On the other hand, this aspect would be less relevant to the intended message of Figure 3b and thus not as important to include. Similarly, Feature 2) would be particularly relevant to the intended message of Figure 3b and thus should be given high priority for inclusion in its summary. Although an interactive system that could analyze a graphic to any desired level of detail might extract from the graphic the information in both 1) and 2) above, we contend that a summary of the graphic should prioritize content according to its relevance to the designer’s intended message.
3 Graphic Summarization Our architecture for graphic summarization consists of modules for identifying the components of the graphic, hypothesizing the graphic designer’s intended message, planning the content of the summary, organizing a coherent summary, and interactive followup. The following sections discuss four of these modules. 3.1
Analyzing and Classifying a Graphic
The visual extraction module takes a screen image of an information graphic. It is responsible for recognizing the individual components comprising the graphic, identifying the relationship of the different components to one another and to the graphic as a whole, and classifying the graphic as to type. This includes using heuristics (such as relative position of a string of characters) to identify the axis labels — for example, that the y-axis label is Delaware
1
This graphic was constructed by a colleague who served on the NSF panel that prepared the report. Thus we know the intentions underlying the graphic.
2
The source of the leftmost graph is the National Science Foundation, Survey of Doctorate Recipients, 1997.
Figure 3: Two alternative graphs from the same data 2
bankruptcy personal filings in Figure 1. Our current implementation deals only with gray scale images (in pgm format) of bar charts, pie charts, and line graphs, though eventually it will be extended to handle color and other kinds of information graphics. The output of the visual extraction component is an XML file that describes the chart and all of its components. 3.2
Identifying the Intended Message
The second module of our architecture is responsible for inferring the graphic designer’s intended message. In their work on multimedia generation, the AutoBrief group proposed that speech act theory can be extended to the generation of graphical presentations (Kerpedjiev and Roth, 2000; Green et al., 2004). They contended that the graphic design was intended to convey its message by facilitating requisite perceptual and cognitive tasks. By perceptual tasks we mean tasks that can be performed by simply viewing the graphic, such as finding the top of a bar in a bar chart; by cognitive tasks we mean tasks that are done via mental computations, such as computing the difference between two numbers. The goal of our intention recognizer is the inverse of the design process: namely, to use the displayed graphic as evidence to hypothesize the communicative intentions of its author. This is done by analyzing the graphic to identify evidence about the designer’s intended message and then using plan recognition (Carberry, 1990) to hypothesize the author’s communicative intent. 3.2.1 Evidence about Intention Following AutoBrief (Kerpedjiev and Roth, 2000), we hypothesize that the graphic designer chooses
a design that makes important tasks (the ones that the viewer is intended to perform in recognizing the graphic’s message) as salient or as easy as possible. Thus salience and ease of performance should be taken into account in reasoning about the graphic designer’s intentions. There are several ways that a task can be made salient. The graphic designer can draw attention to a component of a graphic (make it salient) by an attention-getting or highlighting device, such as by coloring a bar in a bar chart differently from the other bars as in Figure 1 or by exploding a wedge in a pie chart (Mittal, 1997). Attributes of the highlighted graphic component are treated as focused entities. Nouns in captions also serve to establish focused entities. For example, a caption such as “Studying not top priority” would establish the noun studying as a focused entity. Focused entities that appear as instantiations of parameters in perceptual or cognitive tasks serve as evidence that those tasks might be particularly salient. Similarly, verbs that appear in captions serve as evidence for the salience of particular tasks. For example, the verb beats in a caption such as “Canada Beats Europe” serves as evidence for the salience of a Recognize relative difference task. In the future, we plan to capture the influence of surrounding text by identifying the important concepts from the text using lexical chains. Lexical chains have been used in text summarization (Barzilay et al., 1999), and our linear time algorithm (Silber and McCoy, 2002) makes their computation feasible even for large texts. Whether a task is salient and the method by which it was made salient are used as evidence in our plan inference system.
The graphic design makes some tasks easier than others. We use a set of rules, based on research by cognitive psychologists, to estimate the relative effort of performing different perceptual and cognitive tasks. These rules, described in (Elzer et al., 2004), have been validated by eye-tracking experiments. Since the viewer is intended to recognize the message that the graphic designer wants to convey, we contend that the designer will choose a graphic design that makes the requisite tasks easy to perform. This was illustrated in the two graphics in Figure 3. The relative effort of performing a task is thus used as another source of evidence in our plan inference framework. 3.2.2 The Plan Inference Process Our plan inference framework takes the form of a Bayesian belief network. Bayesian belief networks have been applied to a variety of problems, including reasoning about utterances (Charniak and Goldman, 1993) and observed actions (Albrecht et al., 1997). The belief network uses plan operators, along with evidence that is gleaned from the information graphic itself (as discussed in the preceding section), to reason about the likelihood that various hypothesized candidate plans represent the intentions of the graphic designer. Plan Operators for Information Graphics Our system uses plan operators that capture knowledge about how the graphic designer’s goal of conveying a message can be achieved via the viewer performing certain perceptual and cognitive tasks, as well as knowledge about how information-access tasks, such as finding the value of an entity in a graphic, can be decomposed into simpler subgoals. Our plan operators consist of: • Goal: the goal that the operator achieves • Data-requirements: requirements that the data must satisfy in order for the operator to be applicable in a graphic planning paradigm • Display-constraints: features that constrain how the graphic is eventually constructed if this operator is part of the final plan • Body: lower-level subgoals that must be accomplished in order to achieve the overall goal of the operator. Figures 4 and 5 present two plan operators for the goal of finding the value of an attribute for a graphical element (for example, the value associated with the top of a bar in a bar chart). The body of the operator in Figure 4 specifies that the goal can be achieved by a primitive perceptual task
in which the viewer just perceives the value; this could be done, for example, if the element in the graphic is annotated with its value. On the other hand, the body of the operator in Figure 5 captures a different way of finding the value, one that presumably requires more effort. It specifies the perceptual task of finding the values and surrounding the desired value on the axis along with the fraction of the distance that the desired value lies between and , followed by the cognitive task of interpolating between the retrieved values and . Plan inference uses the plan operators to reasons backwards from the XML representation of the observed graphic (constructed by the visual extraction module briefly described in Section 3.1). The display constraints are used to eliminate operators from consideration — if the graphic does not capture the operator’s constraints on the display, then the operator could not have been part of a plan that produced the graphic. The data requirements are used to instantiate parameters in the operator — the data must have had certain characteristics for the operator to have been included in the graphic designer’s plan, and these often limit how the operator’s arguments can be instantiated. The Bayesian Belief Network The plan operators are used to dynamically construct a Bayesian network for each new information graphic. The network includes the possible top level communicative intentions (with uninstantiated parameters), such as the intention to convey a trend, and the alternative ways of achieving them via different plan operators. The perceptual tasks of lowest effort and the tasks that are hypothesized as potentially salient are added to the network. Other tasks are entered into the network as they are inferred during chaining on the plan operators; unification serves to instantiate parameters in higher-level nodes. Evidence nodes are added for each of the tasks entered into the network, and they provide evidence (such as the degree of perceptual effort required for a task or whether a parameter of the task is a focused entity in the graphic as discussed in Section 3.2.1) for or against the instantiated tasks to which they are linked. After propagation of evidence, the top-level intention with the highest probability is hypothesized as the graphic designer’s primary intention for the graphic. Of course, a Bayesian network requires a set of conditional probabilities, such as 1) the probability that perceptual Task-A will be of low, medium, or high effort given that the graphic designer’s plan includes the viewer performing Task-A, 2) the probability that parameter of Task-A will be a fo-
Goal: Gloss: Data-req: Body:
Find-value(, , , , , ) Given graphical element in graphic , can find the value in dataset of attribute for Dependent-variable(, ) 1. Perceive-dependent-value(, , , , ) Figure 4: Operator for achieving a goal perceptually
Goal: Gloss: Data-req: Display-const: Body:
Find-value(, , , , , ) Given graphical element in graphic , can find the value in dataset of attribute for Natural-quantitative-ordering() Ordered-values-on-axis(, , ) 1. Perceive-info-to-interpolate(,,,,,,) 2. Interpolate(, , , , ) Figure 5: Operator that employs both perceptual and cognitive subgoals
cused entity in the caption given that the graphic designer’s plan includes the viewer performing TaskA, or 3) the probability that the viewer performing Task-B will be part of the designer’s intended plan given that Task-A is part of his plan. (Note that there may be several alternative ways of performing a particular task, as illustrated by the two plan operators displayed in Figures 4 and 5.) We have collected a rapidly expanding corpus of information graphics, and have analyzed a small part of this corpus to construct an initial set of probabilities. The results suggest that our approach is very promising. We will increase the number of analyzed graphics to improve the probability estimates. 3.3
Planning the Content of the Summary
The recognized intention of the graphic designer, such as to convey an overall increasing trend or to compare salaries of females and males in different disciplines as in Figure 3a, will provide one set of highly salient propositions that should be included in the graphic’s summary. Once the intentions have been recognized, other visual features of the graphic will influence the identification of additional salient propositions. We conducted a set of experiments in which subjects were asked to write a brief summary of a set of line graphs, each of which arguably could be said to have the same high-level intention. Although each summary included the high-level intention, the summaries often differed significantly for different graphs. By comparing these with summaries of the same graph by different subjects, we have hypothesized that certain features, such as the variance of the data, can influence the generated summary, and that the importance of including a specific feature in
a summary is related to the high-level intention of the graphic. For example, variation in the data will be relevant for an intention of conveying a trend, but it will be less important than the overall slope of the data points. This impact of the intended message on the priority of including a specific feature in a graphic was illustrated in Section 2, where we showed how a significantly larger differential between female and male salaries for one particular discipline would be more relevant to the summary of the graphic in Figure 3a than for the graphic in Figure 3b. In addition, our experiments indicate that the strength of a feature in the graphic also influences its inclusion in a summary. For example, the more ragged a sequence of line segments, the more salient variance becomes for inclusion in a summary. Once the content planning module has identified and ranked interesting features that might augment the intended message of the graphic, the most important propositions will be organized into a coherent summary that can be stored for access in a digital library or presented to a user. In the future, we will also investigate integrating the summary of an information graphic with the summary of its surrounding text. 3.4
Interactive Followup
One of the primary goals of our work is an interactive natural language system that can convey the content of an information graphic to a user with sight impairments. For this application, the summary will be rendered in natural language and conveyed as an initial summary to the user via speech synthesis. The system will then provide the user with the opportunity to seek additional information. We will utilize the propositions that were not in-
cluded in the initial message as indicative of additional information about the graphic that might be useful. Several kinds of followup will be provided. For example, if the user requests focused followup, the system will categorize the remaining propositions (for example, extreme values, trend detail, etc.) and ask the user to select one of the categories of further information. The system will then construct a followup message summarizing the most important (often all) of the remaining propositions in the selected category. This interactive followup will continue until either all the propositions have been conveyed or the user terminates the followup cycle.
4 Summary This paper extends document summarization to the summarization of information graphics. It argues that an effective summary must be based on the message that the graphic designer intended to convey in constructing the graphic, and that this intended message strongly influences the relevance of other propositions that might be included in the summary. The paper describes our approach to graphic summarization, including our plan inference system for inferring the intended message underlying a graphic. This work has many applications. These include enabling information graphics to be accessed via content in a digital library, allowing access to information graphics via devices with small bandwidth (such as cellular phones), and most importantly making information graphics accessible to individuals with sight impairments via an interactive natural language system that can provide summaries at various levels of detail.
References David Albrecht, Ingrid Zukerman, Ann Nicholson, and A. Bud. 1997. Towards a bayesian model for keyhole plan recognition in large domains. In Proceedings of the Sixth International Conference on User Modeling, pages 365–376. R. Barzilay, K. McKeown, and M. Elhadad. 1999. Information fusion in the context of multidocument summarization. In Proc. of the 37th Annual Meeting of the ACL, pages 550–557. Sandra Carberry. 1990. Plan Recognition in Natural Language Dialogue. ACL-MIT Press Series on Natural Language Processing. MIT Press. Eugene Charniak and Robert Goldman. 1993. A bayesian model of plan recognition. Artificial Intelligence Journal, 64:53–79. Marc Corio and Guy Lapalme. 1999. Generation of texts for information graphics. In Proceedings of
the 7th European Workshop on Natural Language Generation EWNLG’99, pages 49–58. Stephanie Elzer, Nancy Green, Sandra Carberry, and James Hoffman. 2004. Incorporating perceptual task effort into the recognition of intention in information graphics. In Diagrammatic Representation and Inference: Proceedings of the Third International Conference on the Theory and Application of Diagrams, LNAI 2980, pages 255–270. Robert Futrelle and Nikos Nikolakis. 1995. Efficient analysis of complex diagrams using constraint-based parsing. In Proceedings of the Third International Conference on Document Analysis and Recognition. Robert Futrelle. 1999. Summarization of diagrams in documents. In I. Mani and M. Maybury, editors, Advances in Automated Text Summarization. MIT Press. Nancy Green, Giuseppe Carenini, Stephan Kerpedjiev, Joe Mattis, Johanna Moore, and Steven Roth. 2004. Autobrief: An experimental system for the automatic generation of briefings in integrated text and graphics. International Journal of Human-Computer Studies. to appear. Barbara Grosz and Candace Sidner. 1986. Attention, Intentions, and the Structure of Discourse. Computational Linguistics, 12(3):175–204. Stephan Kerpedjiev and Steven Roth. 2000. Mapping communicative goals into conceptual tasks to generate graphics in discourse. In Proceedings of the International Conference on Intelligent User Interfaces, pages 60–67. Daniel Marcu. 2000. The rhetorical parsing of unrestricted texts: A surface-based approach. Computational Linguistics, 26(3):395–448. Vibhu Mittal. 1997. Visual prompts and graphical design: A framework for exploring the design space of 2-d charts and graphs. In Proceedings of the Fourteenth National Conference on Artificial Intelligence, pages 57–63. Gregory Silber and Kathleen McCoy. 2002. Efficiently computed lexical chains as an intermediate representation for automatic text summarization. Computational Linguistics, 28(4):487–496. Jin Yu, Jim Hunter, Ehud Reiter, and Somayajulu Sripada. 2002. Recognising visual patterns to communicate gas turbine time-series data. In ES2002, pages 105–118.