International Journal of Parallel Programming, Vol. 33, Nos. 2/3, June 2005 (© 2005) DOI: 10.1007/s10766-005-3575-5
Extracting and Improving Microarchitecture Performance on Reconfigurable Architectures∗ Shobana Padmanabhan,1 Phillip Jones,1 David V. Schuehler,1 Scott J. Friedman,1 Praveen Krishnamurthy,1 Huakai Zhang,1 Roger Chamberlain,1 Ron K. Cytron,1,2 Jason Fritts,1 and John W. Lockwood1
Applications for constrained embedded systems require careful attention to the match between the application and the support offered by an architecture, at the ISA and microarchitecture levels. Generic processors, such as ARM and Power PC, are inexpensive, but with respect to a given application, they often overprovision in areas that are unimportant for the application’s performance. Moreover, while application-specific, customized logic could dramatically improve the performance of an application, that approach is typically too expensive to justify its cost for most applications. In this paper, we describe our experience using reconfigurable architectures to develop an understanding of an application’s performance and to enhance its performance with respect to customized, constrained logic. We begin with a standard ISA currently in use for embedded systems. We modify its core to measure performance characteristics, obtaining a system that provides cycle-accurate timings and presents results in the style of gprof, but with absolutely no software overhead. We then provide cache-behavior statistics that are typically unavailable in a generic processor. In contrast with simulation, our approach executes the program at full speed and delivers statistics based on the actual behavior of the cache subsystem. Finally, in response to the performance profile developed on our platform, we eval-
∗ Sponsored
by National Science Foundation under grant ITR-0313203. A shorter version of this paper was presented at the CTCES workshop in 2004. 1 Department of Computer Science and Engineering, Washington University, St. Louis, MO, USA. 2 To whom correspondence should be addressed. E-mail:
[email protected],
[email protected] 115 0885-7458/05/0600-0115/0 © 2005 Springer Science+Business Media, Inc.
116
Padmanabhan et al. uate various uses of the FPGA-realized instruction and data caches in terms of the application’s performance. KEY WORDS: Reconfigurable; architecture; performance; cycle-accurate hardware profiling.
1. INTRODUCTION Embedded applications are held to a higher standard than desktop applications along a number of dimensions. Not only must the functionality of the application be correct, it often must meet strict time constraints and function with restrictive resource limitations (e.g., power, memory), Conversely, the hardware systems used to execute embedded applications are often dedicated to that particular application, alleviating the need to be as general purpose as desktop systems. As a result, there has been significant interest in the ability to build custom hardware platforms for which the design of the hardware is closely matched to the needs of the application. When one takes this notion to its extreme, one can develop an Application-Specif ic I ntegrated Circuit (ASIC) that is highly optimized for a particular application. The downside of this approach, however, is that the development cost is prohibitive for all but very high-volume applications. When ASIC development is inappropriate, developers of embedded systems have a number of options. First, there are many off-the-shelf processors that have been optimized for embedded applications. The challenge is making an appropriate choice among a large number of alternatives. Second, an off-the-shelf processor (or processor core) can be paired with a custom logic co-processor, constructed using either ASIC or FieldProgrammable Gate Array (FPGA) technology. The co-processor then executes some fraction of the embedded application.(5,11,26,41,47) This further expands the candidate set of execution platforms. Third, there are a number of processors available now that can be at least partially configured at the architectural level, such as Tensilica(52) and ARC(3) . While the systems from ARC are configurable at fabrication time, Stretch(50) makes the Tensilica processor reconfigurable at execution time through the use of FPGA technology on the chip. Academic research into these types of systems is also an active area of investigation.(17,25,29,38) While the options for hardware platforms that enable the execution of embedded applications have grown, the appropriate choice of platform configuration for a given application is difficult. This is at least partially due to the fact that computer system performance evaluation is a difficult task. Analytic performance models are plagued by inaccuracy, and simulation performance models often require excessive execution times. Direct
Microarchitecture Performance on Reconfigurable Architectures
117
measurements can be impossible if the relevant microarchitecture performance details (caches, pipelines) are hidden. Where such performance information is available, the instrumentation inserted into the application to enable the measurement can impact the property under study. Our benchmark application is Stage 1 of the BLASTN algorithm described in Section 2. The string comparisons of that stage are best implemented via hashing,(14,19) and the size of that hash table is important to the storage footprint and execution performance of the entire application. The novelty of our approach is that we consider not only the hashtable size as a parameter of interest for an embedded system, but also microarchitecture features, which we can vary as described in this paper. The result is a more holistic approach to footprint and performance that includes not only the requisite memory (in our case, SRAM) but also the area of the microarchitecture subsystems (in our case, cache). The goal is to separate those features that provide reasonable performance for our application from features that are only considered useful in general. In this paper we present tools and techniques that leverage reconfigurable hardware to obtain very precise measurements of the performance of an embedded system on a sample application (BLASTN, as described in Section 2). Section 3 describes the reconfigurable platform that is the vehicle for the research and experiments reported in this paper. In Section 4, we illustrate our approach for collecting statistics by showing how to collect timing information using an FPGA-deployed circuit; here we extend recent work(45) on using reconfigurable architectures for profiling. Our approach does not instrument software at all, but relies instead on reconfigurable hardware and replicated logic to monitor the cycles spent in each code segment of interest. In Section 5, we extend this work to measure the performance of an on-chip cache, the characteristics of which are otherwise beyond measurement on a standard processor, except through simulation. We then examine various cache configurations for our particular benchmark, using our platform to conduct expeditiously those experiments necessary for determining a reasonable configuration in terms of footprint and performance. We summarize related work in Section 6 and offer conclusions in Section 7. 2. THE BLASTN ALGORITHM Basic Local Alignment Search Tool (BLAST)(1) programs are the most widely employed set of software tools for comparing genetic material. They are used to search large databases in computational biology for optimal local alignments to a query. BLASTN (“N” for nucleotide) is a variant of BLAST used to compare DNA sequences. A DNA sequence is a string
118
Padmanabhan et al.
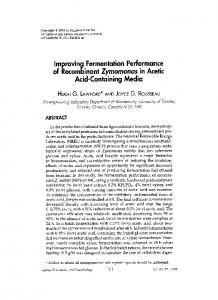
Fig. 1.
Pipeline stages of the BLASTN algorithm.
of characters (bases), with each base drawn from the 4-symbol alphabet {A,C,T,G}. BLASTN is classically implemented as a three-stage pipeline, where each stage performs progressively more intensive work over a decreasing volume of data (Fig. 1): •
•
•
Stage 1 finds word match of length-w strings in the query and database. The query string is divided into Qi − w + 1 strings (w -mers), each containing w bases, where Qi is the length of the query. Each w -mer from the database is compared with the query. Stage 2 extends each successful match from stage 1 by attempting to increase the length of the match left and right allowing character substitution. Stage 3 further extends the matches from stage 2, by allowing insertion (and deletion) of gaps (unmatched material) in the database and the query.
We analyze the performance of an open-address, double-hashing scheme to determine word matches as in stage 1 of BLASTN. We use a synthetically generated database and query containing only bases from {A, C, T, G} for our experiments. In our experiments the bases were generated within the program, using random number generators. For the purposes of these experiments, we used a word size (w ) of 11, which is also the default value of w used by the flavor of BLASTN that is distributed by the National Center for Biological Information (NCBI). 3. APPROACH The Liquid architecture system was implemented as an extensible hardware module on the Field-programmable Port Extender (FPX) platform.(35) The FPX platform, developed by Washington University’s Reconfigurable Network Group,(36) provides an environment where a circuit implemented
Microarchitecture Performance on Reconfigurable Architectures
119
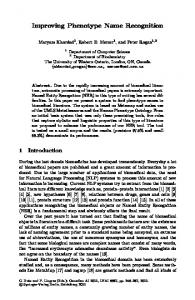
in FPGA hardware can be interfaced with Static Random-Access Memory (SRAM), Synchronous Dynamic Random-Access Memory (SDRAM), and high speed network interfaces. Hardware modules on the FPX can use some or all of a large Xilinx Virtex XCV2000E FPGA to implement a logic function.(28) By using the FPX platform, resulting hardware modules can be rapidly implemented, deployed and tested with live data.(34) The FPX platform has been used to implement several types of systems that use the FPGA hardware to perform network security at high speeds,(37) content scanning,(15) and high-level protocol processing.(43) The Liquid architecture system developed for this work leverages the underlying FPX platform to allow future research in evaluating extensions of the LEON processor and remote control of experiments via the Internet. The major goal of our project is to measure and improve application performance, by providing an easily and efficiently reconfigurable architecture along with software support to expedite its use. We have gathered or developed the components described next. 3.1. Liquid Processor Module Figure 2 shows the high level architecture of the Liquid processor module. To interconnect the hardware to the Internet, the logic within the module was fit within the Layered Protocol wrappers.(9) The wrappers properly format incoming and outgoing data as User Datagram Protocol/Internet Protocol (UDP/IP) network packets. A Control Packet Processor (CPP) routes Internet traffic that contains LEON specific packets (command codes) to the LEON controller (leon ctrl).The leon ctrl entity uses these command codes to direct the LEON processor (Restart, Exe-
FPX
Control Packet Processor
Leon Controller LEON SPARCcompatible Processor I-CACHE D-CACHE
SRAM / SDRAM Controller
Memory Controller
AHB LED LED
APB
Message Generator
UART UART Adapter Adapter
Data / Address
Boot Rom
Layered Internet Protocol Wrappers
Fig. 2.
High-level architecture of the Liquid processor system.
120
Padmanabhan et al.
cute) and to read and write the contents of the external memory that the LEON processor uses for instruction and data storage. Finally, the Message Generator is used to send IP packets in response to receiving a subset of the command codes (e.g. Read Memory, LEON status).
3.2. LEON Processor System Figure 2 also illustrates some of the main components of the LEON processor base system,(20) currently used by the European Space Agency for embedded systems development. As can be seen in Figure 2, the LEON processor system provides a fairly sophisticated computer architecture model. It has many features, such as instruction and data caches, the full SPARC V8 instruction set, and separate buses for high-speed memory access and low-speed peripheral control. For inclusion in the Liquid processor system, it was necessary to modify portions of the LEON processor system to interface with the FPX platform. One such modification was to change the Boot ROM, such that the LEON processor begins execution of user code using the FPX platform’s RAM. All other components necessary to implement the interface between the LEON processor system, RAM, and user were implemented outside of the base LEON processor system. 3.3. Memory Interface The LEON processor comes packaged with a complete memory interface.(32) This includes a programmable ROM, SRAM, SDRAM, and memory-mapped IO devices. The LEON processor uses the Advanced Microcontroller Bus Architecture (AMBA) to connect the processor core to its peripheral devices.(2) The memory controller, which comes as part of the LEON package, acts as a slave on the AMBA High-Performance Bus (AHB) and decodes a 2 GB address space. As mentioned earlier we are currently using only the SRAM for our experiments. Accesses to this 2 MByte memory are always done for a 32-bit word. A read takes 4 clock cycles to complete, whereas writes can happen on every clock cycle, when there is no immediate read after the write. 3.4. Cross Compiler and Control Software We use LEOX 1.0.18, a LEON toolbox opensource distribution.(33) A memory map is extracted from the C program and supplied to the loader in our batch file.
Microarchitecture Performance on Reconfigurable Architectures
121
The web-based control software provides an interface to load compiled instructions over the Internet into LEON’s memory. The different components of the control software system are shown in Fig. 3. When users submit a request from the web interface, the request is received by a Java servlet running on an Apache Tomcat server. The servlet creates UDP (IP) control packets and sends them to the Liquid processor module, at a specified destination IP and port. It then waits for a response and handles the display of the response. It is also responsible for error handling during transmission. The commands currently supported by control software are: • • • •
•
•
LEON status – to check if LEON has started up Load program – to load a program into memory, at a specific address Start LEON – to instruct LEON to execute the program that has been loaded into memory at a given address Read memory – to read a specified number of bytes at a given address. This can be used to verify the program that was loaded, or to read the results of a program which writes results to memory Get statistics – to get program execution time (number of hardware clock cycles), cache statistics (number of cache reads, writes, hits, misses), etc. Reset LEON – to reset LEON
Fig. 3.
Control software tool chain.
122
Padmanabhan et al.
3.5. LEON Processor Implementation on FPX In integrating the LEON processor into the FPX, two main issues were addressed: • •
Defining the location in main memory where the LEON processor should begin execution of user code Arbitrating access to memory between the LEON processor and the web interface
The start of execution location in memory for the LEON processor was defined by modifying the LEON processor’s Boot ROM. In our implementation, programs are sent to the FPX via UDP packets, then written directly to main memory (SRAM) . To indicate to the LEON processor that a valid program is in its main memory, where this program is located, and when to start execution, the following was done: •
•
We modified the default Boot ROM: instead of waiting for a UART event, we poll a specified main memory location (0x40000000), as shown in Fig. 4. We deployed an external circuit between the LEON processor system and main memory that can disconnect the LEON processor from main memory (i.e. always drive zeros on the LEON processor’s data bus), as shown in Fig. 5.
The above ROM modification and external circuitry work together as follows in order to appropriately direct the LEON processor. The external circuitry monitors the LEON processor’s progress through its Boot ROM, by probing LEON’s address and data bus. Once it detects that the LEON processor is about to enter its main memory polling routine, it disconnects LEON from main memory until it finds a non-zero value at address location 0x40000000. While the LEON processor is disconnected from main memory, the external circuitry allows the user to load a program and store that program’s starting address at location 0x40000000. Finally, the external circuitry reconnects the LEON processor to main memory. Once the polling routine reads the non-zero value at location 0x4000000, it jumps to this memory location and begins execution of the user’s program. The last instruction in the user’s program instructs the LEON processor to jump back to its polling loop. On detection of the LEON processor returning to its polling routine, the external circuitry disconnects the LEON processor from main memory until a new program is loaded into main memory, or the user sends a command to re-execute a program already loaded in main memory.
Microarchitecture Performance on Reconfigurable Architectures
123
Set Config registers
Set Config registers
Set up dedicated SRAM space
Set up dedicated SRAM space
Load:
Wait for UART Event
ld reg value btst 1 reg be Load
CheckReady:
Wait for Go Leon
Original Leon Boot code Fig. 4.
flush ld reg ProgAddr cmp 0 reg be CheckReady nop jmp reg
Modified Leon Boot code
Original and modified LEON Boot code.
Send result to user (via IP packet) SRAM data_in
data_out
0
LeonGo CpuAddr
LeonGo Z
LeonGo UserAddr
SRAM_OE CpuData
Leon Processor
Fig. 5.
Leon Control State Machine & User Emulation
UserData CpuAddr
External circuitry for disconnecting LEON for main memory.
124
Padmanabhan et al.
4. CYCLE-ACCURATE PROFILING To improve the performance of an application, one must first determine where the valuable resources are being spent. If time is the metric of interest, then a common approach is to obtain measurements of execution time within each method of the application. Tools such as gprof instrument the application to read a system timer at each method’s entry and exit. Introduction of time-measuring code at the software level has the following disadvantages: •
•
The very act of introducing the code to measure and accumulate the timings can perturb the code, resulting in timings that are inaccurate and perhaps misleading. For example, the timing code is deployed as instructions in the application, and thus occupies space in the instruction cache. This can change the program’s I-cache behavior when timing measurements are taken. Interaction with the system timer can take hundreds of cycles. Thus, to obtain accurate timing of the application code, the timing measurements must account for their own overhead. However, interactions of the timing code with the microarchitecture can cause variations in that overhead. For long-running methods, this may not be an issue, but if timing is performed on very short segments of code, small differences in the timing overhead can translate into large errors in the adjusted observations.
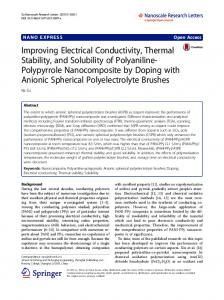
When applied to our BLASTN benchmark, our approach yields the timing results summarized in Fig. 6. In summary, we are able to measure the time spent per method, using our reconfigurable platform without introducing any new instructions into the application. The profiling runs can execute at full speed, without any additional overheads. 5. CACHE BEHAVIOR The results from Section 4 show that over half of our BLASTN (word matching) kernel’s execution time is spent in the coreLoop and findMatch methods. Based on our knowledge of this application, we next evaluate the application’s performance with regard to the memory-subsystem behavior. In particular, we are concerned about the application’s cache performance within the two methods of interest. While most commercially available processors contain on-chip cache, performance statistics for the cache are not typically exported from the chip. Therefore, it is not possible to obtain cache-performance information on such processors simply by instrumenting the software. Application
Microarchitecture Performance on Reconfigurable Architectures
Fig. 6.
125
Cycle-accurate timing results for BLAST.
developers must currently turn to simulation to understand their application’s cache behavior; simulation of a processor’s cache has the following disadvantages: •
•
Simulation is much slower than direct execution. As a result, developers must often be satisfied with full simulation of only a small fraction of the program’s storage references. Moreover, the simulation typically excludes operating system code and other artifacts that affect a program’s performance on an actual system. From our experience using SimpleScalar to obtain detailed performance numbers (such as cache behavior), we have observed more than an order of magnitude increase in completion times. Memoization can improve simulation by an order of magnitude,(42) and approaches that simulate applications by sampling their phases(46) can offer relief. However, direct execution on the FPGA offers even greater performance and runs an application to completion. Simulation is based on an understanding of how the processor’s cache behaves under various conditions. For sophisticated cache systems, there can be implementation details that are difficult to replicate accurately in the simulation. Unless the processor’s relevant logic is faithfully simulated, the results will be inconsistent with the actual hardware implementation. Moreover, the documentation accompanying processors is often inaccurate concerning the details of the chip’s behavior.
126
Padmanabhan et al.
clk0 .wr_hit .wr_miss .rd_hit .rd_miss .total_wr_hit 146 .total_wr_miss 155
147 156
.total_rd_hit 439
440
441
.total_rd_miss 24 Fig. 7.
Cache signals extracted from LEON.
Owing to the flexibility of our reconfigurable platform, we next describe an approach that measures cache behavior precisely and at full speed. Figure 7 shows signals within LEON that are relevant to the cache subsystem. The top signal is the system clock. The next four signals are the writes (hits and then misses) and the reads (hits and then misses). We obtained these signals by modifying LEON’s VDHL to set the signal at appropriate points in the cache subsystem code. These signals are placed on our Event Monitoring Bus; based on the current program counter, the results are accumulated per-method as described in Section 4. The bottom four signals show the accumulation of counts, based on the four signals above. 5.1. Results for Our Benchmark LEON’s cache microarchitecture is parameterized so that the cache’s line size, overall size, and set associativity can be easily selected at configuration time. We next change these parameters for the D- and I-caches and evaluate the cost (in terms of the area occupied by the synthesized bitfile) and performance improvement for the BLASTN benchmark. To understand how its performance might scale, we varied the size of our benchmark’s hash table as follows: • •
32 KB – storing 2500 11-mers into this hash table 128 KB – storing 10,000 11-mers into this hash table
Our application accesses the hash table based on a random sequence of DNA queries. As described in Section 2, a w-mer is a string of DNA that is w bases (characters) long, with each base drawn from a 4-symbol alphabet. Thus, a w-mer occupies 2w bits of storage. The experiments below are characterized and labelled by the hash-table size. In its smallest configuration, LEON offers a 1 KB I-cache and a 1 KB D-cache, with both caches mapped directly. From this base configuration, we explore the merits of the following:
Microarchitecture Performance on Reconfigurable Architectures
127
Fig. 8.
Time to run our application on a Pentium, on our reconfigurable platform, and on a (software)simulator to obtain cache-usage statistics.
•
Increasing the I-cache to 4 KB Increasing the D-cache to 32 KB Increasing the flexibility of mapping the D-cache to 2-way set associative
• •
Before presenting our performance results, we examine the time taken to obtain these results. A single run, where we searched through a 100 Mbase database to find matches to a 10,000 base query, takes 30 min to evaluate a given cache configuration on our reconfigurable platform, which is currently clocked at 25 MHz. While this clock rate is well below the rate available on today’s stock architectures, those architectures cannot provide our results without disturbing at least the program’s instruction stream. Moreover, the number of cache misses and hits is not affected by the clock speed. If we instead tried to obtain these results through simulation using SimpleScalar, then each run would take nearly a day to complete. Figure 8 illustrates this point quantitatively.3 Turning to our benchmark, Table I shows the number of reads and writes issued by our application at each of its hash-table sizes. In all of 3 For
the Pentium, we used a Pentium 4, 2.6 GHz Processor with 512 KB cache and 768 MB of RAM. The simulation is an extrapolation based on runs using a smaller database of 1 million bases, which completed in ∼13 min.
128
Padmanabhan et al. Table I.
Benchmark Statistics
32 KB table
128 KB table
Methods
Reads
Writes
Reads
Writes
findMatch coreLoop Overall
9000000 12606400 32949069
6000000 4260813 15322718
9000000 12614818 33237139
6000000 4261911 15509501
our experiments, the cache’s line size is fixed at 32 bytes; line-size variation is the subject of future work. For our first set of performance results, Table II shows the D-cache hit rates for various D-cache configurations. While the I-cache is held constant at 1 KB, results for the smallest and largest direct-mapped D-cache are shown. The third row in each set shows a 32 KB, 2-way associative cache. Table II shows that the increase in D-cache size to 32 KB does not improve the hit rate dramatically for the 128 KB hash table. However, for the 32 KB hash table, most of the table fits in the D-cache; hence, the number of misses decreases significantly. While the improvement in D-cache performance is impressive, we also learned from these runs that the data cache is actually not crucial to this program’s performance. Given the number of storage operations shown in Table I and the relatively high (∼90%) hit rate in the (smallest) D-cache, our application spent on the order of 5% of its execution time in the data storage subsystem.
Table II.
Benchmark Performance for 1 KB I-cache. D-cache Hit Rates(percentages) are Shown for Various D-cache Configuration
Configuration size 32 KB hash table 1 KB 32 KB 32 KB 128 KB hash table 1 KB 32 KB 32 KB
Methods Assoc
findMatch
coreLoop
Overall
1 1 2
99.2 99.8 99.9
91.2 99.8 99.9
96.3 99.9 99.9
1 1 2
99.1 99.9 99.9
90.8 93.5 94.5
96.0 97.7 98.0
Microarchitecture Performance on Reconfigurable Architectures
129
Further analysis, based on these results, determined that most memory accesses are apparently for stack-allocated variables, which explains the very high hit rates seen in the D-cache. Also, misses in cache occur primarily when accessing the hash table. The latter claim is easily verified by comparing the miss rates in the 32 KB D-cache for the 128 KB and 32 KB hash tables. We next examine the effects of increasing the I-cache from 1 to 4 KB. Table III shows the speedup obtained by moving to a 4 KB I-cache for each of the D-cache configurations. While the effect on coreLoop is negligible, the performance of findMatch is nearly tripled; moreover, the overall program’s performance is more than doubled, for each D-cache configuration, by moving to the 4 KB I-cache. In summary of our findings, our platform enabled us to quickly determine that the smallest D-cache (1 KB) with the largest I-cache (4 KB) yielded an execution time of 25.77 min on the 128 KB hash table. At the other extreme, a 32 KB D-cache and a 1 KB I-cache took 56.13 min. The difference in execution time is a factor of 2.17. We next analyze how the FPGA’s resources are best spent, based on the results we show above. Table IV compares the area consumed by the configurations we tested. For each configuration, the third column shows the percentage of the FPGA’s logic area that is occupied by the entire synthesis. The fourth column shows the percentage of the FPGA’s block RAM that is consumed by all components in the synthesis. Because the cache entries are implemented in block RAM, there is a substantial increase in block RAM usage when the cache is increased from 1 to 32 KB. Increasing the set-associativity of the data cache has no impact on the block RAM and only minimal impact (∼5%) on the occupied space.
Table III.
For each D-cache Configuration, the Speedup Resulting from Expanding the 1 KB I-cache to 4 KB is Shown
Configuration size 32 KB hash table 1 KB 32 KB 32 KB 128 KB hash table 1 KB 32 KB 32 KB
Methods
Assoc
findMatch
coreLoop
Overall
1 1 2
3.31 3.33 3.33
1.00 1.00 1.00
2.26 2.31 2.31
1 1 2
3.19 3.21 3.21
1.00 1.00 1.00
2.19 2.47 2.21
130
Padmanabhan et al. Table IV.
Size
Resources Consumed by Various Cache Configurations Associativity
Logic
Block Ram
1 1 2
45% 45% 50%
28% 71% 71%
7 1 2
46% 46% 51%
32% 75% 75%
1 KB I-cache 1 KB 32 KB 32 KB 4 KB I-cache 1 KB 32 KB 32 KB
Based on the performance numbers shown in Table II, increase in cache size is strongly correlated with cache performance for the benchmark when it uses the smaller hash table. Given the marked increase in block RAM usage, and assuming there may be other uses to which that block RAM could be dedicated, it is possible that a smaller D-cache (of 4 or 8 KB) should be tried with higher set-associativity, since the impact on logic space would be fairly minimal. When Table III is taken into account, it is clear that the best investment of space in terms of performance is the increased I-cache. The larger I-cache causes a modest increase in the logic space (∼1%), uses ∼4% more block RAM, but cuts the runtime by more than half. On the other hand, expansion of the D-cache consumes about the same amount of block RAM but cuts the execution time by only 5%. 6. RELATED WORK 6.1. Heuristic Approaches for Performance Modeling and Measurement The performance modeling approach that yields estimates quickest is analytical models, often derived directly from the source code. Examples of this include: Ref. 8, which describes an approach for the analytical modeling of runtime, idealized to the extent that cache behavior is not included; and Ref. 51, a classic paper on estimating software performance in a codesign environment, which reports accuracy of about ±20%. Due to the simplifying assumptions that are necessary to yield tractable results, analytic models are notorious for giving inaccurate performance predictions. Moreover, application models often require sophisticated knowledge of the application itself. By contrast, simulation and the direct execution we propose are both “black box” approaches.
Microarchitecture Performance on Reconfigurable Architectures
131
The method normally used to improve accuracy beyond modeling is simulation. Simulation toolsets commonly used in academia include: SimpleScalar,(6) IMPACT,(12) and SimOS.(40) Given the long runtimes associated with simulation modeling, it is common practice to limit the simulation execution to only a single application run, not including the OS and its associated performance impact. SimOS does support modeling of the OS, but requires the simulation user manage the time/accuraly tradeoffs inherent in simulating such a large complex system. Performance monitoring in a relatively non-intrusive manner using hardware mechanisms built into the processor is an idea that is supported on a number of modern systems. Sprunt(49) describes the specific counters, etc. built into the Pentium 4 for exactly this purpose. In an attempt to generalize the availability of these resources in a processor-independent manner, the Performance Application Programmer Interface (PAPI)(10) has been designed to provide a processor independent access path to the types of event counters built into many modern processors. There are a number of practical difficulties to this approach, however, as described in Ref. 16. First, since the underlying hardware mechanisms rely on a software interface, they are not truly non-intrusive. Second, the specific semantics of each mechanism is often not well documented by the manufacturer, even to the point where similarly named items on different systems have subtly different meanings. Finally, there are a number of items of interest, such as cache behavior, that are not available at all via these mechanisms. Our work is not the first attempt to use the reconfigurable nature of FPGAs to support performance measurements on soft-core processors. Shannon and Chow(45) have developed SnoopP, a non-intrusive snooping profiler. SnoopP supports the measurement of the number of clock cycles spent executing specified code regions. The address ranges that define code regions are specified at synthesis time. Our work differs in that we can specify address ranges when executing software, which is much more flexible. Further, we provide the ability to monitor additional features of the system (e.g., cache activity). Others have used FPGAs as rapid-prototyping platforms to explore various aspects of a processor’s design, including its performance. Ray and Hoe(39) have synthesized and executed a superscalar speculative out-oforder core for the integer subset of the SimpleScalar PISA. Simpler systems (more on a par with our approach, complexity-wise) include Refs. 22 and 48.
132
Padmanabhan et al.
6.2. Customization for Improved Performance There has been significant work centered around the idea of customizing a processor for a particular application or application set. A few examples are provided here. Arnold and Corporaal(4) describe techniques for compilation given the availability of special function units. Atasu et al.(30) describe the design of instruction set extensions for flexible ISA systems. Choi et al.(13) examine a constrained application space in their instruction set extensions for DSP systems. Gschwind(23) uses both scientific computations as well as Prolog programs as targets for his instruction set extensions. Gupta et al.(24) developed a compiler that supports performancemodel guided inclusion or exclusion of specific hardware functional units. Systems that use exhaustive search for the exploration of the architecture parameter space are described in Refs. 27,31,44. Heuristic design space exploration for application-specific processors is considered in Ref. 18. Pruning techniques are used to diminish the size of the necessary search space in order to find a Pareto-optimal design solution. In Ref. 7, the authors use a combination of analytic performance models and simulation-based performance models to guide the exploration of the design search space. Here, the specific application is in the area of sensor networks. Analytic models are used early, when a large design space is narrowed down to a “managable set of good designs”, and simulationbased models are used to provide greater detail on the performance of specific candidate designs. The AutoTIE system(21) is a development tool from Tensilica, Inc., that assists in the instruction set selection for Tensilica processors. This tool exploits profile data collected from executions of an application on the base instruction set to guide the inclusion or exclusion of candidate new instructions.
7. CONCLUSION AND FUTURE WORK We have presented our results on using a reconfigurable architecture to evaluate some performance metrics – time and cache hits – for one modest application. Our results were obtained from direct execution of the benchmark on a reconfigurable architecture, at full speed and with noninvasive (hardware-deployed) assists for measuring and accumulating the statistics. As future work we shall extend this work to obtain statistics related to other architecture and microarchitecture features, such as instruction counts, branch-table histories, and pipeline activity. Of course, our approach of adding profiling circuitry can consume increasing area in the FPGA as the number of events and methods of
Microarchitecture Performance on Reconfigurable Architectures
133
interest grows. We are currently investigating an approach whose area grows with the number of events and methods actually of interest, rather than the larger number of potential combinations of events and methods. Our evaluation of BLASTN revealed that spending extra chip resources on I-cache was comparably much more effective than spending those same resources expanding or increasing the set-associativity of the D-cache. Our evaluation sampled only a fraction of the microarchitecture configurations that could be deployed and evaluated. In future work, we seek to explore and identify efficient configurations automatically. Generation of all possible combinations is prohibitive; thus, research is needed to explore the microarchitecture design space intelligently. As we move from the microarchitecture to the ISA, we are interested in identifying structures that improve the performance of specific applications, such as software pipelines, new instructions, and specialized data types.
ACKNOWLEDGMENTS We thank James Brodman of the DOC group for his help preparing the figures for this paper. We thank Ed Kotysh and Paul Spiegel for their careful proofreading.
REFERENCES 1. S. F. Altschul, W. Gish, W. Miller, E. W. Myers, et al., Basic Local Alignment Search Tool. Journal of Molecular Biology, 215:403–10 (1990). 2. AMBA Specification, http://www.gaisler.com/doc/amba.pdf (2003). 3. ARC International, http://www.arccores.com. 4. Marnix Arnold and Henk Corporaal. Designing Domain-specific Processors. Proceedings. of the 9th Intrenational Symposium on Hardware/Software Codesign, pp. 61–66, (April 2001). 5. Peter M. Athanas and Harvey F. Silverman, Processor Reconfiguration Through Instruction-set Metamorphosis, IEEE Computer, 26(3):11–18, (March 1993). 6. Todd Austin, Eric Larson, and Dan Ernst, SimpleScalar: An Infrastructure for Computer System Modeling. IEEE Computer, 35(2):59–67 (February 2002). 7. Amol Bakshi, Jingzhao Ou, and Viktor K. Prasanna, Towards Automatic Synthesis of a Class of Application-Specific Sensor Networks, Proceedings. of Int’l Conference on Compilers, Architecture, and Synthesis for Embedded Systems, pp. 50–58 (2002). 8. C. Brandolese, W. Fornaciari, F. Salice, and D. Sciuto, Source-Level Execution Time Estimation of C Programs, Proceedings of the 9th Int’l Symposium on Hardware/Software Codesign, pp. 98–103, (April 2001).
134
Padmanabhan et al.
9. Florian Braun, John Lockwood, and Marcel Waldvogel, Protocol Wrappers for Layered Network Packet Processing in Reconfigurable Hardware, IEEE Micro, 22(3): 66–74, (January 2002). 10. S. Browne, J. Dongarra, N. Garner, G. Ho, and P. Mucci, A Portable Programming interface for Performance Evaluation on Modern processors, Int’l Journal of High Performance Computing Applications, 14(3):189–204 (2000). 11. T. J. Callahan, J. R. Hauser, and J. Wawrzynek, The Garp Architecture and C Compiler. IEEE Computer, 33(4):62–69, (April 2000). 12. P. P. Chang, S. A. Mahlke, W. Y. Chen, N. J. Warter, and W. W. Hwu, IMPACT: An Architectural Framework for Multiple-Instruction-Issue Processors, Proceedings of the 18th Int’l Symposium on Computer Architecture (May 1991). 13. Hoon Choi, Jong-Sun Kim, Chi-Won Yoon, In-Cheol Park, Seung Ho Hwang, and Chong-Min Kyung, Synthesis of application specific instructions for embedded DSP software, IEEE Trans. on Comput. 48(6):603–614 June (1999). 14. T. H. Cormen, C. E. Leiserson, and R. L. Rivest, Introduction to Algorithms, MIT (1990). 15. Sarang Dharmapurikar, Praveen Krishnamurthy, Todd Sproull, and John W. Lockwood. Deep Packet Inspection Using Parallel Bloom Filters. Hot Interconnects, pp. 44–51, CA: Stanford, (August 2003). 16. J. Dongarra, K. London, S. Moore, P. Mucci, D. Terpstra, H. You, and M. Zhou, Experiences and Lessons Learned with a Portable Interface to Hardware Performance Counters, Proceedings of Workshop on Parallel and Distributed Systems: Testing and Debugging (at IPDPS) (April 2003). 17. J. E. Carrillo Esparza and P. Chow, The Effect of Reconfigurable Units in Superscalar Processors, Proceding. ACM Int’l Symposium on Field Programmable Gate Arrays, pp. 141–150 (2001). 18. Dirk Fischer, Jürgen Teich, Michael Thies, and Ralph Weper, Efficient Architecture/Compiler Co-exploration For ASIPs, Proceedings, of Int’l Conference on Compilers, Architecture, and Synthesis for Embedded Systems, pp. 27–34, (2002). 19. Scott Friedman, Nicholas Leidenfrost, Benjamin C. Brodie, and Ron K. Cytron, Hashtables for Embedded and Real-time Systems. Proceedings of the IEEE Workshop on Real-Time Embedded Systems, (2001). 20. Gaisler Research. http://www.gaisler.com. 21. David Goodwin and Darin Petkov. Automatic Generation of Application Specific Processors, Proceedings of Int’l Conference on Compilers, Architecture, and Synthesis for Embedded Systems, pp. 137–147 (2003). 22. M. Gschwind, V. Salapura, and D. Maurer, FPGA Prototyping of a RISC Processor Core for Embedded Applications, IEEE Trans. on Very Large Scale Integration (VLSI) Systems, 9(2):241–250, (April 2001). 23. Michael Gschwind, Instruction Set Selection for ASIP Design, Proceedings of the 7th Int’l Symposium on Hardware/Software Codesign, pp. 7–11, (May 1999). 24. T. Vinod Kumar Gupta, Roberto E. Ko, and Rajeev Barua, Compiler-Directed Customization of ASIP Cores, Proceedings of the 10th Int’l Sympasium on Hardware/Software Codesign, pp. 97–102, (May 2002). 25. S. Hauck, T. W. Fry, M. M. Hosler, and J. P. Kao, The Chimaera Reconfigurable Functional Unit. Proceedings of IEEE Symposium on FPGAs for Custom Computing Machines, pp. 87–96 (1997). 26. John R. Hauser and John Wawrzynek, Garp: A MIPS Processor with a Reconfigurable Coprocessor. Procedings of IEEE Sympasium on Field-Programmable Custom Computing Machines (April 1997).
Microarchitecture Performance on Reconfigurable Architectures
135
27. Olivier Hebert and Yvon Savaria Ivan C. Kraljic, A Method to Derive ApplicationSpecific Embedded Processing Cores, Proceedings of the 8th Int’l Symposium on Hardware/Software Codesign, pp. 88–92, (May 2000). 28. Edson L. Horta, John W. Lockwood, David E. Taylor, and David Parlour, Dynamic Hardware Plugins in an FPGA with Partial Run-time Reconfiguration, Design Automation Conference (DAC), New Orleans, LA (June 2002). 29. Phillip Jones, Shobana Padmanabhan, Daniel Rymarz, John Maschmeyer, David V. Schuehler, John W. Lockwood, and Ron K. Cytron, Liquid Architecture. Workshop on Next Generation Software (at IPDPS), (2004). 30. Paolo Ienne Kubilay Atasu, Laura Pozzi, Automatic Application-Specific InstructionSet Extensions under Microarchitectural Constraints, Proceeding of Design Automation Conference (June 2003). 31. Mika Kuulusa, Jari Nurmi, Janne Takala, Pasi Ojala, and Henrik Herranen, A Flexible DSP core for Embedded Systems, IEEE Design and Test of Computers, 14(4):60–68 (1997). 32. LEON Specification. http://www. gaisler.com/doc/leon2-1.0.21-xst.pdf (2003). 33. LEOX.org. http://www.leox.org. 34. John W Lockwood, Evolvable Internet Hardware Platforms. The Third NASA/DoD Workshop on Evolvable Hardware (EH’2001), pp. 271–279 (July 2001). 35. John W. Lockwood, The Field-programmable Port Extender (FPX), http://www.arl.wustl.edu/arl/projects/fpx/ (December 2003). 36. John W. Lockwood, Reconfigurable Network Group. http://www.arl.wustl.edu/arl/projects/fpx/reconfig.htm (May 2004). 37. John W. Lockwood, James Moscola, Matthew Kulig, David Reddick, and Tim Brooks, Internet Worm and Virus Protection in Dynamically Reconfigurable Hardware, Military and Aerospace Programmable Logic Device (MAPLD), pp. E10, Washington DC, (September 2003). 38. Christian Plessl, Rolf Enzler, Herbert Walder, Jan Beutel, Marco Platzner, Lothar Thiele, and Gerhard Troester, The Case for Reconfigurable Hardware in Wearable Computing, Personal and Ubiquitous Computing, 7(5):299–308, (2003). 39. Joydeep Ray and James C. Hoe, High-level Modeling and FPGA Prototyping of Microprocessors. Proceedings ACM Int’l Symposium on Field Programmable Gate Arrays, pp. 100–107, (February 2003). 40. Mendel Rosenblum, Edouard Bugnion, Scott Devine, and Stephen A. Herrod, Using the SimOS Machine Simulator to Study Complex Computer Systems, ACM Trans. on Modeling and Computer Simulation, 7(1):78–103 (January 1997). 41. C. R. Rupp, M. Landguth, T. Garverick, E. Gomersall, H. Holt, J. M. Arnold, and M. Gokhale, The NAPA Adaptive Processing Architecture, Proceedings IEEE Symposium on FPGAs for Custom Computing Machines, pp. 28–37, (1998). 42. Eric Schnarr and James R. Larus. Fast out-of-order Processor Simulation Using Memoization, Proceedings of the Eighth International Conference on Architectural Support for Programming Languages and Operating Systems, pp. 283–294. ACM Press (1998). 43. David V. Schuehler, James Moscola, and John W. Lockwood, Architecture for a Hardware Based, TCP/IP Content Scanning System, Hot Interconnects, pp. 89–94, Stanford, CA: (August 2003). 44. Barry Shackleford, Mitsuhiro Yasuda, Etsuko Okushi, Hisao Koizumi, Hiroyuki Tomiyama, and Hiroto Yasuura, Memory-CPU Size Optimization for Embedded System Designs, Proceedings of Design Automation Conference, pp. 246–251, (June 1997). 45. Lesley Shannon and Paul Chow, Using Reconfigurability to Achieve Real-time Profiling for Hardware/Software Codesign, Proceedings of ACM Int’l Symposium on Field Programmable Gate Arrays, pp. 190–199, (2004).
136
Padmanabhan et al.
46. Timothy Sherwood, Erez Perelman, Greg Hamerly, and Brad Calder, Automatically Characterizing Large Scale Program Behavior. Proceedings of the 10th International Conference on Architectural Support for Programming Languages and Operating Systems, pp. 45–57. ACM Press, (2002). 47. H. Singh, Ming-Hau Lee, Guangrning Lu, F. J. Kurdahi, N. Bagherzadeh, and E. M. Chaves Filho, MorphoSys: An Integrated Reconfigurable System for Data-Parallel and Computation-Intensive Applications, IEEE Trans. on Computers, 49(5):465–481, (May 2000). 48. Kyung soo Oh, Sang yong Yoon, and Soo-Ik Chae, Emulator Environment Based on an FPGA Prototyping Board. Proceedings of 11th IEEE Int’l Workshop on Rapid System Prototyping, pp. 72–77 (June 2000). 49. Brinkley Sprunt, Pentium 4 Performance-Monitoring Features, IEEE Micro, 22(4):72–82 (2002). 50. Stretch, Inc. http://www.stretchinc.com. 51. Kei Suzuki and Alberto Sangiovanni-Vincentelli, Efficient Software Performance Estimation Methods for Hardware/Software Codesign. Proceedings of Design Automation Conference, pp. 605–610, (June 1996). 52. Tensilica, Inc. http://www.tensilica.com.