Extracting and Visualizing Ocean Eddies in Time–Varying Flow Fields Zhifan Zhu and Robert J. Moorhead II NSF Engineering Research Center for Computational Field Simulation P.O. Box 6176 Mississippi State, MS 39762
[email protected],
[email protected]
1. Introduction Recent progress in global scale ocean circulation modeling has made visualizing ocean model data an important application area of flow visualization. Due to the complexity of ocean flow fields, however, it is difficult to apply traditional techniques of flow visualization. These difficulties come not only in finding a meaningful visual representation of the flow, which is still a challenge in flow visualization, but also in handling the huge amount of data, often gigabytes, from the high–resolution models. The prevailing paradigms for visualizing numerical flow fields include the hedgehog and flow lines [CMB94, vWHdLP94]. The basic hedgehog technique involves plotting arrows at grid points to show the flow magnitude and direction. Although stable, its application is limited by two primary drawbacks: it is essentially a 2D technique and it lacks continuity in representing the flow fields. Flow lines imply all particle–based techniques, including streamlines, stream surfaces, particle traces, etc.. The streamline method is well suited for steady or slow–motion flow fields. They are able to show the detailed local flow properties, but not the whole picture without an exhaustive generation of streamlines. Another category of flow visualization technique is based on vector field topology [HH91]. In this method the local flow structure is first identified in a region and icons are used to depict the fluid dynamics in that region [vWHdLP94]. The technique is able to visualize the detailed flow mechanism in a small region of 3D space. The structure of the icons is important in order to provide a more understandable visual representation of the local flow properties. In visualizing large time–dependent ocean flow fields, two related issues need to be considered in choosing the appropriate technique and the most meaningful visual construction method. First is the application scope, global or regional. A global view leads to a quick understanding of the overall circulation system, while a detailed investigation focused on a particular region of interest provides a higher–resolution comprehension. These two applications require different visualization techniques for optimizing efficiency and accuracy. The other issue is the processing level, which is frequently application dependent. A low processing level means visualizing the raw data without discerning which data are significant and which are trivial. With this method, visualization requires only mapping the flow fields onto images properly. Animation is often needed to disclose the temporal properties of the flow fields. On the other hand, if the high–level ocean features are the application interest, as is often the case, visualization directly focused on these features (high processing level) will make more sense. In the context of ocean circulation, eddies are a dominant physical phenomenon [Rob83]. Observing the migration and interaction of eddies over time and space is of great importance for oceanographers to understand ocean circulations. This paper presents a technique for extracting and visualizing ocean eddies. Four years of data from a longer term simulation of the Pacific Ocean [HWSM92] are used as test data to show the capabilities of the technique.
2. The Pacific model The Navy Layered Ocean Model was developed by the Naval Research Laboratory at Stennis Space Center [HWSM92, Wal91]. The Pacific Model is a 1/8_ eddy–resolving model of the Pacific Ocean north of 20_S. Artificial solid boundaries are placed at 20_S and in the straits at the southern boundary of the Indonesian archipelago. Horizontally, the model covers the area from 110_E to 78_W and from 20_S to 62_N, with a fixed horizontal resolution of 0.125_ 0.176_ (lat, long) for each variable. Vertically, it is a layered model with 6 isopycnal layers. The mean interface depths are 135, 320, 550, 800, and 1050 meters. The other major features of the hydrodynamic model include nonlinear primitive equations, a free surface, a semi–implicit time scheme, full–scale bottom topography in the lowest layer, and arbitrary coastline geometry.
³
+
The output consists of layer thickness deviation H and horizontal transport velocity V (U, V) at a 3.05 model ³ vk and transport velocity V k at day interval for each layer and horizontal location. The relationship of flow velocity ³ ³ the kth layer is given by: V k hk ³ v k, where hk is the layer thickness which can be derived from Hk and the reference depth. Thus the grid depth is a function of both the time and horizontal location. The total data size for a four–year segment is a little over 22 gigabytes.
+
1
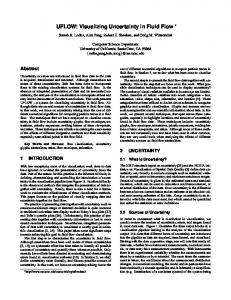
Two sub–regions were selected in the study according to the application interest (Figure 1). Region A covers the area along the western coast of North America, from 145 _W to 110_W and from 15_N to 62_N. Region B extends from 135_E to 170_E and from 35_N to 62_N, containing the Kuroshio Sea area near Japan. The total data size (four years) is about 2.6 gigabytes for Region A and 1.5 gigabytes for Region B. 60N
A
50N
B
40N 30N 20N 10N EQ 10S 20S 120E
140E
160E
180
160W
140W
120W
100W
80W
Figure 1. Two sub–regions in the Pacific Model.
3. Extraction algorithm A typical eddy in the ocean flow fields has a closed or semi–closed circulation pattern. Since the vertical motion is negligible (no vertical velocity component in the data), eddy recognition in the 3D space can be done by detecting its 2D elements at each layer. In the unsteady (i.e., time–varying) flow fields, an eddy consists of a sequence of instances, sampled at consecutive time instance in the data. Thus, an eddy can be decomposed into time–independent 3D instances which are then further decomposed into 2D elements. Identifying eddies is the reverse process of the decomposition. I.e., find 2D elements and coalesce them into 3D instances. Once extracted, eddies can be visualized by mapping their properties into visual images. 3.1. Construction of eddy instance The algorithm starts by computing the centers of 2D elements at all layers. This is done by using the critical point concept to find the spiral centers [SJ92]. With each located 2D element center are associated three basic flow properties, viz., curl, deformation, and divergence. Then a 3D correlation function is used to recognize eddy instances from the detected 2D element centers. The correlation depends on the horizontal locations and the three flow properties. Application criteria, e.g., minimum size and curl, may be employed to eliminate smaller ones. To approximate an eddy’s shape and capture an eddy’s instantaneous characteristics, the simplified geometric deformable model, or SGDM for short, has been developed. The use of geometric deformable model to construct 3D object in scalar fields was presented by [MBL+91]. The concept is extended here to flow fields with different constraints. The SGDM is a simple piece–wise closed 2D deformable model, created about each 2D element center. See Figure 2. An error quantity is calculated over the piece–wise vector differences between the line segments of the
Figure 3. An example of the 3D construction of an eddy from SGDMs. The radiation pattern is randomly generated to animate the eddy rotation. The white lines are SGDMs at various layers.
Figure 2. An example of a SGDM. The dot in the middle is the center of the eddy. The background arrows represent the local velocities.
2
SGDM and the local velocities. An iteration process is used to expand the SGDM to obtain the maximum size while maintaining its closure and keeping the error quantity below a prescribed constraint. In the implementation, this deformation process may begin by placing a small closed model (e.g., a circle or ellipse) around the center and then expanding the model outwards until the error quantity surpasses the threshold. The physical structure of an eddy instance is approximated by the set of SGDMs at each layer. See Figure 3 for example. Vertically, an eddy instance spans a set of successive layers where SGDMs have been successfully formed. The SGDM also provides a good framework from which much of an eddy’s dynamic information can be estimated. In particular, an eddy’s horizontal translational speed and rotation frequency are very useful in tracking and visualization. The instantaneous translational speed is estimated as the net speed over the grids enclosed by the SGDMs. The rotation frequency is computed from the tangent speeds on the SGDM with respect to the center (see Figure 2 for reference). 3.2. Tracking of eddy instance Since an eddy is considered a temporal phenomenon, the complete description must include all its instances along the time axis and the associated properties. Tracking is used to determine which eddy instances belong to the same eddy. It is a predicting and matching process. Prediction is used to predict the eddy’s geo–location from its previous location and translational velocity. The correlation probabilities of eddy instances are calculated between successive time instances. The correlation probability reflects the likelihood of a particular property of an eddy from instance to instance. The ultimate probability, which measures the closeness of two eddy instances, is the weighted sum of the correlation probabilities: P(i, j)
+
ȍ+ N
wkPk(i, j)
k 1
For nT and nT+1 eddy instances detected for time instance T and T+1, respectively, a nT by nT+1 matrix of matching probabilities is generated: P(1, 1)
P(2, 1)
P(n T, 1)
P(1, 2) P(i, j)
P(1, n T)1)
P(n T, n T)1)
Tracking is simply finding the real matches from the probability matrix. A minimum matching probability constraint is imposed to prevent false matches from occurring. 3.3. Parameters and constraints The extraction algorithm includes a few parameters and criteria. Most of them are application dependent. The SGDM error tolerance is defined as the maximum vector difference of a line segment and the local velocity on the SGDM. The quantity reflects the properties of a flow pattern associated with an eddy, particularly the curl and divergence. A strong curl and weak divergence will allow the SGDM to form at a smaller error tolerance, and vice versa. From the ocean physics perspective, a long–lived stable eddy tends to have larger rotation (curl) and less divergence. So a smaller SGDM error tolerance will take in only larger eddies in terms of circulation strength and temporal persistence. However, no quantitative classification of such relationship has been established in oceanic applications. Therefore, a moderate tolerance of 4° was chosen based on an intuitive test. In the test, the tolerance was allowed to increase from 1° to 10° with 1° step size. If the same SGDM was achieved at two adjacent tolerances, the smaller one was taken as the intuitive tolerance. The test was made with five randomly–chosen flow fields. In Figure 4 are the distributions of the intuitive tolerances. The most probable value is around 2°–3°, and the means are 3.6° and 3.9°, respectively in the two regions. The number of points of the SGDM, N, is generally a function of the eddy size and the error tolerance. If the eddy were a perfect circle N would be a function of only the error tolerance. Although an adaptive N is preferred. for sim plicity, a constant N was used. We want the maximum possible length of a line segment to be less than the distance between two model data points. For instance, the horizontal resolution of the data is 0.125° 0.176° (lat lon). That means there is approximately 16 km between data points at the low latitudes. A typical eddy has a horizontal diameter of 50 – 500 km [Rob83, Ber83, Ken94]. A perfect circle with a 500 km diameter requires an N around 100. Consider-
3
ing the irregular shape of eddies and the possibility of eddy diameters exceeding 500 km, a larger N ( = 200) was selected.
NJ NJ
In the tracking process, three correlation probabilities were chosen to compute the matching probability. They are the location, curl, and size matching probabilities. They are proportional to the degree of the similarity in the corresponding eddy’s properties. P1(i, j)
+
P2(i, j)
+
P3(i, j)
+
1 0.1D(i, j) 0,
) 1 , D(i, j) v T D(i, j) u T
)
1 , curl(i) * curl(j) C(i, j) 1 0, otherwise
1 0.1S(i, j)
D
D
u0
)1
where: D(i,j) is the distance between the predicted location of the ith instance and the actual position of the jth instance; C(i,j) is the absolute difference of the curls of the ith and jth instance; and S(i,j) is a size function which is computed as: S(i, j)
|size(i) * size(j)| + Mean(size(i), size(j))
The factor of 0.1 in P1 and P3 is to make the three functions have the same range. TD in P1 is a threshold used to truncate the probability to zero if the actual location is far away from the predicted location. It is a function of mean radii of the two feature instances: TD(i, j)
+ Radius(i) ) Radius(j)
Although other eddy properties are readily available, these three quantities are considered as the most distinct characteristics of eddies. The weights for the three correlation probabilities were chosen as 0.5, 0.3, and 0.2, respectively. They reflect the relative importance of the three contributions in determining the overall matching probability. A geo–location match, for example, means more than a curl match. And the curl closeness outweighs a simple size similarity. These coefficients are also linked to the relative accuracy of the detected eddy properties. For instance, the reliability of the predicted location depends on the instantaneous translational velocity and the data sampling resolution. The 3.05–day sample rate is a quite high resolution for ocean data. The tracking probability threshold is the minimum matching probability constraint. It means that any entries in the matching probability matrix less than the threshold are ignored in tracking. In Figure 5 are the distributions of the matching probabilities that determine the appropriate threshold. 0.40
0.05 A B
0.04
0.30 A B
0.20
0.03 0.02
0.10
0.7
0.8
0.9
1.0
0.01 0.00 0.0
1.0
2.0 3.0 4.0 5.0 6.0 7.0 8.0 SGDM intuitive tolerance (degree)
0.00 0.0
9.0 10.0
Figure 4. Distributions of SGDM intuitive tolerance.
0.1
0.2
0.3 0.4 0.5 0.6 0.7 Matching probability
0.8
0.9
1.0
Figure 5. Matching probability distributions.
The areas under the three peaks roughly correspond to matches of one, two, or all three eddy properties. Since the probability of a perfect match of any two properties can not exceed 0.8 due to the (0.5, 0.3, 0.2) weights, setting the threshold at 0.8 guarantees all tracked eddies match in all three conditions. In other words, the probability of mismatch is kept very small, if not impossible.
4
The last criterion, an eddy’s minimum life–span, is purely dependent on application interest. In our study, a minimum two–month life–span was imposed. That means any tracked eddies that lived less than two months were excluded in the final output.
4. Visualization The algorithm was implemented and the results were saved in eddy description files. Visualization involved simply rendering the results and mapping each eddy’s characteristics into proper visual forms. In Figure 6 are the visualized trajectories of the eddies. They are traced by the eddy centers. Animation of these trajectories is able to illustrate the eddy migration. In Figure 6a, the eddies which emerged below 30_N latitude travel consistently westward in long paths, since the circulation in that area is dominated by the North Equatorial Current. On the other hand, the eddies created near the coast above 40_N tend to meander without being pinched off the coast. No long–term eddy migration pattern is visible in Region B, which includes the sea of Okhotsk, part of the Sea of Japan, and part of the North Pacific Basin around Kuroshio. 60 55 50 60
45
55
40 35
50
30 45 25 40
20 15 215
35 220
225
230
235
240
245
135
250
140
145
150
155
160
165
170
b. Region B
a. Region A Figure 6. Trajectories of eddies (white). The background is the ocean bathymetry.
In Figure 7 are snapshots of the animated visualization from Region B looking westward. Figure 7a presents a global picture of the eddies at a time instance and Figure 7b is a ‘zoomed–in’ image focused on the southwestern corner of the region. The eddy shapes are approximated by SGDMs in each layer. They appear as amorphous objects in the flow fields. The colors on the eddies indicate the instantaneous rotation speed, which is proportional to the energy. In order to animate the eddy rotations, the brightness of the color is modulated by random numbers, resulting in a random pattern radiating from the eddy center (see also Figure 3).
a. Region B
b. A part of Region B
Figure 7. Snapshots of animated eddy visualization in Region B. The view is from east to west. The background is the ocean bathymetry.
5
5. Conclusion Visualization of global scale ocean models is an important application of flow visualization. It is also a challenge due not only to the inadequacies of traditional approaches but also to the difficulty in handling the massive data volumes. The technique discussed in this paper presents a methodology for directly extracting and visualizing ocean eddies, the most prominent phenomenon in ocean physics. It is a high–level feature–oriented flow visualization approach which is particularly useful in providing insights into the dynamic flow mechanisms of eddies. Focusing on extracted features makes the visualization flexible enough to handle various application scopes and helps to alleviate the visualization dilemma when both a global picture and the local details of flow fields are desired. Although the implementation of the extraction algorithm is application dependent, visualization is simple and efficient. Further work will include refinement of the SGDM model and improvement of eddy data management so eddies can be retrieved, for visualization, by their locations in time and space or by their properties.
6. Acknowledgment This work was conducted under the Acoustic Monitoring of Global Ocean Climate program, which is funded by the Strategic Environmental Research and Development Program and sponsored by the Advanced Research Projects Agency. We gratefully thank our colleagues at the Naval Research Laboratory and the NSF Engineering Research Center for Computational Field Simulation for their support in the project.
References [Ber83]
R. L. Berstein, “Eddy Structure of the North Pacific Ocean,” in Eddies in Marine Science, A. R. Robinson, (Ed.), Springer–Verlag, New York, 1983, pp.158–166. [CMB94] Roger Crawfis, Nelson Max, and Barry Becker, “Vector Field Visualization,” IEEE Computer Graphics and Applications, Vol. 14, No. 5, Sept. 1994, pp.50–56. [HH91] James L. Helman and Lambertus Hesselink, “Visualizing Vector Field Topology in Fluid Flows,” IEEE Computer Graphics and Applications, Vol. 11, No.3, May 1991, pp.36–45. [HPvW94] Lambertus Hesselink, Frits H. Post, and Jarke J. van Wijk, “Research Issues in Vector and Tensor Field Visualization,” IEEE Computer Graphics and Applications, Vol. 14, No. 2, March 1994, pp.76–79. [HP93] A. Hin and F. Post, “Visualization of Turbulent Flow with Particles,” IEEE Visualization ’93 Proceedings, San Jose, CA, Oct. 1993, pp.46–52. [HWSM92] Harley E. Hurlburt, Alan J. Wallcraft, Ziv Sirkes, and E. Joseph Metzger, “Modeling of the Global and Pacific Oceans: On the Path to Eddy–Resolving Ocean Prediction,” Oceanography, Vol. 5, No. 1, 1992, pp.9–18. [JM95] Andreas Johannsen and Robert J. Moorhead II, “AGP: Ocean Model Flow Visualization,” IEEE Computer Graphics and Applications, Vol. 15, No. 4, July 1995. [Ken94] Michael J. Kennish, “Physical Oceanography,” in Practical Handbood of Marine Science, 2nd Edition, CRC Press, 1994, pp.3–10. [MBC93] N. Max, B. Becker, and R. Crawfis, “Flow Volumes for Interactive Vector Field Visualization,” IEEE Visualization ’93 Proceedings, San Jose, CA, Oct. 1993, pp.19–24. [MCW92] N. Max, R. Crawfis, and D. Williams, “Visualizing Wind Velocities by Advecting Cloud Textures,” IEEE Visualization ’92 Proceedings, Boston, MA, Oct. 1992, pp.179–184. [MBL+91] James V. Miller, David E. Breen, William E. Lorensen, Robert M O’Bara and Michael J. Wozny, “Geometrically Deformed Models: A Method for Extracting Closed Geometric Models from Volume Data,” Computer Graphics, Vol. 25, No. 4, July 1991, pp.217–226. [Rob83] Allan R. Robinson (Ed.), “Overview and Summary of Eddy Science,” in Eddies in Marine Science, Springer–Verlag, New York, 1983, pp.3–15. [SJ92] Chiao–Fe Shu and Ramesh C. Jain, “Vector Field Analysis for Oriented Patterns,” IEEE Conf. on Computer Vision and Pattern Recognition, June 1992, pp.673–676. [Wal91] A. J. Wallcraft, “The Navy Layered Ocean Model Users Guide,” Naval Oceanographic and Atmospheric Research Laboratory, NOARL Report 35, Dec. 1991. [vWHdLP94] Jarke J. van Wijk, Andrea J. S. Hin, Willem C. de Leeuw, Frits H. Post, “Three Ways to Show 3D Fluid Flow,” IEEE Computer Graphics and Applications, Vol. 14, No. 5, Sept. 1994, pp.33–39.
6