methods implemented in R. We demonstrate the utility of our approach using two large data sets. Keywords--- visual analytics, event detection, time series. 1.
Extracting Events from Spatial Time Series Gennady Andrienko, Natalia Andrienko, Martin Mladenov, Michael Mock, Christian Poelitz Fraunhofer IAIS and University of Bonn, Germany http://www.visual-analytics.info
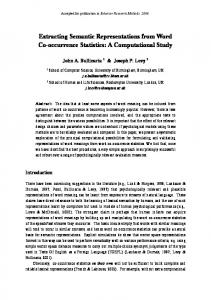
Figure 1 Time graph and event bar, full period (upper image) and focus interval (bottom)
Abstract An important task in exploration of data about phenomena and processes that develop over time is detection of significant changes that happened to the studied phenomenon. Our research is focused on supporting detection of significant changes, called events, in multiple time series of numeric values. We developed a suite of visual analytics techniques that combines interactive visualizations on time-aware displays and maps with statistical event detection methods implemented in R. We demonstrate the utility of our approach using two large data sets.
Keywords--- visual analytics, event detection, time series
1. Introduction Data about temporal and spatio-temporal phenomena and processes are often available in the form of time series of numeric values. A typical case is measurement records coming from sensors, such as temperature or air pollution. Another frequent case is results of data transformations, in particular, aggregation.
For example, data about visits of Web sites or use of various terms in Web searches are available in the form of counts by time intervals. Data about discrete spatiotemporal events like occurrences of diseases, forest fires, or mobile phone calls may be available in the form of aggregates by areas in space and intervals in time. An important task in exploration of time-related data is detection of significant changes that happened to the studied phenomenon over time. In numeric time series, significant changes are manifested as increases or decreases of the values going beyond the usual fluctuations. Depending on the data and application, abrupt or gradual (long-term) changes may be significant. We shall use the term “events” to denote changes significant for a given application. In case of a single time series, events can be detected by visual inspection of a time graph, which is a standard representation technique for time-dependent data adopted in statistics. However, in case of multiple time series, this way of event detection may be too difficult and time-consuming. Our research is focused on supporting detection of events in multiple time series by means of visual analytics methods, which combine computational methods with interactive visualizations. In this paper we propose a suite of techniques for detection and exploration of events in multiple time series, which may be associated with spatial locations. The core visual display is time graph supplied with a rich set of controls for interactive manipulation of the display and data [1,2]. The time graph is dynamically linked to a map and a time geography display called space-time cube [3,17]. Besides, it provides an interface to a set of computational modules for event detection implemented within the statistical package R. Their results are examined by means of interactive filtering and dynamic querying on multiple coordinated views. We illustrate the work and utility of the toolkit on two real data sets. The first one contains weekly aggregates of the Google search data relevant to flu1 by the states of the USA starting from 28/09/2003. The second data set represents monthly counts of forest fires in Italy from 1985 till 2007. The events are aggregated by 107 NUTS3 regions. The aggregated data have been extracted from the European Fire Database of the European Forest Fire Information System (EFFIS), a joint effort of the European Commission and the national fire management services.
series in a summarized form and describes interactive manipulations of time series for detecting patterns of sequential increase or decrease of attribute values. The time graph display may be combined with a time band where time-dependent values such as overall averages or predicted values are represented by coloring or shading [6]. In recent versions of TimeSearcher [7,8], temporal positions of events, i.e. specific features of time series, can be marked on the time graph. Detection of events in time series has been gaining intention of data mining and statistics communities. Typically, problems in this field are connected with answering questions like “when do specific patterns (waveforms) occur in the data” or “are there significant changes in the behavior of the data”. The first problem has been addressed in the works like [9], while the second is usually dealt with in great detail in the branch of statistics known as change-point detection [10,11,12]. Another set of related problems, such as those studied in [13], involves finding periodic patterns in time series. In this work, we focus on user interaction rather than automation, therefore we have favored much simpler algorithms in our initial experiments. We are going to extend this work with more sophisticated methods later.
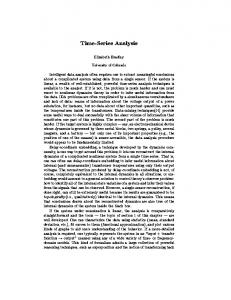
3. Visual analytics toolkit for event detection. For obtaining an initial overview of the data, the time graph display (fig.2 top) is used. In its usual form, this display suffers from overplotting. To overcome this problem, we use a statistical summary display that shows the average and/or median line, the envelope of all time lines, and the positions of the deciles or other quantiles for all time moments connected by lines (fig.2 bottom, described in [2]). Both variants of the time graph support interactive data processing functionality: • zooming the in temporal and attribute dimensions; • dynamic linking to other displays including maps, histograms, scatter plots, and parallel coordinates; • dynamic query by attribute values; • data transformation by arithmetic functions, normalization, smoothing, calculation of changes.
2. Related work Analysis of time series data has been in focus of the information visualization community for a long time. Van Wijk [4] proposed a calendar display representing similarity of daily profiles of energy consumption. A large group of papers proposes advanced functionality for a time series graph. TimeSearcher [5] enables interactive querying of time series by their shapes. Paper [2] suggests approaches to representing multiple time 1
http://www.google.org/flutrends/, acquired 01/03/2010
Figure 2 Traditional time graph display (top) and statistical summary (bottom)
After getting acquainted with the general properties of the data, the user can apply the computational modules implemented in R for finding events. The visual exploration suggests what kinds of events are expected and what parameters of the methods should be used.
3.1. Algorithmic components In the current work, we use two computational methods: peak detection and drift detection. Major parameters of the methods are the amplitude threshold and the time window. We give a user-oriented specification of the procedures followed by a short overview of the algorithms. 1. phEvents(delta,alt): performs change detection on the time series via the Page-Hinckley test. The parameter “delta” controls the minimum deviation from the normal behaviour to be detected (see below); “alt” is a boolean parameter indicating whether the user is interested in increases or decreases of the values. The procedure outputs a list of events, consisting of the time point where a change was detected, along with the test value that triggered the detection. 2. peakDetection(dA,dT,alt): detects peaks in the time series that meet the following criteria: they have an amplitude of at least dA and a width of at most dT. The parameter “alt” controls whether the algorithm detects positive peaks (hills) or negative peaks (valleys). The procedure outputs the position of the peak maxima in a time series and the corresponding amplitudes. The Page-Hinckley test is a sequential inspection scheme that allows detection of changes in the normal behaviour of a process [14]. In particular, the test is designed to monitor drifts in the mean of time series. To detect an increase in the mean of magnitude δ (the delta parameter in the procedure definition), which must be selected by the user beforehand, the test considers a cumulative variable T
mT := ∑ ( xt − xT − δ ) t =t0
where xT is the empirical mean of the time series up to the moment T, and t 0 = 1 . At each step, the minimum of this variable, M T = min(mt0 ,..., mT ) , is also considered. The test will fire an alarm whenever mT − M T > λ . The threshold λ is in principle user-specifiable, although in this case we use a fixed value λ = 4σ / δ ( σ being the standard deviation of the time series) as a heuristic, in order to reduce the number of parameters. If an alarm is fired, we consider that the series after the time point of the alarm are generated according to a new process, therefore we set
t0 = Talarm . The detection of mean decreases, if indicated by the user in the “alt” parameter, is performed in a similar fashion. The algorithm in pseudo code is listed below.
Algorithm 1: Page-Hinckley test Given: - Time series xk of length n - Parameters δ, λ Description of the algorithm: initialize t 0 ← 1, acc ← 0, min ← ∞ . for T=1 to n do mT←0 acc ←acc + xT
xT ← acc /(T − t 0 − 1) for K=t0 to T do mT ← mT + ( xK − xT − δ ) end for if min > mT then min ← mT end if if mT – min > λ then report event (T, mT - min) t0 ←T acc ← 0 min ← ∞ end if end for
The runtime complexity is in O(n2) as can be seen from the nested loops. It can be noted that higher values of the test variable can be associated with more abrupt deviations in the mean, which suggests a way to identify time series with sudden changes among those that increase or decrease more gradually. Regarding the peak detection, we used a modified version of the peak counting algorithm [15]. The algorithm is based on smoothing the signal and finding minima and maxima. This can detect the peaks correctly, but fails to identify exact position of the peak due to the filtering distortion. In the version we use in this paper, we do not rely on smoothing; rather we modified our algorithm similarly to [16] utilizing the user provided parameters dA and dT for determining whether a candidate peak is relevant. This is implemented in a similar way as the mean-shift detection algorithm, but relying on a combination of sequential searches for relative minima and maxima. Once a candidate peak is found, we check its amplitude and width against the parameters dA and dT. This results in a one pass algorithm with a runtime complexity which is linear in n*dT.
3.2. Interactive visualizations After performing event detection, the system adds a so-called “event bar” to the time graph (Figure 1, the event bar is placed below the time graph). The event bar is aligned with the time graph and uses the same time scale. The event bar provides the basic statistics of the events (total number of events, number of time series and time moments involved) and shows positions of the events in time. The number of events that happened at each time moment is shown by greyscale shading of rectangular bars. The shades range from white (no events) to black (maximal number of events).
The event bar enables visual inspection of the temporal distribution of the events. Thus, it can be seen in Figure 1 that the peaks of flu searches frequently occur during late winter – early spring. In two years, 2003 and 2006, many peaks occurred in December. The years 2007 and 2008 had low flu activity, while 2009 had an unusual flu activity in early autumn. The event bar is an interactive control for time series selection and filtering. After clicking on a segment of the event bar the time series that have events in the respective time moment are highlighted on the time graph. The temporal reference of the event(s) is shown by a vertical line. If the time series are associated with spatial locations, the spatial positions of the events can be shown on a map and in a space-time cube [17]. The events are represented by dot symbols. In the space-time cube, a moveable horizontal plane can mark a selected time moment and serve as an additional temporal reference.
4. Flu trends case study In this case study we analyse Google Flu Trends data. The events we are interested in are sharp increases of the number of flu-related queries. We apply the peak detection algorithm with the desired amplitude of 500 and look at the detected events in the space-time cube (Figure 4). Some events are irregularly distributed in space and time; others are grouped by their positions (vertically aligned dots) or by time (arrangements of dots in horizontal planes). We can see that steep increases often occur simultaneously in many states.
Figure 4 Space-time cube shows all peaks of flu queries with amplitude > 500 Then we look at the week when the largest number of the events occurred. This is the week of 26/04/2009; it is represented by the darkest element of the event bar. During this week, large peaks in the number of flu queries occurred in 39 states of the country. We guess that this might be inspired by the swine flu outbreak across the US, which was reported in that week2. In the next step we study how many peaks happened in different states. The states classified according to the total number of peaks (Figure 5) form several spatial clusters. This indicates that spatial neighbourhood may have an impact on the distribution of flu-related events. Figure 3 Space-time cube shows positions of selected events and their temporal distribution Figure 3 demonstrates a step in the exploration of the spatio-temporal distribution of detected events. When the user clicked on a segment of the event bar, the places (states of the USA) in which the corresponding events occurred were highlighted on the map. The user noticed that the states form a spatial cluster on the southeast of the country. The user decided to look also at the other events that occurred in these states with the help of interactive filtering and the space-time cube display shown in Fig.3. The display shows that events in these states often occurred simultaneously or closely in time. This is indicated by horizontal alignments of the dots in the cube. The position of the moveable plane corresponds to the date 17/12/2006.
Figure 5 States are colored depending on the number of peaks over time: green for 2-5 peaks (13 states), yellow for 6-9 peaks (22 states), and red for 10-11 peaks (16 states)
2
http://en.wikipedia.org/wiki/ 2009_flu_pandemic_in_the_United_States
Figure 6 shows the profiles of the time series with frequent and rare peaks. They differ in the amplitude of the peaks and in the times of their occurrence.
Figure 6 Profiles of time series with large number of peaks (top) and small number of peaks (bottom) We also look at the occasional events that happened only in one or two states. Thus, Washington was the only state with a peak of the flu queries in the week of October 09, 2005 (Figure 7; the arrow marks the peak). None of the states had such events during several weeks before and after that. The difference between this time series and the country’s average can be inspected by comparing two lines in Figure 7. The thick line shows the average values while the thin line shows the profile for the selected state. These two profiles are very similar except for two cases when the value for Washington was far above the country’s average.
5. Forest fires case study A time graph of the forest fires counts over time (Figure 9 top) shows that there are regular peaks of the forest fires happening every spring and summer. However, the “peaky” shapes of the lines do not allow us to see the temporal trends in different places. To detect the trends, we smooth the time series by 36-months averages (Figure 9 bottom) and apply the Page-Hinckley test to the transformed data. Two examples of the detected trends are shown in Figure 10 (decreasing trend in 80-ies) and Figure 11 (increasing trend during the recent years). These behaviours are very difficult to find purely by visual inspection because the amplitudes of the time series are moderate and their profiles are hidden among many overlapping lines. The computational methods of event detection helped us to find these two territories with unusual dynamics of forest fires. However, domain interpretation of these results is beyond the scope of this paper.
Figure 9 Overview of the forest fire data: original (top) and smoothed (bottom)
Figure 7 The only time series (Washington) that has a peak in the week of 09 October 2005
Figure 8 The only time series (Hawaii) that has a peak in the week of 05 July 2009 Figure 8 shows the profile for Hawaii that was the only state to have a peak in July 2009. This can be explained by the first death from the swine flu in this state reported on the 29th of June, 2009.
Figure 10 Time series with a decreasing trend
[3] [4] [5] [6]
[7]
Figure 11 Time series with an increasing trend
Conclusion We describe a visual analytics environment for exploring spatially referenced time series data, finding significant changes, and investigating the distribution of these events in space and time. Computational modules allowing fast and efficient detection of events are combined with interactive visualizations, which enable transformations of the original data and investigation of the events. In particular, the event bar display shows the distribution of the events in time and dynamically links a time graph with a map and a space-time cube by simultaneous highlighting and temporal synchronization. We present two case studies based on two real nontrivial data sets. In both data sets we found interesting patterns, some of which would be very difficult to find by only visual methods. We evaluated the computational complexity of the methods. The peak detection procedure is linear with respect to the number of time series and their lengths. The Page-Hinckley test has quadratic complexity with respect to the lengths of the time series, which limits its applicability within interactive environments. We are now developing modules for detecting other kinds of features in time series. We also direct our work towards detection and analysis of periodic patterns of events.
Acknowledgements The work has been supported by the DFG – Deutsche Forschungsgemeinschaft (German Research Foundation) within the Priority Research Programme "Scalable Visual Analytics" (SPP 1335), project ViAMoD, and by EU within project ESS.
[8]
[9]
[10] [11]
[12]
[13] [14]
[15]
[16]
References [1] [2]
N.Andrienko and G.Andrienko. Exploratory Analysis of Spatial and Temporal Data. A Systematic Approach. Springer-Verlag, December 2005 G. Andrienko, N. Andrienko. Visual exploration of the spatial distribution of temporal behaviours. In Banissi, E. et al (Eds.) IV 2005. 9th International Conference on Information Visualization, Proceedings, 6-8 July, 2005, London, UK. IEEE Computer Society, pp. 799-806.
[17]
T. Hägerstrand. What about people in regional science? Papers, Regional Science Association, 24, 7-21. 1970 J.J. van Wijk, E.R. van Selow. Cluster and Calendar Based Visualization of Time Series Data. In InfoVis 1999, pp. 4-9 H.Hochheiser and B.Shneiderman, Dynamic query tools for time series data sets: Timebox widgets for interactive exploration, Information Visualization, 2004, 3(1), 1-18 Hao, M.C.; Janetzko, H.; Sharma, R.K.; Dayal, U.; Keim, D.A.; Castellanos, M. Visual prediction of time series. In IEEE Symposium on Visual Analytics Science and Technology, VAST 2009., pp. 229-230 Buono, P., Aris, A., Plaisant, C., Khella, A., Shneiderman, B. Interactive Pattern Search in Time Series. Proceedings of Conference on Visualization and Data Analysis, VDA 2005, SPIE, Washington DC (2005): 175-186 Buono, P., Plaisant, C., Simeone, A., Aris, A., Shneiderman, B., Shmueli, G., Jank, W. Similarity-Based Forecasting with Simultaneous Previews: A River Plot Interface for Time Series Forecasting. In Proc. 11th International Conference on Information Visualisation. Zurich, Switzerland; 2-6 July, 2007 D. Yankov, E. Keogh, J. Medina, B. Chiu and V. Zordan. Detecting time series motifs under uniform scaling. In Proceedings of the 13th ACM SIGKDD international conference on Knowledge discovery and data mining, KDD 07. August, 2007. Michèle Basseville and Igor Nikiforov. Detection of Abrupt Changes - Theory and Application. Prentice-Hall Inc, Englewood Cliffs, N.J. April, 1993. Valery Guralnik and Jaideep Srivastava. Event Detection from Time Series Data. In Proceedings of the fifth ACM SIGKDD international conference on Knowledge discovery and data mining, KDD 99. 1999. Yoshinobu Kawahara, and Masashi Sugiyama. Changepoint detection in time-series data by direct density-ratio estimation. In Proceedings of 2009 SIAM international conference on data mining. 2009. Michael Small and Kevin Judd. Detecting periodicity in experimental data using linear modeling techniques. In Physical Review E 59(2), pp. 1379-1385. February, 1999. João Gama,Raquel Sebastião and Pedro Pereira Rodrigues. Issues in evaluation of stream learning algorithms. In Proceedings of the 15th ACM SIGKDD international conference on Knowledge discovery and data mining, KDD 09. 2009. Martin Mladenov and Michael Mock. A step counter service for Java-enabled devices using a built-in accelerometer. In Proceedings of the 1st International Workshop on Context-Aware Middleware and Services: affiliated with the 4th International Conference on Communication System Software and Middleware, COMSWARE 09. 2009. Eli Billauer. peakdet: Peak detection using MATLAB. Online, http://www.billauer.co.il/peakdet.htm. Retrieved 26 February, 2010. P. Gatalsky, N. Andrienko, and G. Andrienko, Interactive Analysis of Event Data using Space-Time Cube, In Banissi, E. et al (Eds.) IV 2004. 8th International Conference on Information Visualization, Proceedings, 14-16 July, 2004, London, UK, IEEE Computer Society, pp. 145-152