Christopher J.C. Burges. John C. Platt. Soumya Jana. â. Microsoft Research,. One Microsoft Way, Redmond,WA 98052. ABSTRACT. A key problem faced by ...
EXTRACTING NOISE-ROBUST FEATURES FROM AUDIO DATA Christopher J.C. Burges
John C. Platt
Soumya Jana ∗
Microsoft Research, One Microsoft Way, Redmond,WA 98052 ABSTRACT A key problem faced by audio identification, classification, and retrieval systems is the mapping of high-dimensional audio input data into informative lower-dimensional feature vectors. This paper explores an automatic dimensionality reduction algorithm called Distortion Discriminant Analysis (DDA). Each layer of DDA projects its input into directions which maximize the SNR for a given set of distortions. Multiple layers efficiently extract features over a wide temporal window. The audio input to DDA undergoes perceptually-relevant preprocessing and de-equalization, to further suppress distortions. We apply DDA to the task of identifying audio clips in an incoming audio stream, based on matching stored audio fingerprints. We show excellent test results on matching input fingerprints against 36 hours of stored audio data. 1. INTRODUCTION
audio stream is converted into a low-dimensional trace (a vector). This input trace is then compared against a large set of stored, pre-computed traces, where each stored trace has previously been extracted from a particular audio segment (e.g., a song from a CD). In this paper, vectors are denoted in bold font and their components in normal font, and prime denotes transpose. 2. DISTORTION DISCRIMINANT ANALYSIS DDA automatically extracts features from pre-processed audio using multiple layers. Each layer applies oriented principal components analysis (OPCA) [5] to its input, which attempts to preserve signal while suppressing known distortions. Subsequent layers aggregate outputs of the previous layers over increasingly wide time windows. 2.1. Oriented PCA
Current audio classification, segmentation and retrieval methods often use heuristic audio features, such as the mel cepstra, the zero crossing rate, energy measures, spectral components, and derivatives of these quantities [1, 2, 3]. A system designed with heuristic features may not be optimal: other features may give better performance or may be more robust to noise. This paper presents Distortion Discriminant Analysis, which uses oriented PCA [5] to find a set of projections of an input space which maximize the SNR, and which then combines multiple layers to create a linear convolutional neural network that generates noise-robust features over a long temporal window. DDA assumes that distorted versions of a set of training signals are available. Requiring samples of distorted signals is less stringent and more general than requiring that the real noise model be known. We apply DDA to identify known audio segments in a stream of audio. We call this application “stream audio fingerprinting” (SAF). In SAF, a fixed-length segment of the
In this section we review OPCA, a version of which is used to construct a given layer of our DDA system. OPCA learns a set of L directions vm , given a set of M undistorted training inputs, T i , and N distorted versions of each training input vector, D ik� . If the input of a DDA layer is Ij , then the output is Om = j vmj Ij . We define the signal, si , to be the output of the OPCA layer for the undistorted training inputs, Om (T i ), and the noise, n ik , to be Om (D ik )− Om (T i ). Let µm be the average of sim over i. OPCA chooses the�set of directions that 2 both maximize the signal variance, i (sim − µm ) , and � 2 minimize the noise power, i,k nikm (note that the sim , µm and nikm all depend on the directions vm ). Note that our projection method differs slightly from OPCA in that we use the correlation matrix of the noise in the denominator, rather than the covariance matrix, since we wish to penalize the mean noise signal as well as its variance1 . This simultaneous maximization/minimization can be accomplished by maximizing the generalized Rayleigh quotient [4]. Let Q be the mean over i of T i . If C1 is the
∗ Current address: Department of Electrical and Computer Engineering, University of Illinois at Urbana-Champaign
1 Consider, for example, noise that has zero variance but nonzero mean. We still wish to find directions that are orthogonal to the mean vector.
0-7803-7402-9/02/$17.00 ©2002 IEEE
I - 1021
covariance matrix of the undistorted training inputs, C1 =
1 � (T i − Q )(T i − Q )� M i
stored traces
(1)
1 � (D ik − T i )(D ik − T i )� , NM
4 Hz 20 secondlayer DDA outputs
40
4 Hz
(2)
10 firstlayer DDA outputs
i,k
42
87 Hz
then we wish to find v that maximizes R=
v� C1 v . v� C2 v
L2 distance
64 thirdlayer DDA outputs
and if C2 is the correlation matrix of the difference between distorted and undistorted training inputs, C2 =
-
input trace 4 Hz
128 preprocessed log spectra
(3)
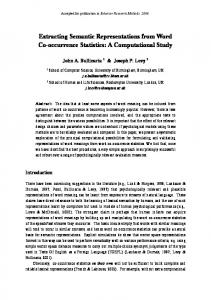
The numerator of R is the variance of the signal projected along v, while the denominator of R is the noise power, projected along v. Requiring that the gradient of R vanishes gives C1 v = RC2 v. (4) Equation (4) is a generalized eigenvalue problem2 , which usually has as many unit-length eigenvector solutions as the dimensionality of the input space. The eigenvalue of each solution gives R, the output SNR, if the input is projected along the corresponding eigenvector v. Thus, the OPCA directions are those L eigenvectors with the largest eigenvalues. Note that as opposed to PCA, which finds a set of orthogonal directions which maximize the signal variance, this approach yields a set of possibly non-orthogonal directions which take into account the noise statistics. OPCA is also related to Multiple Discriminant Analysis (MDA) [4]. MDA is a dimensionality reduction method for classification which creates projection directions whose outputs simultaneously maximize inter-class variance and minimize intra-class variance. MDA also converts this optimization into a generalized eigenvalue problem. However here the denominator of the Rayleigh quotient is generated by applying distortions to each training point, rather than averaging all intra-class covariance matrices. Also, the denominator above is not limited to be a covariance matrix: the distortions need not have zero mean. 2.2. Multiple Layers The DDA stream audio fingerprinting system has three OPCA layers, shown in Fig. 1. Every output is offset and scaled so that the mean of the signal projections is zero and the noise has unit variance. In the SAF system, 128 values are generated every 11.6 ms from the audio pre-processing. The first layer operates 2 which reduces to an ordinary eigenvalue problem if either C or C is 1 2 invertible.
time
Fig. 1. Architecture of the SAF system. on a single frame of 128 values and generates 10 values. The second layer aggregates 42 adjacent frames of firstlayer outputs (420 values corresponding to 1/2 s of audio) and produces 20 values. The second layer is evaluated every 243.6 ms. The third and last layer aggegates 40 temporally adjacent samples of second-layer outputs (800 values corresponding to 10 seconds of audio) and produces 64 values every 243.6 ms. This 64-element input trace is then compared to a database of pre-computed 64 element stored traces, to identify the audio segment. For simplicity, we use Euclidean distance to compare the input trace to the stored traces. A non-Euclidean distance metric may be more accurate, in the likely case that the noise distribution is not spherical Gaussian. In principle, the three layers could be replaced by a single linear operation, which maps approximately 110K inputs onto 64 outputs. However this input size makes the training computation infeasible. By contrast, DDA is efficient in both train and test phases; C1 and C2 can be computed incrementally, enabling the handling of very large training sets, and in test phase, the three-layer DDA only requires 250K multiply-adds per second. 3. EXPERIMENTAL RESULTS In the following experiments, we evaluate the first layer for robustness to input signal distortion; we evaluate the full DDA system for robustness to time misalignment between the input and the stored trace; and we estimate false positive and false negative rates on distorted data using very large test data sets. All results are reported on test sets that are separate from the DDA training set. Our SAF system first converts a stereo audio signal to mono, then downsamples the signal to 11.025 KHz and splits the signal into 23.2 ms frames, which overlap by 11.6 ms.
I - 1022
above the highest point on the OPCA curve, which clearly demonstraces the superiority of OPCA over hand-designed features. 1.4
Noise-to-Signal Variance Ratio
1 0.8 0.6 0.4 0.2 0
0
5
10
15
20
OPCA
25
30
Bark
Fig. 2. OPCA vs. Bark projections for the worst 4 distortions. 2.5
3.1. Robustness to Distortion To evaluate the effectiveness of the first layer, we took 20 s segments from 15 clips from the test set, computed the 7 distorted versions for each, applied the pre-processing, and then computed 10 projections with two different methods: OPCA and a hand-designed feature set. The hand-designed feature set averages the log spectrum over 10 Bark bands from 510 Hz through 2.7 KHz. These bands were heuristically chosen to be robust against the 7 distortions. Fig. 2 shows the measured noise-to-signal ratios for the 10 OPCA projections and 10 Bark projections, when both sets of projections are given the same pre-processed signals and distortions. The OPCA projections are ordered from left to right in order of decreasing generalized eigenvalue (SNR on the training set). For clarity, we only show the 4 worst performing distortions; the remaining 3 were smaller by a factor of 100 (although OPCA improved SNR for these 3 as well). In Fig. 3, we plot the sum of all 7 noise-tosignal ratios for the two kinds of projections. We can sum the noise-to-signal ratios because a given projection has the same denominator for each distortion. Note that the lowest point on the hand-designed Bark projection curve falls
Light Grunge Distort Bass Old Radio Phone
1.2
Summed Variance Ratios
An MCLT [6] is then applied to each frame. A 128-sample log spectrum is generated by taking the log modulus of each MCLT coefficient. Before applying DDA, the SAF system performs two pre-processing steps that suppress specific easy-to-identify distortions. The first pre-processing step removes distortion caused by frequency equalization and volume adjustment. The deequalization step applies a high-pass filter (in frequency) to the log spectrum, which results in a flatter spectrum. The high-pass is performed by taking the DCT of the log spectrum, multiplying each DCT coefficient by a weight (ranging linearly from 0 for the first component to 1 for the sixth and higher components), then performing an IDCT. The second pre-processing step removes distortions in the signal that cannot be heard by a human listener. This step exponentiates the log spectrum from the first step, then generates a frequency-dependent perceptual threshold by an algorithm described in [7]. The final pre-processed signal is then the difference in dB between the log spectrum and the log perceptual threshold, if that difference is positive, zero otherwise. Thus, imperceptible frequencies are set to zero. For the SAF system, the training set of the DDA system comprises 50 20s segments (16.7 minutes of audio) chosen from the middle portion of randomly chosen clips. For every training segment, we constructed 7 distortions using the CoolEdit software tool [8]: a 3/1 compressor above 30dB, a compander, a spline boost of the mid frequency range, a spline notch filter, a ’quick filter’ emulating poor quality AM radio, and two non-linear amplitude distortions.
OPCA Bark
2
1.5
1
0.5
0
0
2
4
6
8
10
Projection ID
Fig. 3. Noise-to-signal ratios summed over distortions, for each of the 10 projections.
3.2. DDA for Robustness to Alignment A stored trace may not align exactly with an input trace, since an input trace is generated only every 250 ms. Misalignment may cause the input trace to not match the stored trace. However, we can train DDA to compensate for misalignment by adding an extra distortion to the training of the last layer: shifting the audio input window forward and back by 125ms. The second experiment takes the same data as the first experiment and computes an input trace for each of the 15 clips. However, in this experiment, the beginning of the 10 second stored trace is shifted randomly by up to 1 second.
I - 1023
Fig. 4 shows the results from two different DDA systems: with and without the extra time-shift training. In Fig. 4, the y axis is the ratio dt /dn , where dt is the smallest distance from a given stored trace to all of the input traces from its corresponding target segment, and dn is the smallest distance from the stored trace to all other, nontarget, input traces. Fig. 4 shows that DDA is effective at reducing noise arising from misalignment of input to the stored trace. We emphasize that this kind of “noise” will be present in any such system, and thus DDA is ideally suited for dealing with it. 0.35 No Shift Training With Shift Training
0.3
(dt/dn)
0.25 0.2 0.15
4. CONCLUSIONS We have shown that DDA is an effective method for generating noise-robust audio features. Each layer of DDA uses OPCA to maximize the SNR of its output. Multiple layers are aggregated in order to enforce shift invariance and reduce computation time. We have applied DDA to stream audio fingerprinting (SAF), and have shown that an SAF system can be constructed to be robust against common audio distortions and misalignment between the input and the stored trace. We have tested this SAF system on a large (500,000) set of input traces and shown that it has a low false positive and false negative rate. In future work, we will test DDA against noise that is not in the DDA distortion set, such as time compression. We will also investigate methods to speed up the database matching, such as KD-trees. Finally, we will investigate non-linear versions of DDA, which should further increase the SNR of the resulting features.
0.1
5. ACKNOWLEDGEMENTS 0.05 0
0
5
10
We thank H.S. Malvar for designing the de-equalization and for supplying the MCLT and perceptual thresholding code.
15
Clip ID
Fig. 4. SAF performance for systems trained with and without alignment robustness.
3.3. Results on Larger Test Sets To estimate the false positive rate, we extracted stored traces from 500 audio clips and created 36 hours of input traces from these same 500 audio clips. In this test, each stored trace is again randomly shifted by up to 1 second. Each stored trace is then compared to ≈ 500, 000input traces, only one of which should match. We set an “accept” threshold to be twice the largest correct distance. With this threshold, only 6 clips and 128 input traces matched an incorrect stored trace. Of these 6 false positive clips, 5 resulted from choosing a stored trace from a quiet, uniform part of the audio clip. Thus, the SAF system has a per clip false positive rate of 1.2%, and a false positive rate per pair of input/stored traces of 5.1 × 10⁻⁷ . Note that we could also use several stored traces for a given clip to further lower the false positive rate at very little extra computational cost. Finally, we added the 7 distortions to the first 10 test clips, in addition to the 1 second misalignment. Of the 70 resulting clips, using the same threshold gave 3 false negatives and no new false positives, yielding a false negative rate of 4.3%. The distortions corresponding to the 3 false negatives are quite severe.
6. REFERENCES [1] T. Zhang and C.-C. Jay Kuo, “Hierarchical classification of audio data for archiving and retrieving,” in IEEE Intl. Conf. on ASSP, 1999, vol. 6, pp. 3001–3004. [2] L. Lu, H. Jiang, and H.-J. Zhang, “A robust audio classification and segmentation method,” in ACM Conf. on Multimedia, 2001. [3] J. T. Foote, “Content-based retrieval of music and audio,” in Proc. SPIE Multimedia Storage and Archiving Systems II, C. Kuo, Ed., 1997, vol. 3229, pp. 138–147. [4] R. O. Duda and P. E. Hart, Pattern Classification and Scene Analysis, John Wiley, 1973. [5] K.I. Diamantaras and S.Y. Kung, Principal Component Neural Networks, John Wiley, 1996. [6] H. S. Malvar, “A modulated complex lapped transform and its applications to audio processing,” in Proc. IEEE Conf. on ASSP, 1999, pp. 1421–1424. [7] H. S. Malvar, “Auditory masking in audio compression,” in Audio Anecdotes, K. Greenebaum, Ed. A. K. Peters, Ltd., 2000. [8] http://www.syntrillium.com/cooledit
I - 1024