Extracting Size and Shape Information of Sound Source in an Optimal Auditory Processing Model Toshio Irino ATR Human Information Processing Research Labs.
and
Roy D. Patterson Centre for Neural Basis of Hearing, Dept. of Physiology, Univ. of Cambridge
2-2 Hikaridai, Seika-cho, Soraku-gun, 619-0288, Kyoto, JAPAN
[email protected] http://www.hip.atr.co.jp/~irino/
Downing Street, Cambridge, CB2 3EG, UK
[email protected] http://www.mrc-apu.cam.ac.uk/personal/roy.patterson/
of articles on details of the spectra of music and speech sounds. There are increasingly sophisticated spectral vocoders for capturing and resynthesising speech sounds (Kawahara, 1997) but they do not explain timbre, or how the auditory system might code timbre. We hear phonemes pronounced by men, women and children as approximately the same although the length of the vocal tract varies considerably from group to group and from speaker to speaker. At the same time, we can identify the speaker group easily. Similarly, we hear the violin, cello, and viola as members of the same family of instruments while also identifying the approximate sizes of the instruments. Sound sources in the world have size and shape and it would appear to be fairly natural to map physical size and shape to the size and shape of structures in auditory representations of sources. This has been an implicit assumption in our auditory image research for some years now (Patterson et al., 1995). The purpose of the research is to move computational hearing forward beyond pitch and loudness to investigate the elements of timbre revealed by the shapes of auditory figures, and to establish measures of the properties that we hear. The impulse response of a vocal tract, or a loss-less acoustic tube, is compressed or expanded in time when the length of the vocal tract is compressed or expanded proportionally with the same cross-area function. The dilated versions of the impulse response can be converted into the same distribution using the Mellin transform (Titchmarsh, 1948). Recently, Irino and Patterson (1997) have derived an auditory filter function using the Mellin transform; it is referred to as the gammachirp and it satisfies the minimal uncertainty constraint (Cohen, 1993). The Mellin transform represents signals in terms of the size and shape of the signal in contrast to the Fourier transform which specifies the energy in a physical frequency band. The mathematics indicates that size is a physical property of a sound, just like repetition rate and intensity, and that it is separate from shape information. The optimal spectral preprocessor for the Mellin transform is a wavelet transform which agrees well with the current understanding of the auditory filterbank, i.e., constant-Q above 500 Hz (Glasberg and Moore, 1990). The
Abstract We hear phonemes pronounced by men, women and children as approximately the same although the length of the vocal tract varies considerably from group to group. At the same time, we can identify the speaker group. This suggests that we extract and separate the size and shape information of sound sources. The impulse response of the vocal tract is compressed or expanded in time when the length of the vocal tract is compressed or expanded proportionally with the same cross-area function. The compressed and dilated versions of the impulse response can be converted into the same distribution using the Mellin transform. In this paper we show that the Mellin transform can be applied to the stabilised wavelet transform that forms the basis of the Auditory Image Model (AIM) of processing in the auditory pathway. The combined processing normalizes source size information and produces a new, fruitful representation of source shape information, referred to as the “Mellin Image.” This “Stabilised Wavelet-Mellin Transform” (SWMT) also provides the mathematical framework for the derivation of the gammachirp auditory filterbank (Irino and Patterson, 1997).
1. Introduction In the conventional psychoacoustic description, sounds have a p i t c h, a l o u d n e s s and a timbre. Pitch is the psychological correlate of the repetition rate of the sound source, loudness is the psychological correlate of the intensity of the sound source, and timbre, or sound quality, is the psychological correlate of everything else. It is still commonly believed that timbre can be explained by the short term power spectrum of the sound, but this has proved a singularly unfruitful hypothesis, limited largely to explaining that sounds with proportionally more high-frequency energy will sound ‘brighter’. Despite 30 years of computer-assisted signal processing, there is still no practical specification of the short-term power spectrum for use in timbre research, and there are no computational models for the timbre of musical instruments and the human voice, despite the wealth -1-
CASA workshop, IJCAI-99 Stockholm, 1 August, 1999
Mellin transform is, however, time variant and so it cannot be applied to the wavelet transform of the signal directly. Briefly, there must be a process between the wavelet and Mellin transforms to identify the appropriate start point for the Mellin transform at all moments in time. The strobed temporal integration process in the Auditory Image Model (AIM) identifies the start point of each cycle of periodic sounds in order to construct the stabilised auditory image (Patterson et al., 1995), and in so doing can provide the necessary start point for the Mellin. This suggests that precortical auditory processing may be regarded as the Mellin transform of the stabilised wavelet transform of a sound, designed to extract size and shape information about the source of the sound. In this paper we describe a computational version of the auditory Mellin transform sounds (Irino and Patterson, 1999a,b).
2.2 Features of the Mellin transform As shown in Eq. (3), the kernel function of the Mellin transform is a complex sinusoid when AF (αfb , τ ) is written as a function of log-time-interval, and this facilitates the application of the Mellin transform. The coefficient − jc + ( µ + 12 ) of the Mellin transform can be rewritten in terms of an operator which is the product of the time and frequency operators (see Gabor, 1946; Cohen, 1993). So the product of time and frequency is essential to the concept of the Mellin transform. Since we need a representation that is invariant to scale change, we select the path of integration in Eq. 3 to be along lines of constant ‘time-interval’ - ‘channelfrequency’ product, i.e., (4) τ ⋅ αfb = h . The representation obtained from Eq. 3 under this constraint is referred to as a Mellin Image (MI). These are the basic ideas of the auditory Mellin transform described in this paper.
2. Auditory Mellin Transform 2.1 The Mellin transform and its precondition
2.3 Stabilised Auditory Image
The impulse response of the vocal tract varies in duration with the length of the vocal tract, for a fixed cross-area function. The various versions of the impulse response can be converted into the same distribution by the Mellin transform. The Mellin transform (Titchmarsh, 1948) of a signal, s(t ) , is defined as ∞
∞
0
0
S( p) = ∫ s(t ) t p−1dt = ∫ s(t ) e ( p−1)ln t dt ,
Incoming sounds are initially analysed by an auditory filterbank; the impulse responses of the individual filters have gamma envelopes and chirping carriers, and the ‘bestfrequency’-to-‘bandwidth’ ratio is essentially constant above 500 Hz (Glasberg and Moore, 1990). This means that the auditory filterbank is basically a wavelet transform (Combes et al., 1989) with a gammachirp kernel (Irino and Patterson, 1997), whose parameter values are set to simulate cochlear filtering. The output of the auditory filterbank is converted into a Neural Activity Pattern (NAP); the process includes half-wave rectification, log or power compression, and adaptation, which together enhance the onset of the signal and sharpen features in the filterbank output. The activity in each channel is monitored to identify local maxima in the activity which are used to control temporal integration. The process operates on the envelope of the activity and specifically on the derivative of the envelope, referred to as ‘delta gamma’ (Irino and Patterson, 1996; Patterson and Irino, 1998). The local maxima occur regularly when the signal is periodic or quasi-periodic as in the voiced parts of speech and sustained musical notes. Temporal integration is strobed on each of the local maxima and temporal integration consists of taking the current segment of the neural activity pattern (about 35 ms in duration) and adding it into the corresponding channel of the auditory image, with whatever is currently in that channel. This Strobed Temporal Integration (STI) process converts the time dimension of the NAP into a time-interval dimension. The log-best-frequency dimension is the same in the new representation. STI is applied separately to each channel of filterbank output; the Stabilised Auditory Image (SAI) is the array of stabilised neural patterns for all of the channels in the auditory filterbank. The auditory image decays continuously with a half life of 30 ms.
(1)
where p is a complex argument. If p = − jc + ( µ + ) where µ is a real constant, then 1 2
∞
S( p) = ∫ s(t ) e ( − jc+ µ −1 / 2 )ln t dt . 0
(2)
These equations show that Mellin transform is not shift invariant in time and so, unlike the Fourier transform, it cannot produce shift- invariant amplitude spectra. To avoid the problem, the Mellin transform has been applied to amplitude spectra after removing phase information (see for examples, Altes, 1976; Cohen 1993; Umesh et al., 1997, 1998;). Although this strategy has proven useful in these signal processing applications, it does not provide a solution to our timbre modelling problem since it removes information that listeners hear (Patterson, 1994). To avoid the shift-varying properties of the Mellin transform, we require a stabilised representation of the sound that preserves temporal fine structure. The stabilised auditory image (SAI) proposed by Patterson (1994a, 1994b) is such a representation, and it is used as the input to Mellin transform in this study. When the input signal is periodic, the pattern in the SAI is also periodic. Any one period of the pattern is referred to as an Auditory Figure (AF). When the AF is designated AF (αfb , τ ) , where αfb is the best-frequency of one auditory filter and τ is the time-interval axis of the SAI, the Mellin transform is tp
M I (h, c) = ∫ AF (αfb , τ )e ( − jc+ µ −1 / 2 )ln τ dτ . 0
(3)
2.4 Size-Shape Image
where tp is the pitch period if the sound is periodic, and h is a constant to be defined shortly.
The SAI is most often presented in a rectangular form with a linear time-interval axis oriented horizontally. There -2CASA workshop, IJCAI-99 Stockholm, 1 August, 1999
(b) 6000
4804
4804
3350
3350
2316
2316
Frequency (Hz)
Frequency (Hz)
(a) 6000
1581 1058
1581 1058
686
686
422
422
234
234
100
100 −5
0
5
10
15
20
−5
0
5
Time Interval (ms)
10
15
(d) 6000
4804
4804
3350
3350
2316
2316
Frequency (Hz)
Frequency (Hz)
(c) 6000
1581 1058
1581 1058
686
686
422
422
234
234 100 0.5
100 0.2
0.52
1.3
3.5
20
Time Interval (ms)
8.9
23
1
2
3
4
5
10
15
Time−Freq. product, h
Time Interval (ms)
30
(e) 6000
(f)
4804
25
20
2316
Mellin coef., c/2π
Frequency (Hz)
3350
1581 1058 686
15
10
422
5
234 100 0
5
10
15
0 0
Time−Freq. product, h
5
10
15
Time−Freq. product, h
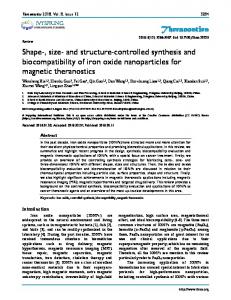
Figure 1. Auditory Mellin transform of a click train. (a) Stabilised Auditory Image (SAI), (b) Filter Response alignment, (c) Log transform of the time-interval axis, (d) Impulse response alignment, (e) Size-Shape Image (SSI), and (f) Mellin Image (MI).
rate of 100 Hz. The click train produces a pitch like that of a male speaker with a ‘deep’ voice. The ordinate is channel best frequency in Hertz and it is a quasi-logarithmic frequency axis. The abscissa is time-interval in milliseconds from the local maximum that initiated temporal integration; it is a linear axis in this representation. The main verticals are spaced by the period of the original wave. The zero on the abscissa is the point to which the local maxima are mapped during temporal integration. The local maxima identify the individual cycles of periodic signals in each
is also a spiral form of the auditory image (Patterson, 1987) but that is for musical pitch comparisons at a higher level in the system. In this and following sections, we describe how the SAI is converted first into a Size-Shape Image (SSI) and then into a Mellin Image (MI), which is the output of the auditory Mellin transform. An example of a stabilised auditory image from the standard AIM model (Patterson, et al., 1995) is presented in Fig. 1(a). It shows just under three cycles of the pattern produced in the auditory image by a click train with a click -3-
CASA workshop, IJCAI-99 Stockholm, 1 August, 1999
dashed vertical shows points in the AF where the product of time-interval and best-frequency, h, is unity. For the click train, which produces impulse responses in all of the wavelet filters, the activity is concentrated on verticals at integer multiples of h. This is emphasised in Fig. 1(e) which is a version of Fig. 1(d) with a linear h axis; the response in each channel is a transformed and aligned version of the wavelet kernel. This figure is actually produced directly from Fig. 1(e); the sample points in each channel are re-sampled proportional to the best frequency of the channel and, thus, the activity on the line h=0 appears once again in the figure. The solid curve is the boundary of the AF. The shape of an AF does not change with the size of the source in this representation; the AF just moves up or down the verticals as source size decreases or increases, respectively. Accordingly, this representation is referred to as the SizeShape Image, or SSI. It is particularly useful for visualising the shapes associated with the AFs of vowel sounds, as will be illustrated in the next subsection. The auditory figure in Fig. 1(e) is derived from the leftmost frame in the SAI of Fig. 1(a), but this need not be the case. The origin for the AF in the SSI can be the start point of any of the AFs in the SAI; that is, any multiple of the period of the sound. For example, there is a concentration of activity on the 10-ms vertical in the SAI, corresponding to the period of the click train, and it is equally reasonable, to use the AF beginning at this vertical, as the start point for the alignment, log transform, and rotation that produce the SSI. Indeed, when tonal signals occur in noise, the characteristics of the tone are better represented by the second AF of the SAI; the pattern of activity in the first AF of the SAI contains proportionally more of the noise component. The horizontal profile of the SSI emphasises information about the impulse response of the wavelet kernel, and deviations from the impulse response produced by a sound, and so it is referred to as the impulse profile of the SSI. The vertical profile is the auditory spectrum of the auditory figure, and is referred to as the spectral profile of the SSI.
channel, and the start points for features in non-periodic signals. In this way, STI identifies the cycles of sound waves and produces candidate start points, or zeros, for the Mellin transform at each multiple of the period of the wave. The Mellin transform includes the assumption that the channels of the initial wavelet filterbank are aligned such that the start points of the individual impulse responses are all zero. STI introduces a negative phase shift to the lowfrequency channels because of strobing local maxima in the response. The misalignment is illustrated by the curve of pulses to the left of each main vertical in the auditory image in Fig. 1(a). The SAI can be realigned simply by shifting each channel to the right by one period of the centre frequency of the auditory filter prior to auditory figure extraction. The aligned SAI for Fig. 1(a) is presented in Fig. 1(b). The main verticals now provide a very good approximation to the correct start point for the Mellin transform. The STI process stabilises the repeating time-interval patterns produced by tonal sounds in the NAP, and generates concentrations of activity on vertical lines that divide the auditory image into frames whose width is the period of the original sound. The pattern of time intervals produced by a tonal sound in any one frame is referred to as an Auditory Figure (AF), and the frame itself is referred to as a frame of the auditory image. The time-interval profile of the SAI (Fig. 1(a)) is referred to as the ‘summary SAI’, and it is used to identify the period of the sound, which is then used to identify the boundaries for extraction of one auditory figure. To normalise impulse-response length, the time-interval axis of the auditory figure is transformed into a log-timeinterval axis. This operation converts the curved impulse response lines of the auditory figure into parallel, regularly spaced lines that are essentially straight in the region above 500 Hz. Figure 1(c) shows the transformed version of the leftmost auditory figure from the SAI in Fig. 1(a) with a logarithmic time-interval axis. It was derived from Fig. 1(b) using a spline interpolation of the sampling points. The vertical solid line is the boundary of the AF. The activity associated with the ringing of the auditory filters in response to an click falls along the dashed lines in this representation of the AF. The slope of the lines is that of the negative diagonal across the AF frame. The dimensions of the representation are log-time-interval and log-frequency, and this is the form that facilitates calculation of the Mellin transform. The calculation of the Mellin transform and the shape of the sound source are more easily understood if the AF with log-time-interval axis (Fig. 1(c)) is time-interval aligned to reorient the diagonals to the vertical as shown in Fig. 1(d). Each channel is time-interval shifted by an amount equal to the log of the best frequency of the channel. The verticals that bound the region of the AF in Fig. 1(c) now appear as diagonals in Fig. 1(d). The new abscissa is the product of time-interval and best-frequency, designated h (Eq. 4), on a logarithmic frequency scale. The ordinate remains bestfrequency on a logarithm frequency scale. The left-most
2.5 Mellin Image The SSI is dominated by the impulse response of the wavelet transform even when the sound is other than a click train. To extract information like the resonances of the source, it is useful to separate the impulse response information from other source information in the SSI. Figures 1(d) and 1(e) show that the peaks on verticals of constant, integer h are all similar in height, indicating that, for a click train, the distribution is largely flat across bestfrequency. This suggests that a form of deconvolution can be achieved by calculating the spatial Fourier transform (FT) of the SSI along each vertical. In this case, the majority of the impulse response will be concentrated at very low spatial frequencies; whereas, information about resonance spacing will occur at higher spatial frequencies. This is a transformation of the SSI in which each vertical vector is replaced by the magnitude of the Fourier transform of the activity on the corresponding SSI vector. Specifically, it is
-4CASA workshop, IJCAI-99 Stockholm, 1 August, 1999
the integration of the SSI, ASSI (αfb , h) , with a kernel function that is a complex sinusoid on log- frequency; that is,
M I (h, c) = ∫
α max fb
α min fb
and Kasuya, 1995). In the case of speech, the goal of the SSI and MI is to characterise vocal tract shape independent of length and glottal pulse rate. One of the vowels had the original vocal tract length and was excited by glottal pulses at a 100-Hz rate. The auditory image of this vowel is presented in Fig. 2(a) which shows how vocal tract resonances extend the impulse responses in the frequency regions of the resonances. In speech research, these resonances are referred to as formants. The second and third formants of the vowel have centre frequencies of approximately 1100 and 2500 Hz, respectively. The other ‘a’ vowel was produced using a vocal tract with the same crossarea function but the length was shortened by 1/3, and the glottal rate was increased to 160 Hz. The auditory image of this vowel is presented in Fig. 2(b). The relative positions of the second and third formants are the same in the two figures, but the absolute positions have moved up by a factor of 3/2 in Fig. 2(b) to about 1600 and 3800 Hz, respectively, due to the shortening of the vocal tract. The spacing of the main verticals in Fig. 2(b) is closer together than in Fig. 2(a), reflecting the increased glottal rate. The size-shape images (SSI's) for the two vowels shown in Figs 2(a) and 2(b) are presented in Figs 2(c) and 2(d), respectively. The distinction between the response to the glottal pulses towards the left of the AF and the formants towards the right of the AF is enhanced in these auditory figures. Comparison of the SAI's and SSI's shows that the channel-based re-sampling changes the emphasis of the formants. For example, in the SAI in Fig. 2(a), the second formant is about three times the duration of the fourth formant, but in the SSI in Fig. 2(c), the two have about the same extent on the frequency-weighted, time-interval dimension, h. Without the re-sampling, the higher formants would have very little affect on form of the MI. The alignment of channels in the SSI also makes it easier to determine when the impulse response gives way to the resonance properties of the source. The pattern of activity produced by the first four formants of the two vowels is very similar in the two SSI’s (Figs 2(c) and 2(d)); the main difference is that the pattern is shifted up as a unit for the shorter vocal tract (Fig. 2(d)). The fifth and sixth formants shown in Fig. 2(c) also shift up with the pattern when the vocal tract is shortened; they are not visible simply because of the limited frequency range of the analysis. The other difference is the right-hand boundary of the AF which is determined by the repetition rate of the wave and so is more limited for the vowel with the higher pitch (Fig. 2(d)). The Mellin Images of the two vowels are presented in Figs 2(e) and 2(f). The ordinate of the MI is the Mellin coefficient, c/2π. The unit is cycles/best-frequency-range which means that an ordinate value of unity in the MI corresponds to a spatial frequency in the SSI whose period is the full frequency range of the SSI ordinate from 100 to 6000 Hz. The abscissa of the MI is the product of timeinterval and best-frequency, h, as in the SSI. The amplitude values in the MI associated with a specific value of h show
ASSI (αfb , τ )e{− jc−( µ −1 / 2 )}ln αfb d (αfb ) (5)
The result is another two-dimensional image in which each vertical is the magnitude spectrum for the corresponding line of the SSI. The new representation is referred to as the Mellin Image (MI). It has the same abscissa, h, as the SSI, but the ordinate is a new variable, c/2π, which is the spatial frequency of the Fourier transform. The vertical position of an auditory figure in the SSI is converted into phase information in the Fourier transform, and as such does not appear in the magnitude spectrum. Thus, the MI version of the auditory figure presents shape information about the source in a form that does not change with the size of the source or the repetition rate of the excitation of the source. The MI of the AF of the click train (Fig. 1(e)) is presented in Fig. 1(f); the click response is restricted to the lowest spatial frequencies, as expected, because the response in the SSI on any vertical line is essentially flat. In point of fact, the amplitude of the response in the SSI rises slowly with best frequency because auditory-filter bandwidth increases with best frequency; otherwise the click response would be even more restricted. The repetition rate of the sound affects the upper limit on the frame width of the auditory figure, but the form of the MI is unchanged and the activity is little affected for speech sounds.
2.6 Equivalence of two equations Finally, consider the relationship between the MI presented in Eq. 5, which is written in terms of frequencydomain integration, and the Mellin transform presented in Eq. 3, which is written in terms of time-interval-domain integration. The time-frequency constraint presented in Eq. 4 can be rewritten in logarithmic terms as (6) ln τ + ln αfb = ln h . Since h is a constant, the derivative of this equation is 1 dα 1 (7) =− α dτ τ Substituting Eq. 7 into Eq. 5 and replacing the SSI, ASSI (αfb , h) , with the original auditory figure, AF (αfb , τ ) , leads to
M I (h, c) = ∫
α max
α min
=∫
α max
α min
ASSI (αfb , h) e
ASSI (αfb , h) e
tp
= ∫ AF (αfb , τ ) e
{ jc −( µ − 12 )}ln αfb
{ jc −( µ + 12 )}ln αfb
(1 / α )dα (8)
{ jc −( µ + 12 )}(ln h − ln τ )
( −1 / τ )dτ
0
{ jc −( µ + 12 )}ln h
= {− e
tp
{− jc +( µ − 12 )}ln τ
}∫ AF (αfb , τ ) e 0
f b dα
dτ
So, Eq. 5 and Eq. 4 are the same except for a constant.
3
Characteristics of the SSI and the MI
3.1 Two versions of vowel ‘a’ Two synthetic ‘a’ vowels were constructed to illustrate the invariance properties of the SSI and Mellin Image. The vowels were produced using a typical vocal tract model with cross-area functions from one specific male speaker (Yang -5-
CASA workshop, IJCAI-99 Stockholm, 1 August, 1999
(b) 6000
4804
4804
3350
3350
2316
2316
Frequency (Hz)
Frequency (Hz)
(a) 6000
1581 1058
1581 1058
686
686
422
422
234
234
100
100 −5
0
5
10
15
20
−5
0
5
Time Interval (ms)
10
15
(d) 6000
4804
4804
3350
3350
2316
2316
Frequency (Hz)
Frequency (Hz)
(c) 6000
1581 1058
1581 1058
686
686
422
422
234
234
100
100 0
5
10
15
0
5
Time−Freq. product, h
10
30
(e)
(f)
25
25
20
20
Mellin coef., c/2π
Mellin coef., c/2π
15
Time−Freq. product, h
30
15
15
10
10
5
5
0 0
20
Time Interval (ms)
5
10
15
0 0
Time−Freq. product, h
5
10
15
Time−Freq. product, h
Figure 2. (a),(b) Stabilised Auditory Images (SAI), (c),(d) Size-Shape Images (SSI), and (e),(f) Mellin Images (MI) of synthetic vowels 'a.' The vowel 'a' in the left panels was produced from a vocal tract having measured cross-area function (Yang and Kasuya, 1995) and a 100 Hz glottal pulse rate. The vowel 'a' in the right panels was produced with a glottal rate of 160 Hz from a vocal tract having the same cross-area function but with the tract length shortened by 2/3.
centred about spatial frequencies of 6, 10, and 14. These features appear in the same vertical position in the two MI’s (Figs 2(e) and 2(f)), demonstrating the value of the MI as a means of normalising for vocal-tract length.
the spatial frequency components of the distribution of activity in the corresponding column of the SSI. For the first few integer multiples of h in the SSI of the vowel ‘a’, the activity in the SSI is broadband in response to the glottal pulse. As a result, the activity is primarily at spatial frequencies below about c/2π values of 4 in the MI. As the value of h increases from 3 to 6, the formats begin to appear as separate bands in the SSI and activity appears in the MI
3.2 Two Japanese vowels ‘i’ and ‘u’ Two Japanese vowels, ‘i’ and ‘u’, were selected to illustrate how vowel differences appear in the size-shape image (SSI) and the Mellin image (MI). These vowels are -6CASA workshop, IJCAI-99 Stockholm, 1 August, 1999
(b) 6000
4804
4804
3350
3350
2316
2316
Frequency (Hz)
Frequency (Hz)
(a) 6000
1581 1058
1581 1058
686
686
422
422
234
234
100
100 0
5
10
15
0
5
Time−Freq. product, h
10
30
30
(d)
25
25
20
20 Mellin coef., c/2π
Mellin coef., c/2π
(c)
15
15
10
10
5
5
0 0
15
Time−Freq. product, h
5
10
15
0 0
Time−Freq. product, h
5
10
15
Time−Freq. product, h
Figure 3. (a),(b) Size-Shape Images (SSI), and (c),(d) Mellin Images (MI) of synthetic vowels 'i' (left panels) and 'u' (right panels). The vowels were synthesised using the same vocal tract model but different cross-area values for the different vowels. The speaker was the same as for vowel 'a' in Fig. 2(a).
distant from ‘a’ in the traditional vowel quadrilateral (Fant, 1970); Irino and Patterson (1999a) present comparable SSI’s and MI’s of the Japanese vowels ‘e’ and ‘o’. All five vowels were synthesised with the vocal tract model of one male speaker but with different cross-area values for the different vowels (Yang and Kasuya, 1995). The vocal tract length was fixed as was the glottal excitation rate which was 100-Hz. The SSI’s for the two vowels ‘i’ and ‘u’ are presented in Figs. 3(a) and 3(b), respectively; the corresponding MI’s are presented in Figs. 3(c) and 3(d) Compared to the SSI of ‘a’, the SSI of ‘i’ has more closely clustered higher formants (compare Figs. 3(a) and 2(c)). The formants also extend to higher h values in the SSI of ‘i’. The clustering leads to activity at c/2π values of 13 20 in the MI (Fig. 3(c)) extending to h values of 10, whereas the activity in the MI of ‘a’ (Fig. 2(e)) is centred on c/2 π values of 10, 14, and 18 and is limited to h values of about 8. The SSI and MI for the vowel ‘u’ (Figs 3(b) and 3(d)) are simpler because the bandwidths of the formants are relatively wider; as a result, they do not extend far out into the SSI or MI. There are, however, distinctive features at small h values: in the range 2-5, there is strong activity at c/2π values around 7, and in the range 4-5, there is strong activity at c/2π values around 14.
In summary, the frequency spacing and temporal range of the formants is directly reflected in the MI, and so it provides unique templates for the vowels that are independent of voice pitch and vocal tract length; that is, the template is fixed in position in the MI.
5
Summary and Theoretical Implications
We have described a ‘Stabilised Wavelet-Mellin Transform’ (SWMT) for extracting source information from waveforms and an auditory version of the SWMT for extracting vowel information from speech. This involved 1) specifying the role of existing auditory processes and representations (such as the auditory filterbank, the auditory image, and the auditory figure) in the larger SWMT framework, 2) developing a form of the Mellin transform that could be applied to auditory images to complete the SWMT, and 3) illustrating the relationships between the auditory image, the size-shape image (SSI), and the output of the Mellin transform for vowel sounds. The representation produced by the SWMT is referred to as a ‘Mellin Image’ (MI); it normalises for source size and so the image presents source shape information independent of source size. The size information is represented as the vertical position of the pattern of source activity in the 'Size-Shape Image' (SSI) (or as the phase components of the Mellin transform). Thus, size -7CASA workshop, IJCAI-99 Stockholm, 1 August, 1999
Signal
information is also available, and compactly represented within the SWMT framework. The relationship between the mathematical framework of the SWMT and peripheral auditory processing is illustrated in Fig. 4. It has often been noted that the auditory filterbank is like a wavelet transform (left column), but the reasons why this is the case are never explained. We hypothesise that the auditory system wishes to combine the advantages of the Mellin transform with spectral analysis. The Mellin transform converts dilated and compressed versions of a signal into the same distribution and so enables the system to recognise the relationship between similar sources that differ mainly in size. Spectral analysis allows it to reduce the problem of one source interfering with another whenever they differ in frequency content. The question, then, is how to perform a spectral analysis within the Mellin-transform framework, and the answer is the wavelet transform. When presented with dilated or compressed versions of a signal, the wavelet filterbank converts them into two-dimensional surfaces that have the same shape as the original; that is, when plotted on log-log coordinates the surfaces only differ in terms of their position in the frequency dimension. In this case, the Mellin transform will convert them into the same distribution and the similarity between the sources will be recognised. Thus, the wavelet transform is the correct form of spectral analysis for the Mellin transform because it is transparent to dilation and does not introduce any distortion into the Mellin representation (diagonal arrow). It is also the only form of spectral analysis that avoids distorting the Mellin representation. An optimal form for the wavelet kernel within the Mellin-transform framework can be derived using the minimal uncertainty constraint (Cohen, 1993) (horizontal arrow). Irino and Patterson (1997) showed that when the wavelet transform has a specific, gammachirp kernel, (rather than a Gabor (1946) kernel)(left dashed panel), the resulting wavelet transform is very similar to the auditory filterbank measured physiologically and psychophysically (lower panels). The Mellin transform, however, is not time invariant; it requires that the appropriate start point for analysing the output of the wavelet filterbank be specified at all times ( u p p e r right panel). The pitch synchronous pattern stabilisation applied to the output of the auditory filterbank in the Auditory Image Model (AIM) (Patterson, et al., 1995) performs this task. It illustrates the type of stabilisation process that must be inserted between the wavelet and Mellin transforms to produce a continuous form of the Mellin transform that is effectively time invariant. It is also possible to produce a version of the SWMT without the non-linearities inherent in the auditory system for analysing other sources of mechanical vibrations such as those produced by engines or motors. Acknowledgements
Periphery Auditory Filtering
Minimum Wavelet Transform Distortion Fourier Transform
Auditory Filter Gammachirp Gabor / Gauss
Physiological Observations
Minimum Uncertainty
Pathway Cortex Signal Synchronous Analysis Stabilised Auditory Image (SAI) Start Point Size and Shape Extraction Mellin Transform
Psychoacoustical Observations
Figure 4. A framework of a 'Stabilised Wavelet-Mellin Transform' shows the strength of the auditory peripheral filtering and the requirements of signal synchronous analysis. Science and Technology) of the JST (Japan Science and Technology Corporation).
References Altes, R. A. (1978). “The Fourier-Mellin transform and mammalian hearing,” J. Acoust. Soc. Am., 63,pp.174-183. Cohen, L. (1993).”The scale transform,” IEEE Trans. Acoust. Speech and Signal Processing.41,pp.3275-3292. Combes, J.M., Grossmann, A. and Tchamitchian, Ph. Eds. (1989) ”Wavelets,” Springer-Verlag, Berlin. Fant, G. (1970)."Acoustic Theory of Speech Production," Mouton, Paris. Glasberg, B.R. and Moore, B.C.J. (1990). "Derivation of auditory filter shapes from notched-noise data," Hear. Res., 47, pp. 103-138. Irino, T. and Patterson, R.D. (1996). "Temporal asymmetry in the auditory system," J. Acoust. Soc. Am. 99, pp.2316-2331. Irino, T. and Patterson, R.D. (1997). "A time-domain. level-dependent auditory filter: the gammachirp," J. Acoust. Soc. Am. 101, pp. 412-419. Irino, T. and Patterson, R.D. (1999a). "A mathematical framework for auditory processing: A Mellin transform of a stabilised wavelet transform," ATR Technical Report, TR-H-264, Jan., 1999. Irino, T. and Patterson, R.D. (1999b), "Calculation of the Mellin transform in the auditory pathway? " Trans. Tech. Comm. Psycho. Physio. Acoust., Acoust. Soc. Jpn., H-99-5, Tokyo, Japan. Kawahara, H. (1997)," Speech representation and transformation using adaptive interpolation of weighted spectrum: Vocoder revisited," IEEE Int. Conf. Acoust., Speech Signal Processing (ICASSP-97), 1303-1306, Müchen. Patterson, R.D.,(1987). "A pulse ribbon model of monaural phase perception," J. Acoust. Soc. Am., 82, pp. 1560-1586. Patterson, R.D.,(1994a). "The sound of a sinusoid: Spectral models," J. Acoust. Soc. Am., 96, pp. 1409-1418. Patterson, R.D.,(1994b). The sound of a sinusoid: Time-interval models," J. Acoust. Soc. Am., 96, pp. 1419-1428. Patterson, R.D., Allerhand, M., and Giguére, C., (1995). "Time-domain modeling of peripheral auditory processing: A modular architecture and a software platform," J. Acoust. Soc. Am., 98, pp. 1890-1894. Patterson, R.D. and Irino, T. (1998). "Modeling temporal asymmetry in the auditory system," J. Acoust. Soc. Am. 104, pp. 2967-2979. Umesh, S., Cohen, L., and Nelson, D. (1997).”Frequency-warping and speaker-normalization,” IEEE ICASSP-97, pp. 983-986. Umesh, S., Cohen, L., and Nelson, D. (1998). ”Improved scale-cepstral analysis in speech,” IEEE ICASSP-98, pp. 637-640. Titchmarsh, E. C. (1948).”Introduction to the Theory of Fourier Integrals, ”Oxford University Press, London. Yang, C-S and Kasuya, H. (1995)."Dimension differences in the vocal tract shapes measured from MR images across boy, female and male subjects," J. Acoust. Soc. Jpn (E), 16, pp. 41-44.
The main portion of this study was performed while the second author was an invited researcher at ATR-HIP, between October and December 1998. The authors wish to thank Hideki Kawahara of Wakayama University for arranging this opportunity. This work is partially supported by CREST (Core Research for Evolutional
-8CASA workshop, IJCAI-99 Stockholm, 1 August, 1999