Extraction of Memory Colors Using Bayesian Networks Mustafa Jaber Chester F. Carlson Center for Imaging Science, Rochester Institute of Technology, Rochester, NY
[email protected]
Abstract - In this work, a region classification algorithm based on low-level features and probabilistic framework is proposed where skin, sky, and vegetation memory color classes are detected in digital images. A region’s low-level features are extracted using a segmentation map of input image. Bayesian Network (BN) is used to classify memory color regions for smart rendering in printing applications. Other applications of the proposed technique include image annotation, indexing, and content retrieval. The algorithm was tested on a large database of color images with 85% classification accuracy. Keywords: image understanding, region classification, Bayesian Networks, memory color.
1
Introduction
The goal of our research is to develop image understanding algorithms for classifying image regions according to their semantic characteristics. The proposed algorithm uses low-level features of image segments. Geometric features (shape, area, and position), in addition to color and texture, will be used in a Bayesian Network (BN). Skin, sky, and vegetation memory colors are of interest in this work; however, the algorithm could be extended to include more semantic classes. Memory colors are colors of natural objects that are presented in a context. Their appearance and perception are affected by the human memory and experience. They are not measured with colorimeter or spectrographically mapped; however, they are processed by the human visual system and stored as memories [1]. Examples of memory colors include the colors of grass and sky which are not the colors green and blue. Studies in literature focus on image and scene classifications using low-level and semantic image features; however, there are a limited number of studies that discuss region classification techniques. Usually the overall objective of image understanding algorithms in digital images is to classify, annotate, or retrieve images with certain characteristics. One way to model these systems is by developing methodologies based on the global content of the input image. This can be seen clearly in scene classification algorithms. Another way is to extract the local low-level and semantic features of image regions and use them for scene classification. Extracting information about image regions may require using image segmentation algorithms at the preprocessing stage.
978-1-4244-2173-2/08/$25.00 ©2008 IEEE
Eli Saber, Ferat Sahin Department of Electrical Engineering, Rochester Institute of Technology, Rochester, NY
[email protected],
[email protected]
Algorithms to query image databases use low-level features of image regions as input of similarity functions [2]. However, they do not extract any semantic characteristics. On the other hand, extracting semantic features of image regions would result in more accurate classification for certain databases and classification tasks [3]. The concept of eigenregions that describes the geometrical properties of an image region is presented in [3] where Principal Component Analysis (PCA) is performed on pre-segmented images. Another system that uses Markov Fields to improve region classification is proposed in [4]. It demonstrated good classification rates for objects from several classes. The algorithm is pixel based, and thus it does not give sharp edges for object boundaries. The potential use of the local dominant orientation features for scene classification is discussed in [5]. It shows that highlevel interpretation of real-world scenes may directly be available from low-level spatial orientation statistics. Some studies such as in [6] and [7] develop image understanding algorithms, assuming a scene from a specific environment is shown in the image. In this case, an outdoor scene is assumed. It is easier to model the understanding of human knowledge about image structure and content for outdoor scenes than indoor scenes. This knowledge could be about the scene type and could be used to overcome some limitations. For example, this enabled combining image segmentation and region classification algorithms into one system [6] which resulted in more accurate classifiers with less computational complexity for outdoor scenes. However, it is difficult to extend these algorithms to indoor scenes due to the complexity of their content in general. Another study that utilized semantic object detectors and region-based sceneconfiguration models for outdoor scenes is presented in [7], where an enhanced scene classifier is proposed. In this work, we investigate image understanding algorithms in the context of printing applications. The memory color extraction algorithm could be utilized for smart rendering in the printing industry where different color tables could be used to map skin, sky, or vegetation regions. Preferred color correction of memory color regions would improve the visual quality of the printed document and its subjective image quality. A recent technique for memory color extraction is proposed in [8], where thresholds that define colors of interest are found empirically in CIELAB color space. Similar to the methodology in [8], our proposed algorithm could be used to improve the quality of viewing of High-definition Television (HDTV) where regions of memory colors are segmented and annotated at the sender side. These regions could be enhanced to generate pleasing views on digital TVs at the receiver end.
The memory color extraction and enhancement techniques which are utilized on the transmission and reception systems would make up a System of Systems (SoS). In this paper, a region classification algorithm in a Bayesian framework is proposed. The algorithm uses a segmentation map [9] in addition to the color input image and outcomes in a belief map for image segments. Probabilistic classifiers have shown promising results in scene classification [10] [11] [12] where semantic objects such as sky, mountain, beach, and vegetation are discussed. These classes are mainly used to classify indoor vs. outdoor scenes. However, belief networks have been criticized for the normality assumption, which is hard to generalize. Skin detection algorithms using BN are presented in [13], [14] where information at pixel level is employed. These techniques try to characterize the relation between neighboring skin pixels.
texture modeling in split and merge frameworks. A dynamic threshold operator is applied to the gradient map to provide the initial segmentation map where pixels are classified as follows: 1) pixels without edges are clustered and labeled individually to identify the preliminary image content, and 2) pixels that contain higher gradients are further classified by utilizing an iterative dynamic threshold generation technique and an appropriate entropy-based texture model. A multimodal-merging approach is utilized to produce the final segmentation which recognizes objects displaying occlusion and complex patterns. It is an improved and semantically meaningful segmentation map.
The remainder of this paper is organized as follows: Section 2 describes the proposed algorithm. Section 3 presents some results and discussions. Conclusions are drawn in Section 4.
2
Proposed Algorithm
The objective of the proposed algorithm is to identify and classify regions of memory color, namely, skin, sky, and vegetation in digital images. A probabilistic framework is proposed where a set of images are used to discover the structure and compute the conditional probabilities in a Bayesian Network. We discuss feature extraction, the training phase, and the proposed classifier. The use of BN for region classification is also presented. The proposed algorithm is a combination of content-driven (bottom-up) technique that is represented in the segmentation algorithm [9] and contextdriven (top-down) methodology of region classification.
2.1 Feature extraction A set of 450 images of indoor and outdoor scenes were used for training the BN. The color image segmentation algorithm found in [9] is utilized to segment images in the database and is described in the following paragraph. Segments corresponding to classes of memory color (skin, sky, and vegetation) are manually annotated to build the ground truth maps. Skin class includes African, Asian, and Caucasian skin tones. Blue, gray (cloudy), and sunset sky regions are covered in the training image set. Similarly, vegetation includes trees and green and yellow (golden) grass. The image set includes hundreds of segments of memory color; however, 180 segments from each class were randomly selected and used in the training phase. This is to ensure that all classes have same apriori probability. Low-level features were extracted from the annotated regions and used to train the BN (see Table 1). A block diagram of the training process is illustrated in Fig. 1. The segmentation methodology in [9] is an unsupervised technique that uses color gradients, dynamic thresholds, and
Figure 1. Block diagram of the training phase. Table I. Features extracted from image regions. # 1-3 4-6 7-9 10-12 13 & 14 15 16 17 & 18 19 & 20 21
Feature Average Region’s Color [R, G, B] Standard Deviation of Region’s Color Average Region’s Color [Y, Cb, Cr] Standard Deviation of Region’s Color Mean & Standard Deviation of Color Gradient Entropy of Y Channel Energy of Y Channel Center of Segment (Xo, Yo) from Image Center Equivalent Ellipse (Major & Minor Axes) Normalized Area
The feature vector shown in Table 1 is used to train the BN and classify different image regions as well. Each region’s color is modeled by its average and standard deviation in RGB and YCbCr color spaces. We found that combining more than one color space improves the accurate classification rates. In YCbCr, Y is the luminance component and Cb and Cr are the blue-difference and red-difference chrominance components. The gradient across RGB color channels is used to capture texture variation. Each region’s entropy and energy are computed using the luminance (Y) channel to help capture more texture characteristics. The energy is defined as average of squared values of Y. Features 13 to 16 in Table 1 represent a simplistic model for texture; however, it is good enough for classifying classes of interest. An enhanced texture model would increase the computational complexity of the algorithm. Each region’s location relative to the image center is included. We assumed that skin regions are relatively closer to the image center than sky and grass regions. Each region’s shape is modeled by finding the major and minor axes of equivalent ellipse. Region’s area is also included in the feature vector where it is normalized by the image size.
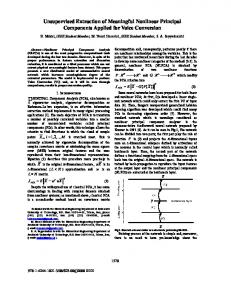
2.2 Region classification algorithm Region classification is based on different features that are extracted from the target image. Features in use are a continuous type, and thus a preprocessing step is required to convert them to discrete vectors. We found that quantizing the continuous features to five discrete regions provides the best classification rates. Equal frequency separation is used to find the boundaries of regions R1, R2, and R3 as shown in Fig. 2. Regions R0 and R4 restrict the minimum and maximum values that any feature can take.
prior probability of class membership is denoted as P(Ci), i = {1,2,3,4} where the index i corresponds to skin, sky, vegetation, and “other” classes, respectively. The features produced from the discretization step are represented as a feature vector F and used in the inference. P(F) is the evidence factor. The inferences of the BN are based on the posterior probability function P(Ci|F) , which is obtained by combining the class-conditional observation models with the class prior probability according to Bayes law: P (Ci | F ) =
1200
1000
R0
R2
R1
R3
Ci = arg max P (Ci | F ), i = 1, 2,3, 4
200
60
80
100
120
(1)
The BN is used to find the posteriori probability for any segment in the input image. Maximum a posteriori (MAP), one of the most commonly used criteria in Bayesian classification problems, given by (2) is used.
400
0 40
P(F )
R4
800
600
P ( F | Ci ) P ( Ci )
140
160
180
(2)
200
Figure 2. Equal-frequency discretization. The discrete feature vectors from the training dataset are used to discover the optimum BN structure using the algorithm in [15]. It presents a framework for computing the probabilities of network-given feature database. The prior space of the network structure is assumed to be uniform. Conditional Probability Tables (CPT) for the BN are computed using the training features as well, where the maximum likelihood is employed. The Bayes Net Toolbox [16] is utilized in implementing the proposed algorithm. The classifier gives a probability for each segment of the input image of being skin, sky, vegetation, or another region. The “other” class includes any region that is not of interest in this work. The block diagram of the proposed algorithm is shown in Fig. 3 where the input is assumed to be a RGB color image. Color conversion from RGB to YCbCr color domains is used. The segmentation algorithm in [9] is utilized to group pixels of homogenous characteristics such as color and texture. The thresholds found in the training phase (see Fig. 2) are used to quantize the features. Finding the probability that a region belongs to a skin, sky, or grass class is found using the BN classifier. The output of the proposed algorithm is a region classification map that shows the posterior probabilities. Furthermore, to avoid memory color regions with low probability values in the output map, we used the receiver operating characteristic (ROC) curve analysis on a set of 50 images to set a threshold value (Ta) for accepted probabilities. Regions with probabilities less than Ta are assigned to the “others” class. More discussion on this can be found in the results section. The mathematical formulation of the proposed algorithm is summarized as follows: Let P denote the probability, and the
However, before using the MAP function, the posteriori probabilities P(Ci|F) are compared to the threshold Ta, ∀i = 1,2,3,4, P(Ci | F ) ≥ Ta .
Figure 3. Region classification algorithm.
3
Results and Discussions
The proposed algorithm was tested on a set of 50 images. The dataset contains a variety of portrait- and landscape-type color images with regions of skin, sky, and vegetation. Test dataset images were segmented; memory color regions were manually annotated to build the ground truth maps. ROC curve analysis has been applied on the test image set to find the possibly optimal Ta where the true positive rate (TPR on y-axis) is plotted vs. the false positive rate (FPR on x-axis). Each point on the ROC plot corresponds to a particular decision threshold Ta. A test with perfect discrimination has a ROC plot that passes through the upper-left corner (100% TPR, 0% FPR). Therefore, the closer the ROC plot is to the upper-left corner, the higher the overall accuracy of the test. Several threshold values (Ta = 0.02, 0.04 … 0.98) were used in Fig. 4, which shows the ROC curve for the test dataset. Ta = 0.54 is found to give the optimal result (closest point to the
upper-left corner) where the average TPR is 81.17%, and the average FPR is 10.91% for all classes. 1
Selected images acquired from the University of California at Berkeley [17] are used to demonstrate the visual accuracy of classifiers as shown in Fig. 5 and 6. The region classifier uses the RGB color image and its segmented map as inputs and results in a region classification map. Each region’s color in the segmentation map is pseudorandom (see Fig. 5 and 6), while each region’s color in the classification map signifies different classes. The color red is chosen to represent skin tone, blue regions are sky, and green regions are vegetation. The color black is used to signify regions not of interest in this work; we called it the “other” class in Section 2.2.
0.9
true positive rate
0.8 0.7 0.6 0.5 0.4 0.3 0.2 0
0.05
0.1
0.15
false positive rate
0.2
0.25
Figure 4. Receiver operating characteristic curve. Fig. 4 shows that the maximum accurate classification rate that the proposed classifier could achieve is 85.17% on the test database at Ta = 0.48. Table 2 shows the values of the TPR and FPR for the individual classes at Ta = 0.48 & 0.54. Note that the small increase in the cutoff threshold value mainly minimized the FPR values for all classes with minor affect on the TPR values. TPR and FPR are found by comparing the classification map to the ground truth map for all images in the dataset as follows:
TPR =
K k tp k , K tp + K fn k k k k
FPR =
K k fp k K K k fp k + k tn k
where tp, fp, and tn stand for true positive, false positive and true negative, respectively. The sum runs over all images in the dataset. k = 1, 2…K where K = 50.
(3)
Classification results of outdoor scenes in Fig. 5a and 5b correlate well with the human observer where the sky and vegetation are accurately detected. The woman’s face in Fig. 5c is misclassified; however, the overall result of the algorithm is satisfactory because the sky and grass regions are accurately detected and cover a relatively large part of the scene. Fig. 5d has false alarm regions where the buildings are classified as vegetation. Classification results in Fig. 6a and 6b show skin tone detection that correlates well with the human observer. However, this is not the case in Fig. 6c where more regions (hat and shirt) are miscategorized as skin. Fig. 6d shows accurate skin tone detection, sky, and vegetation classification. Note that some water regions in Fig. 6d are sorted as vegetation and sky. Moreover, the sky region is accurately detected, although it is cloudy and shown as gray color in the input image (Fig. 6d). Accurate classification is achieved for skin tones such as African, Asian, and Caucasian as shown in Fig. 6.
Input Image
Segmentation Map
Region Classification Map (a)
(b)
(c)
(d)
Figure 5. Classification results (landscape image set). Colors in segmentation maps are pseudorandom, while colors in classification map represent vegetation (green), sky (blue), and unknown (black).
over a set of 50 images of size 1024 x 768 pixels. Both algorithms are implemented using MATLAB 7.6® running on a 3.2 GHz dual core processor machine. Moreover, the proposed algorithm shows improved performance for extracting blue, cloudy, and sunset sky regions, grass and tree areas, and various skin tones from digital images. The performance of the classification algorithm is illustrated in Fig. 5 and 6 and Table 2.
(a)
Table II. TPR and FPR for test image set. (b)
Skin Sky Veg. Average
4 (c)
Ta = 0.48 FPR (%) TPR (%) 9.89 74.63 12.12 88.89 38.21 92.00 20.08 85.17
Ta = 0.54 FPR (%) TPR (%) 9.75 74.62 7.80 88.88 15.18 80.00 10.91 81.17
Conclusions
In this paper, an image understanding algorithm for classifying image regions into different classes is proposed. The focus in this paper is to extract memory color regions from digital images. The main application of the proposed algorithm is smart rendering in the printing industry, where different color tables could be used to map skin, sky, or vegetation regions. Inputs of the algorithm are its target color image and its segmentation map, while its outcome is shown as a belief map for image segments.
(d)
Input Image
Segmentation Map
Region Classification Map
Figure 6. Classification results (portrait image set). Colors in segmentation maps are pseudorandom, while colors in classification map represent vegetation (green), sky (blue), skin (red), and unknown (black). Considering the overall performance of the proposed classifier (Table 2 and Fig. 5 and 6), results are visually acceptable except for some false alarm regions especially in the vegetation class. Further analysis of the proposed algorithm would need evaluation of the segmented map of input images. The performance of the proposed algorithm is affected by the segmentation technique in use. An accurate segmentation map is assumed to be available for every input image. Thus, poor segmentation would degrade the performance of the classifier. However, developing enhanced segmentation algorithms for color images is an active area of research. On the other hand, the strengths of the algorithm are summarized by its computational complexity and accuracy. To this effect, the computation time of the segmentation algorithm [9] is less than a minute on average, and it is less than 0.3 second for the memory color extraction technique. These times are averaged
Different features such as color, texture, shape, relative location, and area were extracted from the input image and used for classification. A simplistic texture model has been used in this work because the classes of interest could be easily distinguished using color information. However, enhanced texture model will be necessary in case other memory color classes (water or beach) are considered. This will be studied in our future work. The algorithm has been tested on a set of 50 images with promising performance.
Acknowledgment The authors wish to thank Prudhvi Gurram, Grigorios Tsagkatakis, Sreenath Rao Vantaram, Abdul Haleem Syed, and Siddharth Khullar for their helpful comments.
References [1] Stephen Herron, “Memory-color test forms in real-world applications,” Proc. SPIE, Vol. 5294, 2003. [2] O. Kaick and G. Mori, “Automatic Classification of Outdoor Images by Region Matching,” Canadian Conference on Computer and Robot Vision, 2006. [3] C. Fredembach, M. Schroder, and S. Susstrunk, “Eigenregions for Image Classification,” IEEE Transactions
on Pattern Analysis and Machine Intelligence, Vol. 26, No. 12, 2004. [4] J. Verbeek and B. Triggs, “Region Classification with Markov Field Aspect Models,” IEEE Conference on Computer Vision and Pattern Recognition, 2007. [5] A. Guerin-Dugue and A. Oliva, “Classification of scene photographs from local orientations features,” Pattern Recognition Let., Vol. 21, pp. 1135-1140, 2000. [6] T. Pappas, J. Chen, D. Depalov, “Perceptually Based Techniques for Image Segmentation and Semantic Classification,” Advances in Visual Content Analysis and Adaptation for Multimedia Communications, IEEE Communications Magazine, January 2007.
[10] A. Vailaya, M. Figueiredo, A. Jain, and H. Zhang, “Image Classification for Content-Based Indexing,” IEEE Transactions on Image Processing, Vol. 10, No. 1, 2001. [11] S. Kumar, A. Loui, and M. Hebert, “An observationconstrained generative approach for probabilistic classification of image regions,” Image and Vision Computing, Vol. 21, pp. 87–97, 2003. [12] N. Serrano, A. Savakis, and J. Luo, “Improved scene classification using efficient low-level features and semantic cues,” Pattern Recognition, Vol. 37, 2004. [13] N. Sebe, I. Cohen, T. Huang, and T. Gevers, “Skin Detection: A Bayesian Network Approach,” International Conference on Pattern Recognition (ICPR’04), 2004.
[7] M. Boutell, J. Luo, and C. Brown, “Scene Parsing Using Region-Based Generative Models,” IEEE Transactions on Multimedia, Vol. 9, No. 1, 2007.
[14] D. Chai and A. Bouzerdoum, "A Bayesian approach to skin color classification in YCbCr color space," IEEE Region Ten Conference, Vol. II, pp. 421-424, 2000.
[8] B. Ryu, J. Yeom, C. Kim, J. Ahn, D. Kang, and H. Shin, “Extraction of Memory Colors for Preferred Color Correction in Digital TVs,” Proc. of SPIE-IS&T Electronic Imaging, 2009.
[15] G. Cooper and E. Herskovits, “A Bayesian method for the induction of probabilistic networks from data," Machine Learning Journal, Vol. 9, pp. 308-347, 1992.
[9] L. Garcia, E. Saber, V. Amuso, M. Shaw and R. Bhaskar, “Automatic color image segmentation by dynamic region growth and multimodal merging of color and texture information,” ICASSP, Las Vegas, 2008.
[16] http://www.cs.ubc.ca/~murphyk/Software/BNT/bnt.html [17] D. Martin, C. Fowlkes, D. Tal, and J. Malik, “A database of human segmented natural images and its application to evaluating segmentation algorithms and measuring ecological statistics,” IEEE International Conference on Computer Vision, PP. 416-425, 2001.