Half faces of Bill Clinton and George W. Bush. Matching corresponding regions is ..... [18] P. Sinha, B. Balas, Y. Ostrovsky, and R. Russell. Face Recog- nition by ...
Face Recognition Based on Non-Corresponding Region Matching Annan Li1 , Shiguang Shan1 , Xilin Chen1 and Wen Gao2,1 1
Key Lab of Intelligent Information Processing of CAS, Institute of Computing Technology, CAS, Beijing 100190,China 2 Institute of Digital Media, Peking University, Beijing,100871,China {anli,sgshan,xlchen,wgao}@jdl.ac.cn
Abstract
posed by Belhumeur et al.[2] are the most important in the literature. Besides them and their variants, many other statistical models are also successfully applied in face recognition. For example, recently Wright et al.[26] applied sparse representation to face recognition. Besides the statistical learning methods, visual feature descriptors are also very successful in improving the performance of face recognition. Gabor wavelet[24] and the histogram sequences of local binary patterns [1] are very effective to represent face appearance. In the methods described above, similarity between faces is measured by comparing vectors or histograms. No matter comparing vectors or histograms, they are all based on one criterion: Matching Corresponding Regions on face. That is to say, similarity is measured by comparing eyes with eyes and nose with nose etc.. Although some approaches of face recognition applied elastic matching [29, 25, 8], the range of elastic is limited to local neighbor regions.
In previous works of face recognition, similarity between faces is measured by comparing corresponding face regions. That is to say, matching eyes with eyes and mouths with mouths etc.. In this paper, we propose that face can be also recognized by matching non-corresponding facial regions. In another word face can be recognized by matching eyes with mouths, for example. Specifically, the problem we study in this paper can be formulated as how to measure the possibility whether two non-corresponding face regions belong to the same face. We propose that the possibility can be measured via canonical correlation analysis. Experimental results show that it is feasible to recognize face via non-corresponding region matching. The proposed method provides an alternative and more flexible way to recognize faces.
1. Introduction Automatic face recognition is a hot research topic in computer vision and pattern recognition. In the past decades, many methods have been proposed to study this problem. Now the performance of automatic face recognition systems has been greatly improved. In some evaluation tests, computer based face recognition systems even outperform humans [15]. However, advance in recognition performance doesn’t mean that thorough understanding of human face is achieved. Many mysteries of human face remain unsolved. In this paper we study the relationship between different parts of face by matching non-corresponding face regions in a statistical way. Although seems incredible, in this paper we will show that it is a feasible way to recognize faces. Statistical learning based methods are proved successful in face recognition. Among these methods, the “eigenfaces” proposed by Turk and Pentland [23] and “fisherfaces” pro-
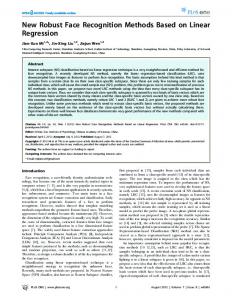
Figure 1. Half faces of Bill Clinton and George W. Bush.
Matching corresponding regions is effective, but it is not the only way to recognize faces. Psychology researches show that the relationship between different facial parts also plays an important role in the process of human face recognition. This phenomenon can be illustrated by the experiment of naming the famous people depicted in half faces[18, 28]. As shown in Figure 1, compared with recognizing single half faces (right image), it is much more difficult to recognize faces when two half faces are aligned 1
2011 IEEE International Conference on Computer Vision c 978-1-4577-1102-2/11/$26.00 2011 IEEE
1060
together (left image). The process of integrating different parts of face confuses the recognition. This phenomenon gives a proof by contradiction that the relationship between different parts of face is important to human in recognizing faces. Thus, it also implies that the relationship between different face region may have similar influence in computer based face recognition systems.
applied it for visual feature extraction. Similar to the approach in [13], we extract Gabor magnitude features of 5 scales and 8 orientations from the face images.
Figure 3. The patch division and process of feature extraction.
Figure 2. Corresponding (a) and non-corresponding (b) face region matching.
In this paper we study the relationship between different parts of face in computer-based face recognition systems. Specifically, the problem we focus on can be formulated as the following questions. Given two different facial parts, how to measure the possibility that they belong to the same face? And is this possibility useful in face recognition? In another word, as shown in Figure 2, what we study is not how to match eyes with eyes but how to match eyes with mouths, for example. In this paper, we propose that the possibility mentioned above can be measured via Canonical Correlation Analysis (CCA). We find it surprising that it is feasible to recognize face by Matching Non-corresponding Regions. Besides CCA, other methods, such as the approach proposed by Kumar et al.[10], also have capacity to perform non-corresponding region matching. To our knowledge, the work proposed in this paper is the first one explicitly studies non-corresponding region matching in face recognition. The remaining parts of this paper are organized as follows: Section 2 describes the method of matching noncorresponding regions; In Section 3, we illustrate the experimental results. And lastly, we draw the conclusions in Section 4.
2. Matching Non-Corresponding Face Regions via Canonical Correlation Analysis In this section, we first describe the feature extraction method utilized in the proposed approach. Then we describe the canonical correlation analysis and its application to matching non-corresponding face regions.
2.1. Face Feature Extraction and Corresponding Region Matching Low-level visual feature extraction is the first and very important step in face recognition. Since local Gabor feature is successful and widely used in face recognition, we
As shown in Figure 3, we divide face images into several non-overlapping regions for illustrating the relationship between different parts of face. Gabor features are sampled from each region. To enhance the representation power and reduce the dimension of feature vector principle component analysis(PCA)[23] is performed on each patch. After that we perform Fishers linear discriminant analysis (FLD)[2] for further enhancement. After visual and statistical feature extraction, a face can be represented as a set of feature vectors according to the patch division. Denote two faces and their corresponding patch vectors as x = {x1 , x2 , . . . , xm } and y = {y1 , y2 , . . . , ym }. Here m is the number of non-overlapping patches. For matching corresponding face regions, the similarity between two faces (x, y) can be simply computed by summing the similarities of each corresponding patch pair. Using correlation as the metric, the total similarity Stotal is given by m 1 ∑ ⟨xi , yi ⟩ Stotal = , (1) m i=1 ∥xi ∥ · ∥yi ∥ where the ⟨a, b⟩ denotes the dot product of a and b.
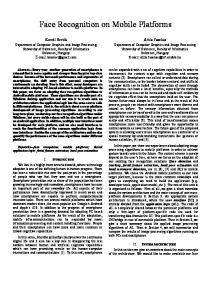
2.2. Matching Non-Corresponding Face Regions via Canonical Correlation Analysis In this paper we propose a novel method in which faces are recognized by matching non-corresponding regions. As shown in Figure 4 the method include two steps, i.e., the training step and the testing step respectively. First, we construct a series of coupled training sets, each for one pair of non-corresponding regions, by sampling one pair of patches on each face image. Then, CCA is performed on each training set for learning two sets of basis vectors. Each set of vectors correspond to one face region. In the testing phase, patch vectors are projected onto corresponding basis vectors. Similarity between two non-corresponding patches is measured by comparing their projections. In other words, the basis vectors obtained by CCA can transform vectors of two non-corresponding regions into a unified latent subspace. Non-corresponding region matching is performed in this latent subspace.
1061
In Figure 5, we give the correlation distributions of the same and different identity in the original feature space and the latent subspace obtained by CCA. As can be seen, the correlations between two non-corresponding regions are confused in the original feature space while in the latent subspaces the distributions are well-separated. Different Identity Same Identity
−0.4 −0.2 0 0.2 Correlation (a)
Figure 4. The process of non-corresponding region matching.
As can be seen, the key step in the proposed method is the canonical correlation analysis. Canonical correlation analysis is proposed by H. Hotelling in 1936 [7]. It is a classical technique in statistical learning [6]. CCA has been widely used in computer vision, and in recent years it also has been applied to face analysis. Sun and Chen [20, 21] modified the CCA model with soft label and local preserving projection. Ma et al. [14] improved the CCA model by maximizing the differences between the within class correlations and between class correlations. Their methods are all applied to image based face recognition. Kim et al. [9] also embedded discriminant analysis into the CCA model, but they applied their model to face video analysis. Zheng et al. [30] used kernel CCA for recognizing facial expression. Reiter et al. [17] and Lei et al. [11] used CCA to reconstruct 3D facial shape. Yang et al. [27] applied CCA to 2D-3D face matching. Different from all the method mentioned above, we apply CCA to non-corresponding face region matching in this paper. “Canonical correlation analysis can be seen as the problem of finding basis vectors for two sets of variables such that the correlation between the projections of the variables onto these basis vectors are mutually maximized.” [5]. The reason why we use CCA is that it can maximize the correlations between non-corresponding regions. And more important thing is that only the patches from the same face are coupled in the training set. That is to say, only the intrapersonal correlations are maximized. The correlation values given by CCA are positively correlated to the possibility that two patches belong to the same face. Therefore, it can be used as a metric for matching two non-corresponding face regions.
0.4
−0.4 −0.2 0 0.2 Correlation (b)
0.4
Figure 5. Distribution of correlation value between two noncorresponding face regions. In the original feature space (a), the correlation distribution of same and different identities are confused. In the latent subspace given by CCA (b) they are wellseparated.
Let (X1 , X2 ) be a set of patch pairs for two noncorresponding regions, where X1 = {x11 , x21 . . . , xn1 }, X2 = {x12 , x22 . . . , xn2 }. Here n is the number of faces. Both X1 and X2 are normalized to zero mean. The optimization goal of CCA is to find two sets of basis vectors, each for one region, such that the correlations between the projections of variables onto them are mutually maximized. Denote the basis vectors as W12 = {w112 , w212 , . . . , wk12 } and W21 = {w121 , w221 , . . . , wk21 }. Here k corresponds to the dimension of the latent subspace. For a pair of basis vectors (w12 , w21 ), the correlation ρ between the projecT T tions w12 X1 and w21 X2 is T
ρ= √
E[w12 X1 X2T w21 ]
.
(2)
E[w12 T X1 X1T w12 ]E[w21 T X2 X2T w21 ]
Here, E[f (x, y)] is the empirical expectation of function f (x, y). Considering the means of X1 and X2 are zero, the total covariance matrix of (X1 , X2 ) can be written as: [( ) ( ) ] ( ) T C11 C12 X1 X1 Ctotal = =E (3) C21 C22 X2 X2 where C11 and C22 are the within-patch covariance maT trices of X1 and X2 respectively and C12 = C21 is the within-individual covariance matrix between two noncorresponding regions. Therefore, the object function can be described as: T W12 C12 W21 W12 , W21 = arg max √ T TC W W12 ,W21 W12 C11 W12 W21 22 21 (4)
1062
The solution of W12 and W21 can be found by solving the following eigenvalue equations [3]: −1 −1 C11 C12 C22 C21 W12 = ρ2 W12 −1 −1 C22 C21 C11 C12 W21 = ρ2 W21 .
(5)
Only one of the equations needs to be solved, because the solutions are related by C12 W21 = ρλ12 C11 W12 C21 W12 = ρλ21 C22 W21 , √
where λ12 =
λ−1 21
=
TC W W21 22 21 . TC W W12 11 12
(6)
(7)
3. Experiments In order to validate the proposed method, we performe experiments on the FRGC version 2.0 data set under the protocol of Experiment 4. The FRGC provides 6 experimental protocols [16]. Among these experiments, Experiment 4 is considered the most challenging for still image based face recognition. In Experiment 4, face images are divided into three data sets, i.e., the training set, the target set and the query set respectively. The training set consists of 12,776 images of 222 individuals. In the target set, there are 16,028 face images taken under controlled illumination. And in the query set there are 8,014 images taken under uncontrolled illumination.
Assuming that each face is divided into m patches. Then there are total m(m − 1) non-corresponding patch pairs. For each pair we learn two sets of basis vectors (Wij , Wji ), where i ̸= j and i, j ∈ 1, . . . , m. Denote a pair of gallery and probe faces as x = {x1 , x2 , . . . , xm } and y = {y1 , y2 , . . . , ym } respectively. For a non-corresponding patch pair (xi , yj ), their projection onto corresponding basis vectors are: xˆi = WijT (xi − xmean ) i yˆj =
T (yj Wji
−
). xmean j
(8)
are the mean vector of i-th and jand xmean Here xmean j i th patch respectively. The similarity between xi and yj is measured by the correlation between the projections xˆi and ∗ yˆj . Consequently, the total similarity Stotal between face x and y can be computed by summing the similarity of all the non-corresponding patch pairs. ∑ ∑ xˆi · yˆj 1 m × (m − 1) i=1 j=1 ∥xˆi ∥∥yˆj ∥ m
∗ Stotal =
m
s.t. i ̸= j.
(9) In the recognition, we simply used the nearest neighbor classifier. A probe face is identified to the gallery face with ∗ highest Stotal value. Similar to the Fisher’s linear discriminant analysis, singularity problem also exists in CCA. The covariance matrix C11 and C22 in equation (4) may be not invertible. There are two methods to solve this problem. In the first, covariance matrix can be regularized by adding a small value to the diagonal elements. Denote the small value as α. By replacing C11 and C22 with the regularized covariance matrix C11 + αI and C22 + αI respectively in equation (4), the singularity problem could be avoid. The second method is to perform PCA before CCA, which is similar to the fisherfaces method[2]. In this paper, we perform PCA and FLD on the original Gabor features. Thus, the singularity problem is solved. However, we also perform CCA directly on the original Gabor features in the following experiments. In this case, the first method is used.
Figure 6. The patch division (a) and example face images taken under controlled illumination (b) and uncontrolled illumination (c) in the FRGC version 2.
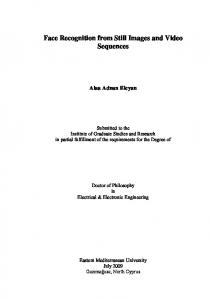
In the experiments original images are converted to gray scale. The face images is normalized to 128 × 160 according to the positions of eyes. Each image is divided into 20 non-overlapping patches for corresponding and noncorresponding region matching. Independent PCA and FLD models are trained on each patch using the images in the training set. Then patches are represented as low dimension feature vectors obtained by PCA and FLD. Figure 6 illustrates the patch division and some examples of normalized face images used in our experiments. In Experiment 4 face verification is performed by comparing 8,014 uncontrolled query images with 16,028 controlled target images. The performance is measured by three Receiving Operator Characteristic (ROC) curves generated by BEE system. ROC 1 is corresponding to the images collected within semesters, ROC 2 within a year, and ROC 3 between semesters. Algorithms are typically compared in terms of the verification rate at 0.1% false acceptance rate, which is considered the security requirement for real-world applications.
3.1. Experiment A: Face Verification Based on NonCorresponding Region Matching We first conducted experiments of face verification based on Non-Corresponding Region Matching (NCRM) under the protocol of FRGC experiment 4. For comparison, we also
1063
0.8
0.6 0.4
CRM NCRM
0.2 0
0.2 0.4 0.6 0.8 False Accept Rate ROC 1
0.6 0.4 0.2 0
1
Verification Rate
0.8
Verification Rate
0.8
0
0.2 0.4 0.6 0.8 False Accept Rate ROC 2
0.6 0.4 0.2 0
1
1
1
0.8
0.8
0.8
0.6 0.4 0.2 0
0
0.2 0.4 0.6 0.8 False Accept Rate ROC 1
0.6 0.4 0.2 0
1
Verification Rate
1 Verification Rate
0
0.2 0.4 0.6 0.8 False Accept Rate ROC 2
1
0.8
0.8
0.8
0.4 0.2 0
0
0.2 0.4 0.6 0.8 False Accept Rate
1
0.4 0.2 0
0
0.2 0.4 0.6 0.8 False Accept Rate
1
1
0
0.2 0.4 0.6 0.8 False Accept Rate ROC 3
1
0
0.2 0.4 0.6 0.8 False Accept Rate
1
0.2
1
0.6
0.2 0.4 0.6 0.8 False Accept Rate ROC 3
0.4
1
0.6
0
0.6
0
1
Verification Rate
Verification Rate
ROC 3 1
0
Verification Rate
ROC 2 1
Verification Rate
Verification Rate
ROC 1 1
0.6 0.4 0.2 0
Figure 7. Performance comparison between Corresponding Region Matching(CRM) and Non-Corresponding Region Matching(NCRM) based on original Gabor feature (top row), PCA feature (middle row) and FLD feature (bottom row).
give experimental results of Corresponding Region Matching (CRM). In the experiments each face is divided into 20 patches. Therefore, there are totally 400 patch pairs. Among them 20 pairs are corresponding to the same position on face. And the position of the rest 380 patch pairs are non-corresponding. For corresponding pairs, we compute the similarity between a target and a query face according to equation (1). For each non-corresponding pair we train a CCA model using the image in the training set. Then the similarity of NCRM is obtained according to equation (9) for comparing a target and a query face. Three kinds of features are used in the experiments, i.e., the original Gabor features, PCA features and FLD features. The detailed performance comparison between CRM and NCRM are shown in Figure 7 and Table 1. As can be seen, it is surprising that NCRM outperforms the CRM when original Gabor features and PCA features are used. However, the performances of both CRM and NCRM are very poor using Gabor and PCA features. When FLD feature is used, the performance is considerably improved. In this case, the CRM outperforms the NCRM.
Although the performance based on FLD feature is not as high as the corresponding region matching, noncorresponding region matching achieves 54% verification rate at 0.1% false acceptance rate (ROC 3). Recognizing faces by matching eyes with nose seems incredible. But the experimental results show that it is feasible to recognize face via non-corresponding region matching.
3.2. Experiment B: Face verification with different training sets According to the experiment protocol of FRGC, the CCA models are trained on the training set in Experiment A. The models can give a general possibility whether a pair of non-corresponding patches belongs to the same face. Under this condition, one point is overlooked. Giving a target face image, there is natural prior knowledge: the patches in this image belong to the same face. In Experiment A this information is ignored. To make use this prior knowledge we train the CCA models on the target set instead of the training set. Then the probability given by these models is not the general probability but the probability for the specific
1064
Table 1. Comparison of verification rates at FAR=0.1% on FRGC Experiment 4. Work ROC 1 ROC 2 ROC 3 C. Liu[12] 76% Tan and Triggs [22] 88.1% Su et al. [19] 89% Deng et al.[4] 93.91% 93.55% 93.12% CRM NCRM-target NCRM-training NCRM-half face
73.72% 67.16% 46.56% 43.06%
74.79% 70.74% 50.65% 45.93%
75.70% 73.85% 54.52% 49.27%
subjects in the target set. The PCA and FLD models used in this experiment are still trained on the training set. To some extent using the target set breaks the FRGC protocol, since in face verification information of other target faces is assumed unknown. However, it must be pointed that we do not use any information of identity label of the target set. More importantly, the purpose of this paper is not to compete with other methods under the protocol of FRGC. This experiment could help us to further explore the potentialities of non-corresponding region matching in face recognition. The experimental results based on FLD feature are illustrated in Figure 8 and Table 1 . We can see that the performance is greatly enhanced using the CCA models trained on the target set. The ROC curves of NCRM are much closer to that of CRM. The verification rate at 0.1% false acceptance rate (ROC 3) is improved to 73.85%. It is impressive that the performance of NCRM is comparable to the CRM. In Table 1 we also give the verification rates of some state-of-the-art methods on FRGC experiment 4. Although it is not proper to compare these methods under different experimental settings. It can give an empirical comparison. From the table we can see that the performance of NCRM is close to the results reported in [12], but lower than other state-of-the-art methods. It should be pointed that our method and the approach in [12] only use the Gabor feature, while methods in [19, 22, 4] integrating Gabor features with other kind of visual features. For example, Tan and Triggs enhance the performance by combining Gabor features with local binary patterns[22]. Therefore, the performance of the proposed method could be further enhanced by integrating Gabor features with other visual features.
3.3. Experiment C: “Half face verification” In previous experiments we show the effectiveness of non-corresponding region matching in face recognition. The best performance of non-corresponding region matching is not as good as that of the corresponding region matching. But non-corresponding region matching provides a alternative and more flexible way for recognizing faces. For example, corresponding region matching can not recognize
the incomplete faces in Figure 1. Since the two faces don’t have any overlapping region. But non-corresponding region matching can recognize them. To show the advantage of non-corresponding region matching we perform experiments of face verification based on “half faces”. As shown in Figure 9, in this experiment we only use the top-half of query face and the bottom-half target face. For a pair of target and query face, there is no overlapping region. Thus, it is impossible to perform corresponding region matching. But non-corresponding region matching can deal with this situation.
Figure 9. The examples of incomplete and non-overlapping faces in target (right) and query set (left).
Based on the patch division in Figure 6, a top-half of query face has 12 patches and a bottom-half target face has 8 patches. Thus, there is 96 non-corresponding patch pairs in total. They are a subset of the 380 pairs in the “full face” verification. In the experiment we use FLD features. The experiments are performed strictly under the under the protocol of FRGC experiment 4. In other words, the CCA models are obtained from the FRGC training set. The experimental results are illustrated in Figure 10 and Table 1. From the figure, we can see that performance is degraded compared with the “full face” verification. But the ROC curves of “half face” are still convex. At 0.1% false acceptance rate, “half face” achieves 49.27% verification rate. The performance of “half face” identification is not that good, but it is still effective. Considering the corresponding region matching can not work in this extreme case, these results clearly demonstrate the advantage of noncorresponding region matching. Besides that these results also suggest that the proposed method has the potentiality in recognizing degraded faces, such as faces with serious occlusion, expression changes etc..
4. Conclusions and Discussions In this paper we propose a novel face recognition approach based on non-corresponding region matching. The problem we study can be formulated as how to measure the possibility that whether two non-corresponding regions on the face image belong to the same face. In this paper we propose that canonical correlation analysis is an effective method to match non-corresponding regions on face. Compared with corresponding region matching, noncorresponding region matching, such as matching eye-
1065
ROC 2
ROC 3 1
0.9
0.9
0.9
0.8 0.7 0.6 0.5
Verification Rate
1 Verification Rate
Verification Rate
ROC 1 1
0.8 0.7 0.6 0.5
0.4 −3 10
−2
−1
10 10 False Accept Rate
0.4 −3 10
0
10
0.8 0.7 0.6
CRM NCRM−Target NCRM−Training
0.5 −2
−1
10 10 False Accept Rate
0
10
0.4 −3 10
−2
−1
10 10 False Accept Rate
0
10
Verification Rate
Figure 8. Performance comparison for different training sets.
the implication by exploring more texture primitives to further prove its feasibility for face recognition. The proposed method provides an alternative and more flexible way to recognize faces. It can even effectively recognize faces without overlapping regions. Thus, it has potentiality in recognizing degraded face images, such as images with serious occlusion. Besides that it also demonstrates a special property of human face that local regions of face are highly correlated. Canonical correlation analysis is not the only way to study this property. How to effectively represent and make use of this property in face analysis is still a problem worthy of further study.
1 0.9 0.8 0.7 0.6
Full face − ROC 1 Full face − ROC 2 Full face − ROC 3 Half face − ROC 1 Half face − ROC 2 Half face − ROC 3
0.5 0.4 0.3 0.2 0.1 0
0 0.1 0.2 0.3 0.4 0.5 0.6 0.7 0.8 0.9 1
False Accept Rate
Verification Rate
1
Acknowledgement
0.9
This paper is partially supported by Natural Science Foundation of China under contracts No. 60833013 and No.U0835005; National Basic Research Program of China (973Program) under contract 2009CB320902; and Beijing Natural Science Foundation (New Technologies and Methods in Intelligent Video Surveillance for Public Security) under contract No.4111003.
0.8 0.7 0.6 0.5 0.4 −3 10
−2
−1
10 10 False Accept Rate
0
10
Figure 10. Experimental results of ”half face” verification in linear (top) and log (bottom) coordinate.
s with mouth, seems incredible. However in this paper we show that it is feasible to recognize faces via noncorresponding region matching. Although the performance of non-corresponding region matching is not as good as that of corresponding region matching, it is effective enough for recognizing faces. The principle behind the proposed method might be the constancy of skin texture characteristics. In other words, the texture information is unrelated to the position and constant for different face regions. So, in the future, we will expand
References [1] T. Ahonen, A. Hadid, and M. Pietikainen. Face Description with Local Binary Patterns: Application to Face Recognition. IEEE Transactions on Pattern Analysis and Machine Intelligence, 28(12):2037–2041, 2006. 1 [2] P. N. Belhumeur, P. Hespanha, and D. J. Kriegman. Eigenfaces vs. fisherfaces: Recognition using class specific linear projection. IEEE Transactions on Pattern Analysis and Machine Intelligence, 19(7):711–720, 1997. 1, 2, 4 [3] M. Borga. Canonical correlation: a tutorial. On line tutorial http://people.imt.liu.se/magnus/cca, 2001. 4 [4] W. Deng, J. Hu, J. Guo, W. Cai, and D. Feng. Emulating biological strategies for uncontrolled face recognition. Pattern Recognition, 43(6):2210–2223, 2010. 6 [5] D. R. Hardoon, S. Szedmak, and J. Shawe-Taylor. Canonical correlation analysis: an overview with application to learn-
1066
[6] [7] [8]
[9]
[10]
[11]
[12]
[13]
[14]
[15]
[16]
[17]
[18]
[19]
[20]
ing methods. Neural Computation, 16(12):2639–2664, 2004. 3 T. Hastie, R. Tibshirani, and J. Friedman. The Elements of Statistical Learning. Springer, 2001. 3 H. Hotelling. Relations Between Two Sets of Variates*. Biometrika, 28(3-4):321–377, 1936. 3 G. Hua and A. Akbarzadeh. A Robust Elastic and Partial Matching Metric for Face Recognition. In Proceedings of the IEEE International Conference on Computer Vision, pages 2082–2089. IEEE, 2009. 1 T.-K. Kim, J. Kittler, and R. Cipolla. Discriminative learning and recognition of image set classes using canonical correlations. IEEE Transactions on Pattern Analysis and Machine Intelligence, 29(6):1005–1018, 2007. 3 B. Kumar, M. Savvides, and C. Xie. Correlation Pattern Recognition for Face Recognition. volume 94, pages 1963– 1976. IEEE, 2006. 2 Z. Lei, Q. Bai, R. He, and S. Z. Li. Face shape recovery from a single image using cca mapping between tensor spaces. In Proceedings of IEEE International Conference on Computer Vision and Pattern Recognition, June 2008. 3 C. Liu. Capitalize on Dimensionality Increasing Techniques for Improving Face Recognition Grand Challenge Performance. IEEE Transactions on Pattern Analysis and Machine Intelligence, pages 725–737, 2006. 6 C. Liu and H. Wechsler. Gabor feature based classification using the enhanced fisher linear discriminant model for face recognition. IEEE Transactions on Image Processing, 11(4):467–476, 2002. 2 Y. Ma, S. Lao, E. Takikawa, and M. Kawade. Discriminant analysis in correlation similarity measure space. In Proceedings of International Conference on Machine learning, pages 577–584. ACM New York, NY, USA, 2007. 3 A. O’Toole, P. Phillips, F. Jiang, J. Ayyad, N. Penard, and H. Abdi. Face recognition algorithms surpass humans matching faces over changes in illumination. IEEE Transactions on Pattern Analysis and Machine Intelligence, 29(9):1642–1646, 2007. 1 P. Phillips, P. Flynn, T. Scruggs, K. Bowyer, J. Chang, K. Hoffman, J. Marques, J. Min, and W. Worek. Overview of The Face Recognition Grand Challenge. In Proceedings of IEEE Conference on Computer Vision and Pattern Recognition, volume 1, pages 947–954. IEEE, 2005. 4 M. Reiter, R. Donner, G. Langs, and H. Bischof. 3D and Infrared Face Reconstruction from RGB Data Using Canonical Correlation Analysis. In Proceedings of International Conference on Pattern Recognition, volume 1, 2006. 3 P. Sinha, B. Balas, Y. Ostrovsky, and R. Russell. Face Recognition by Humans: Nineteen Results All Computer Vision Researchers Should Know About. Proceedings of the IEEE, 94(11):1948–1962, 2007. 1 Y. Su, S. Shan, X. Chen, and W. Gao. Hierarchical Ensemble of Global and Local Classifiers for Face Recognition. IEEE Transactions on Image Processing, 18(8):1885–1896, 2009. 6 T. Sun and S. Chen. Class label versus sample label-based CCA. Applied Mathematics and Computation, 185(1):272– 283, 2007. 3
[21] T. Sun and S. Chen. Locality preserving CCA with applications to data visualization and pose estimation. Image and Vision Computing, 25(5):531–543, 2007. 3 [22] X. Tan and B. Triggs. Enhanced Local Texture Feature Sets for Face Recognition Under Dif?cult Lighting Conditions. IEEE Transactions on Image Processing, 19(6):1635–1650, 2010. 6 [23] M. Turk and A. Pentland. Eigenfaces for recognition. Journal of Cognitive Neuroscience, 3(1):71–86, 1991. 1, 2 [24] L. Wiskott, J.-M. Fellous, N. Krger, and C. von der Malsburg. Face recognition by elastic bunch graph matching. IEEE Transactions on Pattern Analysis and Machine Intelligence, 19(7):775–779, 1997. 1 [25] J. Wright and G. Hua. Implicit elastic matching with random projections for pose-variant face recognition. In Proceedings of IEEE Conference on Computer Vision and Pattern Recognition, pages 1502–1509, June 2009. 1 [26] J. Wright, A. Yang, A. Ganesh, S. Sastry, and Y. Ma. Robust face recognition via sparse representation. IEEE Transactions on Pattern Analysis and Machine Intelligence, 31(2):210–227, 2009. 1 [27] W. Yang, D. Yi, Z. Lei, J. Sang, and S. Z. Li. 2D-3D face matching using CCA. In Proceedings of IEEE International Conference on Automatic Face and Gesture Recognition, Amsterdam, The Netherlands, 2008. 3 [28] A. Young, D. Hellawell, and D. Hay. Configurational Information in Face Perception. Perception, 16(6):747–759, 1987. 1 [29] S. Zhao and Y. Gao. Textural hausdorff distance for widerrange tolerance to pose variation and misalignment in 2d face recognition. In Proceedings of IEEE Conference on Computer Vision and Pattern Recognition, pages 1629–1634, June 2009. 1 [30] W. Zheng, X. Zhou, C. Zou, and L. Zhao. Facial expression recognition using kernel canonical correlation analysis (KCCA). IEEE Transactions on Neural Networks, 17(1):233– 238, 2006. 3
1067