displayed in tablets, smartphones and laptop screens. Besides ...... CO LUM N SH OWS TH E REL ATIV E ERROR RE DU CTI ON (RER) O BTAI NED. WI TH TH ...
c
2015 IEEE. Personal use of this material is permitted. Permission from IEEE must be obtained for all other uses, in any current or future media, including reprinting/republishing this material for advertising or promotional purposes, creating new collective works, for resale or redistribution to servers or lists, or reuse of any copyrighted component of this work in other works. Pre-print of article that will appear in T-IP, vol.24, no.12, pp.4726-4740, Dec. 2015. The published article is available on http://dx.doi.org/10.1109/TIP.2015.2466088
IEEE TRANSACTIONS ON IMAGE PROCESSING, VOL. XX, NO. XX, DECEMBER XXXX
1
Face Spoofing Detection Through Visual Codebooks of Spectral Temporal Cubes Allan Pinto, Helio Pedrini, William Robson Schwartz, and Anderson Rocha
Abstract—Despite important recent advances, the vulnerability of biometric systems to spoofing attacks is still an open problem. Spoof attacks occur when impostor users present synthetic biometric samples of a valid user to the biometric system seeking to deceive it. Considering the case of face biometrics, a spoofing attack consists in presenting a fake sample (e.g., photograph, digital video or even a 3D mask) to the acquisition sensor with the facial information of a valid user. In this paper, we introduce a low-cost and software-based method for detecting spoofing attempts in face recognition systems. Our hypothesis is that during acquisition there will be inevitable artifacts left behind in the recaptured biometric samples allowing us to create a discriminative signature of the video generated by the biometric sensor. To characterize these artifacts, we extract time-spectral feature descriptors from the video, which can be understood as a low-level feature descriptor that gathers temporal and spectral information across the biometric sample and use the visual codebook concept to find mid-level feature descriptors computed from the low-level ones. Such descriptors are more robust for detecting several kinds of attacks than low-level ones. Experimental results show the effectiveness of the proposed method for detecting different types of attacks in a variety of scenarios and datasets including photos, videos and 3D masks. Index Terms—Face spoofing attack detection, mobile device, face biometric system, spectral analysis, visual codebook, timespectral visual features.
I. I NTRODUCTION Nowadays, the protection of personal data has become a fundamental requirement of security. According to Tipton [1], information security is concerned with the development of methods and tools for protecting information and preserving the value it has for an individual or an organization. For an efficient and effective protection, the use of robust authentication mechanisms is paramount. Knowledge-based methods (e.g., password, secret question) and token-based methods (e.g., smart cards, token code) are probably the most used authentication mechanisms to date. However, both methods have a critical feature: at the time of authentication, the system does not verify who is requesting access, but rather what the users know or possess. This renders the system vulnerable, since that knowledge or an object can easily be lost, shared or manipulated. As an alternative, biometrics is an authentication mechanism considered more natural and reliable as it focuses on verifying who is the person requesting the access [2]. Biometrics provides methods for recognizing humans automatically based on behavior, physical or chemical traits, being fingerprint, face, iris, hand geometry, hand vein, voice and DNA, the most common traits used [2]. Although there are several traits that can be used to perform user authentication, researchers are constantly looking for biometric traits with low acquisition and storage costs, that
are less invasive, present a high degree of uniqueness and are stable. However, the static nature of a stable biometric trait suggests “the paradox of secure biometrics” [3]: “An authenticator must be stable and distinctive to be considered a good authenticator. But, stability leaves no option for compromise recovery, since users cannot change their biometric trait if stolen. Moreover, since a biometric clue is not secret, its information can be learned and copied.” Although a stable biometric trait is an ideal authenticator, in practice, its use would not work if it were learned or copied. Therefore, researchers have striven to develop methods that detect whether a biometric sample presented to the acquisition sensor is a replica of the original sample. In the literature, the action of presenting a synthetic biometric sample of some valid user to the acquisition sensor in order to authenticate itself as a legitimate user is known as spoofing attack. Among several forms of biometric, face recognition is of paramount importance with outstanding solutions presented thus far such as deformable models [4], texture-based representations [5], and shape-based representations [6]. Although effective in many cases, according to Maltoni et al. [7], face, signature and voice are the easiest biometric signals to be circumvented. For instance, spoofing attacks can be successfully accomplished in a face biometric system if an impostor obtains access by presenting to the acquisition sensor a photography, digital video or a 3D model of the target person [2]. Even with recent advances in biometrics, information forensics and security, the vulnerability of facial biometric systems against spoofing attacks is still an open problem. During the production of the synthetic biometric data, inevitably, there are noise information and telltales added to the biometric signal that can be captured and further processed to pinpoint attacks. In fact, in the manufacturing process of a synthetic sample, there are, at least, two re-quantization steps of the original biometric signal. In photo- and mask-based face spoofing attacks, the continuous signal is quantized during the digitization process. Then, this digital version is re-quantized due to the printing process with 2D and 3D printers and again digitized during the presentation of the synthetic data to the acquisition sensor. In video-based face spoofing attacks, the continuous signal is digitized and recaptured by the acquisition sensor during the attack. Recent works [8]–[10] show that noise and artifacts such as blurring effects, printing artifacts, banding effects, and Moir´e patterns are added to the synthetic biometric samples during their manufacture and recapture. In this paper, we propose a spatio-temporal algorithm that captures such effects along time
IEEE TRANSACTIONS ON IMAGE PROCESSING, VOL. XX, NO. XX, DECEMBER XXXX
Parameter Estimations for the Classification Model Classification (c.f., Sec. III-C)
Pooling Process
Coding Process Mid-Level Descriptor Extraction (c.f., Sec. III-B2 and Sec. III-B3)
Visual Codebook
Selection of the Time-Spectral Visual Words
Visual Codebook Generation (c.f., Sec. III-B1)
Training Set
Residual Noise Videos
Fourier Spectrum Videos
Time-Spectral Descriptors
Low-Level Descriptor Extraction (c.f., Sec. III-A)
Testing Video
Low-Level Descriptor Extraction
Mid-Level Descriptor Extraction
Classification Model
Prediction
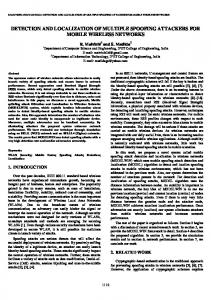
Fig. 1. Main steps of the proposed method. Given a training set consisting of valid access and attempted attack videos, and also a testing video, we first extract a noise signature from every training video, generating a residual noise video, and calculate its spectrum video. Then, we extract time-spectral descriptors from spectrum videos (low-level representation), which are used to generate a visual codebook. With the visual codebook at hand, we transform the low-level descriptors in time-spectral visual word descriptors (mid-level representation). Finally, these mid-level descriptors are used to find parameters of the classification model, which are employed to predict whether a given testing video is an attempted attack.
to provide an effective discriminative signature for valid access and spoofing attempts. In summary, the main contributions of this paper are: • a new method for extracting temporal and spectral information from face biometric samples, referred to as timespectral descriptors; • evaluation of the visual codebook model, also referred to as Bag-of-Visual-Word model, for creating a mid-level representation from time-spectral descriptors, referred to as time-spectral visual words; and • a low-cost solution for spoofing detection, illustrated in Figure 1, that does not rely on the user interaction or on extra hardware (e.g., infrared, motion or depth sensors) to detect different types of synthetic samples or attacks (e.g., photos, videos and masks) and is amenable to be implemented in computational devices such as PCs, handheld, and embedded systems. We organize the remaining of this paper as follows. Section II discusses state-of-the-art methods for face spoofing attack detection. Section III presents our method for spoofing attack detection. Section IV shows and discusses the experimental protocol and the obtained results. Finally, Section V concludes the paper and discusses possible future work. II. R ELATED W ORK The existing techniques for detecting spoofing on face recognition methods can be roughly categorized into four groups: user behavior modeling, user cooperation, methods
2
that require additional hardware and methods based on datadriven characterization. The first aims at modeling the user behavior with respect to the acquisition sensor (e.g., eye blinking or small head and face movements) to decide whether a captured biometric sample is synthetic. Methods based on user cooperation can be used to detect spoofing by means of challenge questions or by asking the user to perform specific movements, which adds extra time and removes the naturalness inherent to facial recognition systems. Techniques that require extra hardware (e.g., infrared cameras or motion and depth sensors) use the additional information generated by these sensors to detect possible clues of an attempted attack. Finally, methods based on data-driven characterization exploit only the data captured by the acquisition sensor looking for evidence and artifacts that may reveal an attempted attack. In [11]–[13], the authors proposed a solution for detecting photo-based attacks by eye blinking modeling under the assumption that an attempted attack with photographs differs from valid access by the absence of movements. Bao et al. [14] and Kollreider et al. [15] proposed a method based on the analysis of the characteristics of the optical flow field generated for living faces and photo-based attacks. As a living face is a 3D object and a photograph is a planar object, these methods analyze sequential images to detect facial movements, facial expressions or parts of the face such as mouth and eye. Pan et al. [16] extended upon [11] including contextual information of the scene (clues outside of the face) and eye blinking (clues inside the face region). Methods that use extra hardware have also been considered in the literature. Sun et al. [17] proposed a solution based on thermal IR spectrum modeling the face in the crossmodality of thermal IR and visible light spectrum by canonical correlation analysis. Recently, Erdogmus et al. [18] evaluated the behavior of a face biometric system protected with antispoofing solutions [8], [19] and the Microsoft’s Kinect under attempted attacks performed with static 3D masks. Although these approaches were successful, techniques requiring extra hardware devices have the disadvantage of not being possible to implement in computational devices that do not support them, such as smartphones and tablets. Turning our attention to the data-driven characterization methods, we can identify three different approaches explored in the literature: methods based on frequency analysis [9], [20], [21], texture analysis [8], [10], [22]–[26], and the ones based on motion and clues of the scene analysis [27]–[31]. We shall briefly review these approaches in the next sections. For further reading on the problem, we recommend Galbally et al.’s survey [32] and Marcel et al.’s handbook [33]. A. Frequency-based approaches Li et al. [20] explored the fact that faces in photographs are smaller than the real ones and that the expressions and poses of the faces in the photographs are invariant to devise a method for detecting photo-based attempted attacks. Pinto et al. [9] proposed a method for detecting attacks performed with videos using visual rhythm analysis. According to the authors, in a video-based spoofing attack, a noise signature is added to the biometric samples during the recapture of the
IEEE TRANSACTIONS ON IMAGE PROCESSING, VOL. XX, NO. XX, DECEMBER XXXX
videos of attacks. The authors isolated the noise signal using a low-pass filter and used the visual rhythm technique to capture the temporal information of the video. Lee et al. [21] proposed a method based on the frequency entropy of image sequences. The authors used a face verification algorithm to find the face region, normalized the RGB channels using z-score technique, and applied the independent components analysis (ICA) method to remove cross-channel noise caused by interference from the environment. Finally, the authors calculated the power spectrum and analyzed the entropy of the channels individually. Based on a threshold, the authors decide whether a biometric sample is synthetic or real. B. Texture-based approaches Tan et al. [10] proposed a solution for detecting attacks with printed photographs motivated by the difference of the surface roughness of an attempted attack and a real face. The authors estimate the luminance and reflectance of the image under analysis and classify them using Sparse Low Rank Bilinear Logistic Regression methods. Their work was further extended by Peixoto et al. [22] by incorporating measures for different illumination conditions. M¨aa¨ tt¨a et al. [8] explored micro textures for spoofing detection through the Local Binary Pattern (LBP). To find a holistic representation of the face, able to reveal an attempted attack, Schwartz et al. [23] proposed a method that extracts different information from images (e.g., color, texture and shape of the face). Results of both techniques were reported in the Competition on Counter Measures to 2D Facial Spoofing Attacks [34], with an HTER of 0.00% and 0.63%, respectively, upon the Print Attack Database [31]. Chingovska et al. [28] investigated the use of different variations of the LBP operator used in [8], such as LBPu2 3×3 , tLBP , dLBP and mLBP. The histograms generated from these descriptors were classified using χ2 histogram comparison, Linear Discriminant Analysis and Support Vector Machine. Face spoofing attacks performed with static masks have also been considered in the literature. Erdogmus et al. [35] explored a database with six types of attacks using facial information of four subjects. To detect attempted attacks, the authors used two algorithms based on Gabor wavelet [4], [36] with a Gaborphase based similarity measure [37]. Similarly to Tan et al. [10], Kose et al. [38] evaluated a solution based on reflectance to detect attacks performed with masks. To decompose the images into components of illumination and reflectance, the Variational Retinex [39] algorithm was applied. Pereira et al. [40] proposed a score-level fusion strategy for detecting various types of attacks. The authors trained classifiers using different databases and used the Q statistic to evaluate the dependency between classifiers. In a follow-up work, Pereira et al. [41] proposed an anti-spoofing solution based on the dynamic texture, a spatio-temporal version of the original LBP. Results showed that LBP-based dynamic texture description has a higher effectiveness than the original LBP, which reinforces the idea that temporal information is of prime importance to detect spoofing attacks.
3
C. Motion-based approaches Tronci et al. [27] explored the motion information and clues that are extracted from the scene by combining two types of processes, referred to as static and video-based analysis. The static analysis consists in combining different visual features such as color, edge, and Gabor textures, whereas the videobased analysis combines simple motion-related measures such as eye blink, mouth movement, and facial expression change. Anjos et al. [31] proposed a method for detecting photobased attacks assuming a stationary facial recognition system. According to the authors, the intensity of the relative motion between the face region and the background can be used as a clue to distinguish valid access of attempted attacks, since that motion variations between face and background regions exhibit greater correlation in the case of attempted attacks. In contrast with the methods described in this section, we present in this work a new anti-spoofing solution based on a temporal characterization of the frequency components from the noise signal extracted from videos. Furthermore, to the best of our knowledge, this was the first attempt of dealing with visual codebooks to find a mid-level representation useful for face spoofing attack detection. III. P ROPOSED M ETHOD In this section, we introduce a method for detecting different forms of face spoofing attacks. The method comprises three main steps: low-level descriptor extraction, mid-level descriptor extraction, and classification. Fig. 1 illustrates these steps, which we explain in details in the following sections. We designed the algorithm based on the fact that synthetic biometric samples contain noise and artifacts generated during their manufacture and recapture that are different from any pattern found in real biometric samples. According to Tan et al. [10] and M¨aa¨ tt¨a et al. [8], there is a deterioration of the facial information and, consequently, a loss of some high frequency components during the manufacture of photographs to be used in spoofing attacks. In our prior work [9], we highlighted the fact that there is a significant increase of the low frequency components due to the blurring effect added during the recapture process of the biometric sample displayed in tablets, smartphones and laptop screens. Besides the blurring effect, other artifacts are added such as flickering, Moir´e patterns, and banding effect [42]. These facts motivated us to propose a solution that takes advantage of the noise and artifacts contained on such fake biometric samples, which heretofore we refer to as a noise signature. We perform a Fourier analysis of the noise signature to capture the information encoded in the frequency, phase and amplitude of the component sinusoids [43]. In this paper, we use Fourier spectrum to quantify the following artifacts: • blurring artifact: In both the production and recapture processes, inevitably we have a decrease in the details of biometric samples due to re-quantization of the original signal. This reduction of details is reflected in the increase of low frequency components and can be observed in the Fourier domain; • flickering effect: It corresponds to the horizontal and vertical lines equally spaced that appear during the recapture
IEEE TRANSACTIONS ON IMAGE PROCESSING, VOL. XX, NO. XX, DECEMBER XXXX
process of the samples shown to the acquisition sensor with the display device. When this artifact appears in biometric samples, there are peak lines at abscissa and ordinate axes of the Fourier spectrum when the display device is aligned with the acquisition sensor; • Moir´ e pattern: They are irregular patterns that can appear when a display device is used to perform an attempted attack. As a result, we also have the appearance of peaks in different locations in the Fourier spectrum depending on the frequency and direction of the sinusoid in the spatial domain [43]. The novelty of our solution is in the two-tier low and mid-level characterization scheme, called time-spectral visual words, that captures patterns present in such noise signatures useful to reveal spoofing attacks. For this, we extract temporalspectral descriptors from the noise signature transformed to the frequency domain and create a mid-level representation for them using the concept of visual codebooks [44], [45]. Visual codebooks are a method for constructing mid-level representations widely employed in several applications in pattern recognition and computer vision, such as object recognition [46], gesture recognition [47], and information retrieval [48], among others. However, unlike existing methods, we obtain visual informative features from the noise signature present in the videos instead of their raw pixels or from objects in the scene. A. Low-Level Descriptor Extraction In our previous work [9], we found that the noise signal is an important source for low-level discriminative features for spoofing detection. When working with the noise signal and discarding the video content, we minimize possible negative impacts on the method performance. Next, we present the steps of the proposed method to compute the low-level descriptors. 1) Calculation of the Residual Noise Videos: The low-level representation of the videos is computed through the spectrum analysis of the noise signal in the frequency domain. To isolate the noise signal of a given video V , we filter a copy of V using a Gaussian filter with mean µ, std. σ, and kernel size k × k to remove the high frequency components, generating a filtered video. Then, we perform a subtraction operation between the input video and its filtered version, generating a new video, called Residual Noise Video (VRN ): (t)
VRN = V (t) − h(V (t) )
∀ t ∈ T = {1, 2, . . . , t},
(1)
where V (t) ∈ N2 is the t-th frame of V and h is a filter whose impulse response is a Gaussian function. 2) Calculation of the Fourier Spectrum Videos: After calculating the residual noise videos, we can analyze the noise pattern and possible artifacts contained in the biometric samples by applying the 2D Discrete Fourier Transform to each frame of the VRN using Eq. 3. In this work, we evaluate two important characteristics of the noise signal in the frequency domain, the magnitude and phase of the signal. The analysis of these two characteristics is performed by calculating the magnitude spectrum (Eq. 5) and phase spectrum (Eq. 6), with the origin at the center of the frame. In both cases, the result is a Fourier spectrum video.
4
F (VRN (x, y)) ≡ F (v, u) F (v, u) =
M −1 N −1 X X
(2) VRN (x, y)e−j2π[(vx/M )+(uy/N )]
(3)
x=0 y=0
|F (v, u)| =
q
R(v, u)2 + I(v, u)2
VMS (v, u) = log(1 + |F (v, u)|) � � I(v, u) VPS (v, u) = arctan R(v, u)
(4) (5) (6)
From the Fourier spectrum video, we can extract spectral and temporal information relevant to the spoofing attack detection. In the case of the spectral information, we need to capture peaks present in the central region caused by artifacts that reduce some details in the scene (e.g., skin marking, edge information) such as blurring effect, defocus, and printing artifacts and peaks present in the peripheral region of the frame caused mainly by artifacts such as the banding effect and Moir´e pattern, which appear during the recapture of the biometric information during an attack. Figs. 2 and 3 show an attempt to depict the temporal disturbances added to the biometric samples during attacks. In this example, we extract the first ten consecutive frames of an attack video and of a valid video for the same client, and calculate their respective magnitudes spectra from the residual noise video. In addition, Fig. 4 shows examples in which we have frames extracted from valid access videos (a) and spoof attack videos (b-c). In this figure, we aim at showing the Moir´e and blurring effects found in attempted attacks performed with a mobile device. The blurring effect is present in the magnitude spectrum with an increase of the low frequency components, whereas the Moir´e effect is present in the magnitude spectrum with peaks in the horizontal center region of the frames. It is hard to find a direct mapping of the effects to the phase spectra, but we can see clearly that there are disturbances in the phase spectra calculated from attempted attack frames when compared to phase spectra extracted from valid access frames. It is important to remark that we are not proposing a method for capturing each of the artifacts separately. We believe that the presence of one or more artifacts causes disturbances in the frequency components in the Fourier domain and the proposed method aims at describing and capturing this disturbance in space and time. 3) Computation of the time-spectral descriptor: Due to the dynamics involved in the appearance of artifacts and noise in the synthetic biometric samples and the spectral information, the temporal information becomes important to detect spoofing attacks. Therefore, we design a feature descriptor that gathers temporal and spectral information from an input video. We extract n temporal cubes of size of w × h × t (blocks of size w × h of t frames) from the Fourier spectrum video. The idea of temporal cubes has been somewhat explored to quantify temporal information in other tasks in computer vision [49]– [51]. In all cases, it always boils down to designing important discriminative features for capturing the event of interest. In this paper, we design new ideas for spoofing detection. The computation of the measure over temporal cubes can be performed on each frame separately, hereinafter referred to as
IEEE TRANSACTIONS ON IMAGE PROCESSING, VOL. XX, NO. XX, DECEMBER XXXX
5
(a) Original frames
(b) Residual noise frames
(c) Magnitude spectra Fig. 2. (a) Original frames extracted from a valid access video, (b) their respective residual noise frames and (c) magnitude spectra.
(a) Original frames
(b) Residual noise frames
(c) Magnitude spectra Fig. 3. (a) Original frames extracted from an attempted attack video, (b) their respective residual noise frames and (c) magnitude spectra.
(a) Examples of a frame extracted from valid access video
(b) Examples of frames extracted from a mobile-attack videos. We highlighted the Moir´e effect with yellow circle in the original image and its respective residual noise frame. The arrows on the magnitude spectrum indicate the effect of the Moir´e effect over Fourier spectrum
(c) Examples of frames extracted from a mobile-attack videos. In this frame, we show a blurring effect in the original image and its effect in the residual noise frame. The arrows on the magnitude spectrum show the impact of this effect over Fourier spectrum Fig. 4. Examples of valid access and attempted attack videos. The first column shows the original frame extracted from a video and the second column shows the residual noise frame calculated from the original frames. Finally, the third and fourth columns show the magnitude and phase spectrum, respectively. Note that the phase spectra calculated from valid access frames are different from attempted attack frames.
IEEE TRANSACTIONS ON IMAGE PROCESSING, VOL. XX, NO. XX, DECEMBER XXXX
spatial measures, or between consecutive frames, hereinafter referred to spatio-temporal measures. Examples of spatial measures that can be used are energy and entropy of the signal, which quantify the signal size and amount of information, respectively. As examples of spatial-temporal measures, we can mention correlation and mutual information, which are applied to measure dependence between consecutive frames. At the end of this process, we have a set of n time-spectral descriptors of t dimensions, for each video. As spatio-temporal measures are applied on consecutive frames, this process yield n time-spectral descriptors of (t − 1) dimensions each. B. Mid-Level Descriptor Extraction To find a robust representation for the low-level feature descriptors, with less sensitivity to the intra- and extraclass variations, we use the Bag-of-Visual-Word (BoVW) model [44], which maps the low-level features onto a more discriminative mid-level representation. Methods based on the BoVW model can be understood in the following steps: visual codebook generation, coding, and pooling. 1) Visual Codebook Generation: The generation of the visual codebook consists in the selection of time-spectral descriptors that are more frequent and representative considering all descriptors extracted from training videos. The selected descriptors, called time-spectral visual words, form the visual codebook. The selection can be performed using two strategies: (1) random selection, whereby all descriptors are pooled and m visual words are randomly chosen using a uniform distribution; or (2) selection via clustering (e.g., kmeans) whereby all descriptors undergo a clustering process and the m centroids found by the algorithm are used to form the visual codebook. In both cases, we end up with a single visual codebook, which is used to encode the low-level timespectral descriptors from videos. Instead of pooling all descriptors extracted from videos into a training set to build a single visual codebook, we can build class-based visual codebooks. When creating class-based visual codebooks, we consider the use of valid access and attempted attack video descriptors separately in order to find codebooks in each class. For each class-based codebook, we use the same procedures described above for a single visual codebook creation. The two visual codebooks are concatenated to create the final codebook. 2) Coding: The coding process performs a pointwise transformation of the low-level descriptors into another representation [52]. There are several strategies for coding being the hard and soft assignments the most common. Given a visual codebook and a low-level descriptor, the hard assignment transforms such descriptor into a binary vector with only one nonzero coefficient representing the visual word closest to it. The soft assignment [53], in turn, gives a real valued vector that represents the descriptor as a linear combination of the visual words of the codebook, whose coefficients give an associativity degree between the descriptor and the visual words of the codebook [54]. In this paper, we evaluate these two strategies for coding the low-level descriptors. 3) Pooling: The pooling process aims at summarizing the information contained in the set of n mid-level feature
6
descriptors extracted from an input video into only one feature descriptor to obtain its final representation. In the literature, we have two common techniques to do that, known as sumpooling (Eq. 7) and max-pooling (Eq. 8). In this paper, we evaluate these two strategies, as well. (j)
vi
=
n X
(j)
∀ j ∈ {1, 2, . . . , m}
(7)
(j)
∀ j ∈ {1, 2, . . . , m}
(8)
ui
i=1 (j)
vi
= maxi ui
C. Classification After finding a new space representation for the videos in the database, we use machine learning algorithms to find a classification model to decide whether a sample is an attempted attack or a valid access. In this paper, we evaluate the Partial Least Square (PLS) [55] and Support Vector Machine (SVM) [56] algorithms. IV. E XPERIMENTS AND R ESULTS In this section, we present and discuss the experimental results and the validation of the proposed method. Section IV-A shows details of the datasets used in the experiments while Section IV-B describes the experimental protocols employed in this work. Section IV-C shows the experimental setup of the proposed method regarding its parameters. The experiments in Section IV-D aim at validating our method and choosing its best parameter setup. In addition, Section IV-D addresses important questions regarding the low- and mid-level descriptor extraction procedures: (1) the best characteristic extracted from Fourier spectrum (e.g., magnitude or phase spectrum); (2) the best measure for spectrum summarization (e.g., energy, entropy, correlation, mutual information, etc); and (3) the visual codebook size most appropriate for the problem; among others. The remaining subsections compare the proposed method with the best methods reported in the literature including a challenging cross-dataset protocol, whereby we train our method using a dataset and test it with another dataset. A. Datasets In this work, we consider four datasets: • Replay-Attack Dataset [28]: This dataset comprises videos of valid accesses and attacks of 50 identities. The videos were generated with a webcam with a resolution of 320 × 240 pixels and 25 frames per second (fps). This dataset contains 200 valid access videos, 200 printbased attacks, 400 mobile-based attacks using an iPhone, and 400 high-definition attacks using an iPad screen with 1, 024 × 768 pixel resolution. • CASIA Face Anti-Spoofing Dataset [30]: This dataset contains videos of valid accesses and attacks of 50 identities and considers different types of attacks such as warped photo attacks and cut photo attacks, besides the photos and video attacks. It also considers attacks performed with different image/video quality: (1) lowquality videos captured by a long-time-used USB camera
IEEE TRANSACTIONS ON IMAGE PROCESSING, VOL. XX, NO. XX, DECEMBER XXXX
•
•
with 480×640 pixel resolution; (2) normal-quality videos captured with a new USB camera with 480 × 640 pixel resolution; and (3) high-quality videos captured with a Sony NEX-5 camera with 1, 920×1, 080 pixel resolution. In total, it comprises 150 valid access videos and 450 video spoofing attacks. UVAD Dataset [57], [58]1 : This dataset contains valid access and attempted attack videos of 404 different people, all created at Full HD quality, 30 fps, and nine seconds long. It contains 16, 268 attempted attack videos and 808 valid access videos. Seven different display devices were used to simulate the attempted attacks performed upon three acquisition sensors of different manufacturers: a 9.1 megapixel (MP) Sony CyberShot DSC-HX1, a 10.0MP Canon PowerShot SX1 IS, a 10.3-MP Nikon Coolpix P100, a 14.0-MP Kodak Z981, a 14.0-MP Olympus SP 800UZ, and a 12.1-MP Panasonic FZ35 digital camera. Figs. 5 and 6 illustrate some examples of this dataset. 3DMAD Dataset [18]: This dataset comprises valid access and mask attack videos of 17 different subjects, whose faces were recorded by a Microsoft Kinect sensor. To build a synthetic biometric sample, the authors used frontal and profile face images to make the facial reconstruction. Afterwards, the authors used a 3D printer to build a mask containing facial information of the target person. Spoofing attack simulations were performed by presenting the 3D masks to the same Microsoft Kinect sensor. In total, the authors generated 85 valid access videos and 85 attempted attack videos.
7
2) Protocol II: In this protocol, we use CASIA dataset, divided into two disjoint subsets: training and test sets. Due to the absence of a development set to estimate a threshold to be applied in the test set and afterwards to calculate the HTER, the official protocol of this dataset recommends to use the training set to build a classifier and then use the test set to report the EER value. To report the results in terms of HTER, the original training set was divided into two subsets, named as training and development sets, in the proportion of 80% and 20%, respectively. We use the new training set to find the classification model and the development set to estimate the threshold that gives us the EER, whereas the official test set is used to report the final results in terms of HTER. 3) Protocol III: In this protocol, we use the UVAD dataset, which contains six subsets comprising valid access and attempted attack videos. Each subset considers attacks against one acquisition sensor: Sony, Kodak, Olympus, Nikon, Canon and Panasonic. Here, we train a classifier using the sensors Sony, Kodak and Olympus, and we test it with videos (valid access and attempted attacks) from three other different manufacturers: Nikon, Canon and Panasonic. 4) Protocol IV: Here, we use the 3DMAD dataset to evaluate spoofing detection of attacks using 3D masks. The dataset contains 85 RGB videos that represent valid access and 85 RGB videos that represent attempted spoofing attacks. As this dataset does not contain explicit subsets, we randomly partitioned the data into three subsets: training, development and testing, and we use Protocol I for testing. C. Method Parameterization
B. Experimental Protocol We use two measures for performance evaluation: the area under the curve (AUC) and the half total error rate (HTER). While the former quantifies the overall ability of a classifier to discriminate between attempted attacks and valid accesses, the latter combines the false acceptance rate (FAR) and false rejection rate (FRR) in a specific operating point of the ROC curve into a single measure. HTER is commonly calculated in the operating point in which the FAR is equal to the FRR, known as the Equal Error Rate (EER). We use the freely available toolbox Bob [59] to calculate the AUC and HTER values. Finally, the employed evaluation protocols follow the ones proposed by the authors of the Replay-Attack, CASIA, UVAD and 3DMAD datasets. The source code of all proposed methods are freely available.2 1) Protocol I: In this experimental protocol, we use the Replay-Attack dataset, which is divided into three subsets: a training set with 300 attack videos and 60 valid videos; a development set with 300 attack videos and 60 valid access videos; and a test set with 400 attempted attack videos and 80 valid access videos. The training set is used to fit a classification model, the development set to find the EER, whereas the test set is used to report the final error rates. 1 This dataset is freely available through FigShare (http://figshare.com/articles/visualrhythm antispoofing/1295453). 2 The source code is freely available for scientific purposes on GitHub (https://github.com/allansp84/spectralcubes), along with this article.
For reproducibility purposes, this section discuss the parameters whose values are constant in the setup of our method. We extract the noise signature from RGB videos using a Gaussian filter with µ = 0, σ = 0.5, and kernel size 3 × 3 (Eq. 1). These values were obtained empirically in [9]. Next, we extract cuboids of size 32 × 32 × 8 from the Fourier spectrum videos (Eqs. 5 and 6), whose spatio-temporal location is chosen randomly based on a uniform distribution. The use of spatial measures produces low-level 8dimensional descriptors per channel, whereas the use of spatiotemporal measures produces low-level 7-dimensional descriptors per channel, which gives us a final low-level descriptor of 24-dimensional and 21-dimensional, respectively. Finally, the number of cubes extracted from videos is determined by dividing the volume of the video with respect to the cube. Regarding the mid-level descriptors, the only parameters with constant values are the ones that define the Gaussian kernel used in the soft-assignment coding technique, whose values are µ = 0 and σ = 0.04. Finally, the SVM parameters are found through grid search in the training data. D. Experimental Design and Analysis To find the best method configuration, we performed a factorial experiment with replication (N = 3) followed by an analysis of variance (ANOVA) [60]. Each experimental unit is represented as a tuple of n objects, each one with a level of a factor. Considering the replications, we have a total of 9, 216
IEEE TRANSACTIONS ON IMAGE PROCESSING, VOL. XX, NO. XX, DECEMBER XXXX
8
Fig. 5. Examples of valid access video frames for outdoor (first and second images on the left) and indoor (three images on the right) scenes.
Fig. 6. Examples of attempted attack video frames for outdoor (first and second images on the left) and indoor (three images on the right) scenes using Sony (first and second columns), Canon (third and fourth columns) and Nikon (last column) cameras. TABLE I A FTER THE STATISTICAL ANALYSIS , WE HAVE FOUND THAT THE FACTORS HIGHLIGHTED WITH † ARE THE ONES THAT DID NOT PRESENT STATISTICAL SIGNIFICANCE WHEN CONFIGURING OUR METHOD , WHEREAS THE LEVELS HIGHLIGHTED IN BOLD ARE THE CHOSEN LEVELS . Factor
Levels
Description
LGF
C, and W
M
PE, PH, ME, MH, PMI, MMI, PC, and MC
CS
R, and K
SDD†
S and D
DS†
80, 120, 160, 200, 240, 280, 320, and 360
CP
hardsum, hardmax softmax SVM and PLS
Strategies for extracting the low-level features from video of phase spectrum or video of magnitude spectrum: extraction considering a central region (crop) in each frame (C) and the entire/whole frames (W). Characteristics of the frequency spectrum evaluated that can be the phase (P) or magnitude (M) and the measures used for summarizing the spectral information that can be energy (E), entropy (H), mutual information (MI), or correlation (C). Mode of selection of the visual words that compose the visual codebooks: Random (R) or using k-means clustering algorithm (K). Strategies for generating the visual codebooks: a single visual codebook (S) and class-based visual codebooks (D), one for each data class (spoofing vs non-spoofing). Visual codebook sizes. This is an important parameter because the visual codebook size gives us visual codebooks with different degrees of specificities because large visual codebooks can incorporate small clusters of data that appear sometimes in specific cases. We evaluate the combination of two strategies in the coding process (hard-assignment and soft-assignment) and two strategies in the pooling process (max-pooling and sum-pooling). Classification algorithms.
C
and
tuples, which are used to instantiate the proposed method. The instances of the proposed method are evaluated through the measurement of the value of the system response variable, the AUC value, after running such instances using the ReplayAttack dataset and Protocol I, using the development set. Next, we collect obtained AUC values and then we performed an ANOVA test to analyze the significance of the effects of the parameters on the classification results. With this approach, we can discover which parameters significantly affect the system response variable and also the best configuration of the method [61]. Henceforth, the method parameters are referred to as factors and their values as levels. Table I shows a brief description of the factors and their respective levels we consider herein. 1) Low-Level Descriptor Extraction Parameter Analysis (LGF and M): The low-level feature extraction has two important parameters: the frequency characteristics of the signal (phase or magnitude), and the function used to summarize the information of the temporal cubes extracted from a video. In this work, we evaluate measures that describe spatial information of the temporal cubes (energy an entropy), and measures that describe the temporal behavior of the cubes (mutual information and correlation across time). To find which levels are statistically different for each factor,
we perform the Tukey’s HSD test (see Fig. 7). In Figs. 7(a)(b), the pairs in comparison whose confidence intervals do not intercept the zero value are statistically different. Considering the top-5 method configuration obtained in this experiment, we conclude that the whole frame for extracting features is more interesting than any cropped region in the center of the frame. In addition, the characteristic extracted of the Fourier spectrum and the summarization measure used to generate the low-level feature descriptors have a great impact in the method discriminability (Fig. 7(b)), as several comparisons in pairs of features are statistically significant. 2) Mid-Level Descriptor Extraction Parameter Analysis (CS, SDD, DS, and CP): To construct a discriminative visual codebook, we need to choose the best strategy for selecting the words that compose the visual codebooks (CS) as random or clustering-based, the visual codebook size (DS), the policy to create the visual codebooks (SDD) as single or class-based, and the pooling and coding strategies (CP). Fig. 8 shows the results of the post-hoc test with Tukey’s HSD. In Fig. 8(a), we have the results of the statistical analysis for DS parameter (dictionary size), to which was not found statistical significance. Therefore, we recommend that dictionary size parameter to be optimized according to the application of interest. In turn, Fig. 8(b) shows that different pooling and
IEEE TRANSACTIONS ON IMAGE PROCESSING, VOL. XX, NO. XX, DECEMBER XXXX
9
95% family−wise confidence level ME−MC MH−MC MMI−MC PC−MC PE−MC PH−MC PMI−MC MH−ME MMI−ME PC−ME PE−ME PH−ME PMI−ME MMI−MH PC−MH PE−MH PH−MH PMI−MH PC−MMI PE−MMI PH−MMI PMI−MMI PE−PC PH−PC PMI−PC PH−PE PMI−PE PMI−PH
95% family−wise confidence level
−30 −20 −10 0 10 20 30
W−C
−3 −2 −1 0 1 Differences in mean levels of LGF
Differences in mean levels of M
(a) LGF denotes the region of the frame for extracting the low-level features.
(b) M refers to summarization measure and the video of spectra used to generated the low-level descriptors.
Fig. 7. Confidence interval on the differences between the means of the levels of the factors (a) LGF, and (b) M. For each comparison, the Tukey’s HSD test provides an estimation of the differences between mean pairs and their respective confidence intervals, as well the p-value for each comparison. All comparisons whose confidence intervals do not contain zero value have a p-value lower than 0.05 and, therefore, are statistically different with a 95% confidence level. (See Table I to see the description of levels.) 95% family−wise confidence level 120−80 160−80 200−80 240−80 280−80 320−80 360−80 160−120 200−120 240−120 280−120 320−120 360−120 200−160 240−160 280−160 320−160 360−160 240−200 280−200 320−200 360−200 280−240 320−240 360−240 320−280 360−280 360−320 −1 0 1 2 Differences in mean levels of DS
(a) DS refers to the number of time-spectral visual words present in the visual codebook. 95% family−wise confidence level
95% family−wise confidence level
95% family−wise confidence level
hardsum−hardmax
R−K
softmax−hardmax
S−D
softmax−hardsum −5 −4 −3 −2 −1 0 1 2 Differences in mean levels of CP
(b) CP denotes the coding and pooling strategies used to build the mid-level descriptors.
−3
−2 −1 0 1 Differences in mean levels of CS
(c) CS denotes the selection mode of the time-spectral visual words for composing the visual codebook.
−1.0 −0.5 0.0 0.5 1.0 Differences in mean levels of SDD
(d) SDD denotes the strategies for generating the visual codebooks, single or class-based visual codebooks.
Fig. 8. Confidence interval of the differences between the means of the levels of the factors (a) DS, (b) CP, (c) CS and (d) SDD. All comparisons whose confidence intervals do not contain zero value have a p-value lower than 0.05 and, therefore, are statistically different with a 95% confidence level as it is the case for the comparisons indicated on the (a) x axis and (b-d) y axis. (See Table I for the description of levels.)
coding processes causes statistically significant impacts on the response variable, and softmax is the recommended choice. In addition, Fig. 8(c) shows that the method used to select the words that compose the visual codebook (random vs. clustering-based selection) also presents results that are statistically significant with k-means being the recommend choice due to the high performance achieved by models built with visual codebooks generated using k-means, during this experiment. Finally, Fig. 8(d) shows that the visual codebook creation strategy (single visual codebook vs. class-based codebooks) does not present statistical difference and, therefore, should also be considered in a future optimization process during the implementation of the method in a real application. 3) Classification Step Parameter Analysis (C): The SVM classifier outperformed PLS classifier with a statistically significant difference (p-value = 0.00). We believe that this happened because of the non-linearity of the data as we use a non-linear version of SVM the a linear version of PLS.
4) Analysis of Interaction Effects and Choice of the Best Configuration: After analyzing each factor in isolation, we examine whether there is significant interaction between factors. In this case, if a small p-value is obtained in the interaction effect analysis between two factors, then we can conclude that these factors do not operate independently of each other [61]. Otherwise, there is no evidence of an interaction effect. First of all, we can see that there is a relationship between the region from which the low-level time-spectral features are extracted (factor LGF) and the spectral information used in the generation of time-spectral descriptors (factor M). When analyzing the magnitude spectrum of the Fourier transform, we see that there is a concentration of low frequency components in the abscissa and ordinate axes. Fig. 9 shows that this interaction between factors LGF and M exists. In addition: (i) we have an increase in the mean of AUC values for measures M H, P H, P E and P M I, when these measures are calculated in the center region of the frames; (ii) we have a decrease in
IEEE TRANSACTIONS ON IMAGE PROCESSING, VOL. XX, NO. XX, DECEMBER XXXX
10
the mean of AUC for measure P C; and (iii) we have very small changes in mean values of AUC for M C and M M I when we compare the two strategies for feature extraction.
DET Curve
40
Overall test set Fixed-support attacks Hand-based attacks
Mean of AUC (%) 75 80 85
90
●
●
● ● ●
70
●
5
2
1 1
2
2
5
10
20
40
1 1
2
FRR (%)
5
10
20
40
FRR (%)
(a)
(b)
Fig. 10. Results obtained on Replay-Attack dataset for each type of attack using fixed-support (a) in contrast with hand-based attacks (b).
CP Factor softmax hardmax hardsum
73
65
10
78
MC PC ME PMI MMI PH PE MH
10
5
Mean of AUC (%) 74 75 76 77
95
●
20
FAR (%)
FAR (%)
20
M Factor
DET Curve
40
Overall test set High-definition attacks Mobile attacks Print attacks
●
60
●
C
W LGF Factor
(a) LGF and M interaction. Note that we have a slump in the mean of AUC when setting LGF to W and decrease the number of low-level features.
K
R CS Factor
(b) CS and CP interaction. We have a significant increase in the mean of AUC with the hard-assignment when we use k-means to select the visual words of the codebooks.
Fig. 9. Interaction plots between pairs of factors (a) LGF×M and (b) CS×CP. The factor LGF denotes the region in the frame considered for extracting the low-level features, while factor M denotes the statistical measures considered for describing the information of the temporal cubes. Finally, the factor CS denotes the mode of selection of the visual words from visual codebooks and the factor CP refers to the strategies used in the coding and pooling process. (See Table I to see the description of levels.)
Finally, the form of selecting the visual words (factor CS) and the method of coding and pooling used in the construction of the dictionaries (factor CP) also presents an interesting interaction. Both factors significantly influence the results, but not in isolation. Fig. 9(b) shows that the results obtained with hardmax, hardsum and softmax are worse when the visual words are chosen randomly instead of through clustering. E. Summary After Analyzing Different Factors and Levels The proposed method presents better results using timespectral features extracted from magnitude spectrum videos considering the whole frames of a video and using the correlation measure from time-spectral features for generating the time-spectral descriptors. The class-based codebooks outperform the single codebook and the selection strategy of the visual words that best fits to the spoofing detection problem is the k-means clustering. The most appropriate size for codebooks is 320 visual words and the softmax outperformed the other coding and pooling strategies. With this configuration, we obtained an AUC of 99.46% and an HTER of 2.75%, considering the test set of the Replay-Attack dataset [28]. Next, we show experiments and results for this method using this final configuration. F. Results This section compares the proposed method with others in the literature for the Replay-Attack [28], CASIA [30] and 3DMAD [35] datasets. In all experiments, we used the best configuration of the proposed method as discussed in the last section. The parameters that did not present statistical significance (DS and SDD), were fine-tuned for each dataset.
1) Replay-Attack Dataset: We first consider the validation Protocol I (c.f., Sec. IV-B) and the Replay-Attack dataset. Table II shows the results for the three types of attacks available in this set. Fig. 10(a) shows that attacks performed with high-quality samples are more difficult to detect (HTER of 5.94%). This result was expected as high-quality fake samples usually contain less artifacts revealing an attack. In turn, video-based and photo-based attacks were easily detected (HTER of 0.63%). Note that video-based spoofing attacks are more susceptible to blurring effects, whereas the photo-based attacks show a large amount of flickering effects due to printing defects. Fig. 10(b) shows results obtained considering fixed-support and hand-based attacks, separately. We believe that hand-based attacks are easier to be detected given that small movements of the impostor user during the attack generate more artifacts in the biometric sample causing more disturbances in the frequency components. TABLE II P ERFORMANCE RESULTS FOR THE R EPLAY-ATTACK DATASET. Dataset
FAR
FRR
HTER
AUC
High-definition attack Mobile attack Print attack Hand-based attack Fixed-support attack Overall test set
10.63 0.00 0.00 1.00 7.50 4.25
1.25 1.25 1.25 1.25 1.25 1.25
5.94 0.63 0.63 1.13 4.38 2.75
98.77 99.95 99.86 99.87 99.03 99.46
2) CASIA Face Anti-Spoofing Dataset: In this experiment, we evaluate the proposed method using the Protocol II (c.f., Sec. IV-B) and CASIA dataset. Table III shows the results obtained for the seven scenarios of attacks available in this dataset. Fig. 11(a) shows that video-based and warp-photo spoofing attacks are easier to be detected by the proposed method (HTER of ≈ 8%). On the other hand, the cut-based spoofing attacks are more difficult to be detected (HTER of 22.22%). One possible reason for cutbased attacks to be more difficult for detecting is that during an attempted attack based on cut-photos, the photographs are practically in the same position during all the time, generating fewer artifacts along time, whereas for the attempted attacks based on warped-photos, the photographs are bent during the attack to simulate facial motion. In addition, we believe that video-based attacks were easier to be detected because of the inevitable downsize of the high-resolution samples by the
IEEE TRANSACTIONS ON IMAGE PROCESSING, VOL. XX, NO. XX, DECEMBER XXXX
DET Curve
40
DET Curve
40
Overall test Set Low Quality Attacks Normal Quality Attacks High Quality Attacks
20
FAR (%)
FAR (%)
Overall test Set Warp Attacks Cut Attack Video Attack
10
5 5
20
10
10
20
40
5 5
FRR (%)
10
20
40
FRR (%)
(a)
(b)
Fig. 11. Results obtained on CASIA dataset for the three type of attacks (a) and for the three quality of attack (b).
screen device used during attack, as also reported by CASIA’s authors [30]. In this case, many evidences of attempted attacks are generated and added to the fake sample. As for the quality of the acquisition (Fig. 11(b)), the proposed method showed better results for attacks carried out with low-quality videos. An interesting result is the best performance of the method to deal with high-resolution videos than normal quality videos. We believe that any conclusion would be precipitous because many factors can influence the noise level of a sensor such as sensor imperfections (e.g., appearance of hot pixels, dead pixels, as well as pixel traps under different acquisition conditions). Several works in the literature have explored these issues. For instance, thermal action has a considerable impact over pattern noise of a digital camera and appearance of defective pixels [62]–[64]. As we do not assure that the captures/recaptures happened under similar acquisition conditions, it is wiser only to point out the existence of classification differences in this case. TABLE III P ERFORMANCE RESULTS FOR THE CASIA DATASET. Dataset
FAR
FRR
HTER
AUC
Low quality Normal quality High quality Warp photo attack Cut photo attack Video attack Overall Attack
10.00 17.78 13.33 7.78 22.22 8.89 14.07
10.00 20.00 13.33 8.89 22.22 8.89 14.44
10.00 18.89 13.33 8.33 22.22 8.89 14.26
98.11 87.67 95.04 96.05 87.27 96.41 93.25
3) 3DMAD Dataset: We now turn our attention to evaluate the proposed method for mask-based spoofing attack detection using the Protocol IV (c.f., Sec. IV-B). Using the official dataset protocol, the proposed method obtained an AUC of 96.16% and an HTER of 8.0%. Erdogmus et al. [18] reported an HTER of 0.95% using block-based LBP features (local features) and the Linear Discriminant Analysis (LDA) classifier. This performance difference is somewhat explained due to the different validation protocol used. Erdogmus et al. used an 1000-fold cross validation method and, in each fold, the clients from the dataset were randomly assigned into training, development and test sets. In our case, we randomly divided the clients from dataset and assigned them into training, development and test set only once. Even so, the proposed method outperforms
11
other techniques using global LBP, whose HTERs reported by Erdogmus et al. were all above 10.0%. 4) UVAD Dataset: In this experiment, we evaluate the proposed method using the Protocol III (c.f., Sec. IV-B) and UVAD dataset. We also evaluate the proposed method considering LBP-based and motion-based countermeasure methods. According to Pereira et al. [40], the correlation method presents an HTER of 11.79% on Replay-Attack. In turn, LBPu2 8,1 [28] was effective to characterize the artifacts embedded in the attack videos on Replay-Attack obtaining an HTER of 15.16%. In the UVAD dataset, however, both methods obtained a more modest performance as Table IV shows. With respect to LBPu2 8,1 method, for instance, the proposed method reduces the classification error in about 36%. TABLE IV C OMPARISON AMONG LBP- BASED APPROACH [28], MOTION - BASED APPROACH [31] AND THE PROPOSED METHOD ON THE UVAD DATASET. Methods
FAR (%)
FRR (%)
HTER (%)
Correlation [31] LBPu2 8,1 [28] Proposed Method
81.60 27.41 44.73
14.56 66.04 15.00
48.06 46.72 29.87
5) Comparison with State-of-the-Art Methods for CASIA and Replay-Attack Datasets: In this section, we compare the proposed method with others available in the literature for Replay-Attack and CASIA datasets. Table V shows results for the Replay-Attack Dataset. The proposed method outperforms the ones based on texture analysis [8], [28], [41] and also methods based on motion analysis [31]. It was also more effective than methods based on fusion schemes reported by Pereira et al. [40] and Komulainen et al. [65], with a relative error reduction (RER) of 67.69% and 46.18%, respectively. TABLE V C OMPARISON AMONG THE EXISTING METHODS . T HE FIRST COLUMN SHOWS THE HTER S REPORTED BY THE AUTHORS , WHEREAS THE SECOND COLUMN SHOWS THE R ELATIVE E RROR R EDUCTION (RER) OBTAINED WITH THE PROPOSED METHOD . T HE REPORTED HTER S WERE OBTAINED USING THE ORIGINAL R EPLAY-ATTACK DATASET [28] PROTOCOL . T HE RESULTS HIGHLIGHTED WITH † AND ‡ WERE REPORTED BY C HINGOVSKA ET AL . [28] AND P EREIRA ET AL . [40], RESPECTIVELY. Methods
HTER (%)
RER (%)
Chingovska et al. [28] Pinto et al. [58] M¨aa¨ tt¨a et al. [8] Anjos and Marcel [31] Pereira et al. [40] Pereira et al. [41] Komulainen et al. [65] Proposed Method
15.16 14.27 13.87† 11.79‡ 8.51 7.60 5.11 2.75
81.86 80.73 80.17 76.68 67.69 63.82 46.18 0
Table VI shows a comparison among the proposed method and others reported in the literature for CASIA dataset. The proposed method is on par with the best ones in the literature. 6) Analysis of the Minimum Detection Time: We now analyze the impact of the video length over the method discriminability for CASIA, Replay-Attack and 3DMAD datasets. This experiment evaluates: the minimum number of frames
IEEE TRANSACTIONS ON IMAGE PROCESSING, VOL. XX, NO. XX, DECEMBER XXXX
TABLE VI C OMPARISON AMONG THE PROPOSED METHOD AND OTHERS AVAILABLE IN THE LITERATURE . ACCORDING TO THE AUTHORS OF THE PROPOSED METHODS , EER S REPORTED WERE OBTAINED USING THE ORIGINAL CASIA DATASET [30] PROTOCOL . Methods DoG Baseline. [30] LBPu2 8,1 . [41] LBP-TOPu2 8,8,8,1,1,1 . [41] Proposed Method
EER (%) 17.0 16.0 10.0 14.0
required for the method to operate; and the method stability, in terms of HTER(%), for the three different datasets. Fig. 12 indicates that HTER values vary only slightly when we change the video length for the three datasets and that the proposed method uses about two seconds to detect an attempted attack, thus not compromising the transparency of the authentication process. 45
Replay-Attack CASIA 3DMAD
40 35 HTER (%)
30 25
12
attacks. We believe that such variability adds different sensorintrinsic noise levels to the training samples, which contribute to build a more robust classification model. With regard to the more modest generalization presented during the test of the 3DMAD dataset, we believe that it is due to the absence of some artifacts that are commonly found in samples from photo-based and video-based attacks (e.g., blurring, flickering effects) that were not found in the attempted attack video from 3D masks. In addition, spoofing attacks performed with masks are less likely to add temporal disturbances similar to those added when the impostor presents the fake samples, by hand, using a monitor or a photo. Finally, Table VIII shows a comparison among the obtained results reported in the literature. Except for the correlation method, all others present a better performance when they are trained with CASIA. Once again, we believe that our method performs better when training with CASIA because such dataset is more heterogeneous than Replay-Attack. The Correlation [31] and LBP-TOP [28] methods aim to characterize temporal information, similarly to the proposed method, and the results of both methods emphasize the difficulty in characterizing such information completely. In this protocol, besides handling data from different sensors, all methods have to deal with different lighting conditions and background.
20
V. C ONCLUSIONS AND F UTURE W ORK
15 10 5 0
25
50
75 100 125 150 175 200 225 250 275 300 325 350 375 Frame Numbers
Fig. 12. Results in terms of HTER (%) of the proposed method for different video input length for Replay-Attack, CASIA and 3DMAD datasets.
7) Cross-Dataset Evaluation: In this section, we discuss the performance of the proposed method considering a more difficult scenario (cross-dataset), in which the proposed method is trained with one dataset but it is tested on a different dataset with different acquisition conditions. In this experiment, all datasets used during the training were randomly divided into training and development sets in a proportion of 80% and 20%, respectively. The development set is used to estimate the EER threshold that is necessary to calculate the HTER during the test. Table VII shows the results using the cross-dataset protocol. The results indicate that the proposed method presents better generalization when trained with CASIA, with a mean HTER of 40.17%. We believe this occurred due to more variability of the type of attacks and video quality in the CASIA dataset, which enriches the training. This dataset contains warped-, cut- and video-based attacks performed with spoofed samples of different quality: low, normal and high quality. Such characteristics enables a better generalization of the method when CASIA is used for training. In turn, the best performance when testing the CASIA and 3DMAD datasets was obtained when training with UVAD dataset, another rich dataset for training. Although this dataset contains only video-based spoofing attacks, it has comprises different sensors (for capturing and recapturing the biometric samples) and display devices used during the attempted
In this paper, we proposed an algorithm for detecting spoofing attacks that takes advantage of noise and artifacts added to the synthetic biometric samples during their manufacture and recapture. We showed that the analysis of the behavior of the noise signature, in the frequency domain, is proper to reveal spoofing attacks. For this, we proposed the use of time-spectral features as low-level descriptors, which gather temporal and spectral information in a single feature descriptor. To handle several types of attacks and to obtain a feature descriptor with a suitable generalization, we also proposed the use of the visual codebook concept to find a mid-level representation from time-spectral descriptors. The experimental results showed that the magnitude is an important characteristic from a signal, in frequency domain, for spoofing attack detection. We also showed how to use the visual codebook concept effectively in order to find a more robust space representation to the different kinds of attacks and with a good generalization. The obtained results demonstrated the effectiveness of the proposed method in detecting different types of attacks (photo-, video-, and 3D-mask-based ones). We believe that the frequency-based approach used is effective because we have a decrease in low frequency components due to information loss caused during manufacture of the fake samples (e.g., information loss during printing) and recapture (e.g., blurring effect) and an increase in some high frequency components in the fake samples during recapture due to some artifacts added to the fake samples (e.g., printing artifacts, banding effect, noise added by the imaging sensor). Moreover, these disturbances in the composition of the components of frequencies are best characterized as we analyze the biometric sample in the frequency domain rather than spatial domain and along time instead of on isolated frames or still images.
IEEE TRANSACTIONS ON IMAGE PROCESSING, VOL. XX, NO. XX, DECEMBER XXXX
13
TABLE VII R ESULTS OBTAINED WITH THE CROSS - DATASET PROTOCOL AND USING THE OVERALL TEST SETS OF EACH DATASET. Train CASIA
Replay-Attack
UVAD
Test
FAR (%)
FRR (%)
HTER (%)
3DMAD Replay-Attack UVAD 3DMAD CASIA UVAD 3DMAD CASIA Replay-Attack
88.00 32.50 38.61 52.00 0.00 5.74 84.00 13.70 79.25
4.00 36.25 41.67 44.00 100.0 83.33 4.00 63.33 6.25
46.00 34.38 40.14 48.00 50.00 44.54 44.00 38.52 42.75
Proposed Method Correlation LBP-TOPu2 8,8,8,1,1,1 LBPu2 8,1
40.17%
47.45%
41.76%
Train
Test
HTER (%)
attacks (e.g., LBP, LBP-TOP, and their variants) could be transformed in a new representation space better adapted to the face spoofing problem in a scenario with different types of attacks.
Replay-Attack CASIA Replay-Attack CASIA Replay-Attack CASIA Replay-Attack CASIA
CASIA Replay-Attack CASIA Replay-Attack CASIA Replay-Attack CASIA Replay-Attack
50.00 34.38 48.28 50.25 61.33 50.64 57.90 47.05
ACKNOWLEDGMENTS We thank CAPES (DeepEyes Project), FAPESP (#2010/05647-4), CNPq (#307113/2012-4, #304352/2012-8, #477662/2013-7, #487529/2013-8 and #477457/2013-4), FAPEMIG (APQ-01806-13 and APQ-00567-14), and Microsoft Research for the financial support.
TABLE VIII C OMPARISON AMONG DIFFERENT ANTI - SPOOFING METHODS CONSIDERING CROSS - DATASET PROTOCOL . Methods
Mean HTER (%)
R EFERENCES Regarding the important cross-dataset validation, the performed experiments demonstrated that the proposed method and other approaches available in the literature still have modest generalizations. This is of particular importance for the research community as it shows that the problem is still far from solved and cross-dataset validation must be considered from now on when designing and deploying spoofing detection techniques. As discussed earlier, we observed that different biometric sensors present different properties. Therefore, it is important to train a classifier considering this variability. UVAD dataset comes in hand for this purpose and will surely serve the community in this regard with more than 15k samples of hundreds of clients and diverse sensors. Finally, it is worth mentioning that we do not claim to introduce the best method out there for spoofing detection. On the contrary, our very objective in this paper was to show that capturing spatio, spectral and temporal features from biometric samples can be successfully considered in the spoofing detection scenario. That being said, it is likely that the proposed approach, when combined with existing ones in the literature, may as well boost the performance since they will likely rely on complementary features for solving the problem. Directions for future research include the investigation of new approaches to transforming low-level descriptors into mid-level descriptors as Fisher vectors [66] and Bossa Nova [45]. These strategies for finding mid-level representations could also be exploited by methods that use texturebased descriptors. In such cases, the goal would be to investigate whether the representation space found by the texture descriptors used in the literature for detecting face spoofing
[1] H. Tipton, Information Security Management Handbook, 5th ed. Boca Raton, FL, USA: CRC Press, Inc., 2003. [2] A. Jain, A. A. Ross, and K. Nandakumar, “Introduction,” in Introduction to Biometrics. Springer US, 2011, pp. 1–49. [3] L. O’Gorman, “Comparing passwords, tokens, and biometrics for user authentication,” Proc. IEEE, vol. 91, no. 12, pp. 2021–2040, 2003. [4] L. Wiskott, J.-M. Fellous, N. Kuiger, and C. Von der Malsburg, “Face recognition by elastic bunch graph matching,” IEEE Trans. Pattern Anal. Mach. Intell., vol. 19, no. 7, pp. 775–779, July 1997. [5] T. Ahonen, A. Hadid, and M. Pietik¨ainen, “Face recognition with local binary patterns,” in European Conference on Computer Vision, 2004, pp. 469–481. [6] C. Liu and H. Wechsler, “A shape- and texture-based enhanced fisher classifier for face recognition,” IEEE Trans. Image Process., vol. 10, no. 4, pp. 598–608, Apr. 2001. [7] D. Maltoni, D. Maio, A. K. Jain, and S. Prabhakar, Handbook of Fingerprint Recognition, 2nd ed. Springer Publishing Company, Incorporated, 2009. [8] J. M¨aa¨ tt¨a, A. Hadid, and M. Pietik¨ainen, “Face spoofing detection from single images using micro-texture analysis,” in IEEE Int. Joint Conference on Biometrics, Oct. 2011, pp. 1 –7. [9] A. Pinto, H. Pedrini, W. R. Schwartz, and A. Rocha, “Video-based face spoofing detection through visual rhythm analysis,” in Conference on Graphics, Patterns and Images, Aug. 2012, pp. 221–228. [10] X. Tan, Y. Li, J. Liu, and L. Jiang, “Face liveness detection from a single image with sparse low rank bilinear discriminative model,” in European Conference on Computer Vision, 2010, pp. 504–517. [11] G. Pan, L. Sun, Z. Wu, and S. Lao, “Eyeblink-based anti-spoofing in face recognition from a generic webcamera,” in IEEE Int. Conference on Computer Vision, Oct. 2007, pp. 1–8. [12] C. Xu, Y. Zheng, and Z. Wang, “Eye states detection by boosting local binary pattern histogram features,” in IEEE Int. Conference on Image Processing, Oct. 2008, pp. 1480–1483. [13] J.-W. Li, “Eye blink detection based on multiple gabor response waves,” in Int. Conference on Machine Learning and Cybernetics, vol. 5, Jul. 2008, pp. 2852 –2856. [14] W. Bao, H. Li, N. Li, and W. Jiang, “A liveness detection method for face recognition based on optical flow field,” in Int. Conference on Image Analysis and Signal Processing, Apr. 2009, pp. 233–236. [15] K. Kollreider, H. Fronthaler, and J. Bigun, “Non-intrusive liveness detection by face images,” Image and Vision Computing, vol. 27, no. 3, pp. 233–244, 2009.
IEEE TRANSACTIONS ON IMAGE PROCESSING, VOL. XX, NO. XX, DECEMBER XXXX
[16] G. Pan, L. Sun, Z. Wu, and Y. Wang, “Monocular camera-based face liveness detection by combining eyeblink and scene context,” Telecommunication Systems, vol. 47, pp. 215–225, 2011. [17] L. Sun, W. Huang, and M. Wu, “TIR/VIS Correlation for Liveness Detection in Face Recognition,” in Computer Analysis of Images and Patterns, 2011, pp. 114–121. [18] N. Erdogmus and S. Marcel, “Spoofing in 2D face recognition with 3D masks and anti-spoofing with kinect,” in IEEE Int. Conference on Biometrics: Theory Applications and Systems, Sept 2013, pp. 1–6. [19] I. Chingovska, J. Yang, Z. Lei, and D. e. a. Yi, “The 2nd Competition on Counter Measures to 2D Face Spoofing Attacks,” in IAPR Int. Conference on Biometrics, Jun. 2013, pp. 1–6. [20] J. Li, Y. Wang, T. Tan, and A. K. Jain, “Live face detection based on the analysis of fourier spectra,” in Biometric Technology for Human Identification, vol. 5404. Proc. SPIE, 2004, pp. 296–303. [21] T.-W. Lee, G.-H. Ju, H.-S. Liu, and Y.-S. Wu, “Liveness detection using frequency entropy of image sequences,” in IEEE Int. Conference on Acoustics, Speech, and Signal Processing, 2013, pp. 2367–2370. [22] B. Peixoto, C. Michelassi, and A. Rocha, “Face liveness detection under bad illumination conditions,” in IEEE Int. Conference on Image Processing, Sep. 2011, pp. 3557 –3560. [23] W. Robson Schwartz, A. Rocha, and H. Pedrini, “Face spoofing detection through partial least squares and low-level descriptors,” in IEEE Int. Joint Conference on Biometrics, Oct. 2011, pp. 1 –8. [24] J. Maatta, A. Hadid, and M. Pietikainen, “Face spoofing detection from single images using texture and local shape analysis,” IET Biometrics, vol. 1, no. 1, pp. 3 –10, Mar. 2012. [25] G. Kim, S. Eum, J. K. Suhr, D. I. Kim, K. R. Park, and J. Kim, “Face liveness detection based on texture and frequency analyses,” in IAPR Int. Conference on Biometrics, Apr. 2012, pp. 67 –72. [26] J. Komulainen, A. Hadid, and M. Pietik¨ainen, “Face spoofing detection using dynamic texture,” in ACCV Int. Workshops, 2013, pp. 146–157. [27] R. Tronci, D. Muntoni, G. Fadda, M. Pili, N. Sirena, G. Murgia, M. Ristori, and F. Roli, “Fusion of multiple clues for photo-attack detection in face recognition systems,” in IEEE Int. Joint Conference on Biometrics, Oct. 2011, pp. 1 –6. [28] I. Chingovska, A. Anjos, and S. Marcel, “On the effectiveness of local binary patterns in face anti-spoofing,” in Int. Conference of the Biometrics Special Interest Group, Sep. 2012, pp. 1 –7. [29] J. Yan, Z. Zhang, Z. Lei, D. Yi, and S. Z. Li, “Face liveness detection by exploring multiple scenic clues,” in Int. Conference on Control Automation Robotics and Vision, Dec 2012, pp. 188–193. [30] Z. Zhang, J. Yan, S. Liu, Z. Lei, D. Yi, and S. Li, “A face antispoofing database with diverse attacks,” in IAPR Int. Conference on Biometrics, Apr. 2012, pp. 26 –31. [31] A. Anjos and S. Marcel, “Counter-measures to photo attacks in face recognition: A public database and a baseline,” in IEEE Int. Joint Conference on Biometrics, Oct. 2011, pp. 1 –7. [32] J. Galbally, S. Marcel, and J. Fierrez, “Biometric antispoofing methods: A survey in face recognition,” IEEE Access, vol. 2, pp. 1530–1552, 2014. [33] S. Marcel, M. S. Nixon, and S. Z. Li, Handbook of Biometric AntiSpoofing: Trusted Biometrics Under Spoofing Attacks. Springer Publishing Company, Incorporated, 2014. [34] M. Chakka, A. Anjos, S. Marcel, Tronci, and et al., “Competition on Counter Measures to 2-D Facial Spoofing Attacks,” in IEEE Int. Joint Conference on Biometrics, 2011, pp. 1–6. [35] N. Erdogmus and S. Marcel, “Spoofing 2D face recognition systems with 3D masks,” in Int. Conference of the Biometrics Special Interest Group, 2013, pp. 1–8. [36] W. Zhang, S. Shan, W. Gao, X. Chen, and H. Zhang, “Local Gabor binary pattern histogram sequence (LGBPHS): a novel non-statistical model for face representation and recognition,” in IEEE Int. Conference on Computer Vision, vol. 1, 2005, pp. 786–791 Vol. 1. [37] M. G¨unther, D. Haufe, and R. P. W¨urtz, “Face recognition with disparity corrected gabor phase differences,” in Int. Conference on Artificial Neural Networks and Machine Learning, 2012, pp. 411–418. [38] N. Kose and J.-L. Dugelay, “Reflectance analysis based countermeasure technique to detect face mask attacks,” in Int. Conference on Digital Signal Processing, 2013, pp. 1–6. [39] N. Almoussa, “Variational retinex and shadow removal,” University of California, Department of Mathematics, Tech. Rep., 2009. [40] T. de Freitas Pereira, A. Anjos, J. De Martino, and S. Marcel, “Can face anti-spoofing countermeasures work in a real world scenario?” in IAPR Int. Conference on Biometrics, 2013, pp. 1–8. [41] T. Freitas Pereira, J. Komulainen, A. Anjos, J. De Martino, A. Hadid, M. Pietikainen, and S. Marcel, “Face liveness detection using dynamic
[42] [43] [44] [45] [46] [47]
[48] [49] [50]
[51]
[52] [53] [54] [55] [56] [57] [58] [59]
[60] [61] [62]
[63] [64]
[65] [66]
14
texture,” EURASIP Journal on Image and Video Processing, vol. 2014, no. 1, p. 2, 2014. A. Beach, Real world video compression, 1st ed. Berkeley, CA, USA: Peachpit Press, 2008. S. W. Smith, The Scientist and Engineer’s Guide to Digital Signal Processing. San Diego, CA, USA: California Technical Pub., 1997. J. Sivic and A. Zisserman, “Video google: a text retrieval approach to object matching in videos,” in IEEE Int. Conference on Computer Vision, 2003, pp. 1470–1477 vol.2. S. Avila, N. Thome, M. Cord, E. Valle, and A. de A Araujo, “BOSSA: Extended bow formalism for image classification,” in IEEE Int. Conference on Image Processing, Sep. 2011, pp. 2909–2912. D. Vigo, F. Shahbaz Khan, J. van de Weijer, and T. Gevers, “The impact of color on bag-of-words based object recognition,” in Int. Conference on Pattern Recognition, 2010, pp. 1549–1553. A. Hernandez-Vela, M. Bautista, X. Perez-Sala, V. Ponce, X. Baro, O. Pujol, C. Angulo, and S. Escalera, “BoVDW: Bag-of-Visual-andDepth-Words for gesture recognition,” in Int. Conference on Pattern Recognition, Nov. 2012, pp. 449–452. O. A. Penatti, F. B. Silva, E. Valle, V. Gouet-Brunet, and R. da S. Torres, “Visual word spatial arrangement for image retrieval and classification,” Pattern Recognition, vol. 47, no. 2, pp. 705–720, 2014. A. Klaeser, M. Marszalek, and C. Schmid, “A spatio-temporal descriptor based on 3D-gradients,” in Proceedings of the British Machine Vision Conference. BMVA Press, 2008, pp. 99.1–99.10, doi:10.5244/C.22.99. J. Alon, V. Athitsos, Q. Yuan, and S. Sclaroff, “A unified framework for gesture recognition and spatiotemporal gesture segmentation,” IEEE Trans. Pattern Anal. Mach. Intell., vol. 31, no. 9, pp. 1685–1699, Sept 2009. W. Ren, S. Singh, M. Singh, and Y. Zhu, “State-of-the-art on spatio-temporal information-based video retrieval,” Pattern Recognition, vol. 42, no. 2, pp. 267 – 282, 2009, Learning Semantics from Multimedia Content. Y.-L. Boureau, F. Bach, Y. LeCun, and J. Ponce, “Learning mid-level features for recognition,” in IEEE Int. Conference on Computer Vision and Pattern Recognition, Jun. 2010, pp. 2559–2566. J. C. Gemert, J.-M. Geusebroek, C. J. Veenman, and A. W. Smeulders, “Kernel codebooks for scene categorization,” in European Conference on Computer Vision. Springer-Verlag, 2008, pp. 696–709. L. Liu, L. Wang, and X. Liu, “In defense of soft-assignment coding,” in IEEE Int. Conference on Computer Vision, Nov. 2011, pp. 2486–2493. A. Hoskuldsson, “Pls regression methods,” J. Chemometrics, vol. 2, no. 3, pp. 211–228, 1988. C. Cortes and V. Vapnik, “Support-vector networks,” Machine Learning, vol. 20, no. 3, pp. 273–297, Sep. 1995. A. Pinto, “A countermeasure method for video-based face spoofing attacks,” Master’s thesis, University of Campinas, Oct. 2013. A. Pinto, W. Robson Schwartz, H. Pedrini, and A. Rocha, “Using visual rhythms for detecting video-based facial spoof attacks,” IEEE Trans. Inf. Forens. Security, vol. 10, no. 5, pp. 1025–1038, May 2015. A. Anjos, L. El-Shafey, R. Wallace, M. G¨unther, C. McCool, and S. Marcel, “Bob: A free signal processing and machine learning toolbox for researchers,” in ACM Conference on Multimedia Systems. New York, NY, USA: ACM, 2012, pp. 1449–1452. R. E. Walpole, R. H. Myers, S. L. Myers, and K. Ye, Probability & Statistics for Engineers and Scientists, 8th ed. Upper Saddle River: Pearson Education, 2007. A. Hayter, Probability and Statistics for Engineers and Scientists, 4th ed. Cengage Learning, 2012. M. Chen, J. Fridrich, J. Luk´asˇ, and M. Goljan, “Imaging sensor noise as digital x-ray for revealing forgeries,” in Information Hiding, ser. Lecture Notes in Computer Science, T. Furon, F. Cayre, G. Do¨err, and P. Bas, Eds., 2007, vol. 4567, pp. 342–358. J. Luk¨as, J. Fridrich, and M. Goljan, “Digital camera identification from sensor pattern noise,” IEEE Trans. Inf. Forens. Security, vol. 1, no. 2, pp. 205 – 214, Jun. 2006. A. Rocha, W. Scheirer, T. Boult, and S. Goldenstein, “Vision of the unseen: Current trends and challenges in digital image and video forensics,” ACM Comput. Surv., vol. 43, no. 4, pp. 26:1–26:42, Oct. 2011. J. Komulainen, A. Hadid, M. Pietikainen, A. Anjos, and S. Marcel, “Complementary countermeasures for detecting scenic face spoofing attacks,” in IAPR Int. Conference on Biometrics, Jun. 2013, pp. 1–7. F. Perronnin, J. S´anchez, and T. Mensink, “Improving the fisher kernel for large-scale image classification,” in European Conference on Computer Vision. Springer-Verlag, 2010, pp. 143–156.