University of Melbourne. . Ian Edwards. Luther College. . 1. Background. The increasing use of electronic ...
Facilitating Mathematical Modelling Competencies in the Middle Secondary School Peter Galbraith
Gloria Stillman
University of Queensland
University of Melbourne
Jill Brown
Ian Edwards
University of Melbourne
Luther College
1. Background The increasing use of electronic technology within school mathematics programs imposes responsibilities and challenges across several domains. This is certainly the case for modelling and applications work, and in this paper we report on aspects of a program in which mathematical modelling is being introduced to year 9 students in a Victorian (Australia) secondary college. We recognise and respect the fact that different emphases and purposes lie behind the introduction of applications and mathematical modelling into curricula in different educational settings, and begin by clarifying the position adopted in our program. We do not use applications and mathematical modelling primarily for the purpose of motivating and illustrating the relevance of particular mathematical content, although at times this may occur. Rather we wish to retain, as far as possible, an approach in which the modelling process is driven by the desire to obtain a mathematically productive outcome for a problem with genuine real-world motivation. At times this is directly feasible, while at other times some modifications make the descriptor “life-like” more accurate. The point is that the solution to the problem must take seriously the context outside the mathematics classroom within which the problem is located, in evaluating its appropriateness and value. This approach is consistent with what Julie (2002) refers to as “modelling as content” versus “modelling as vehicle”. If the authenticity of a modelling problem is impacted by the interplay between mathematics and the context within which the problem is set, it is also impacted by the ways in which technology is (or is not) brought to bear on the solution process. We are aware of legitimate and important debates concerning the introduction and use of technology (e.g., calculators of various types) in learning mathematics at different levels and for different purposes, but these debates are not a focus of our interest here. The world outside the classroom is a swampy place as far as problem contexts are concerned, where real data are usually messy and the mathematical methods needed to deal with them sometimes involved, and in need of improvisation. To suggest that such an important part of reality should be “cleaned up” before a problem is presented is, we believe, to destroy a significant element of its authenticity. Consequently, we include the appropriate use of technology1 as central to our purpose, and its integration with mathematics within the modelling process as creating essential challenges about which we need to know much more. 1
An exception is where technology is not available. Then the mathematics must be amenable by hand methods alone, and data provided accordingly.
Data for this paper have been generated within the RITEMATHS project, an Australian Research Council funded project of the University of Melbourne and the University of Ballarat with six schools and Texas Instruments as industry partners. The fourth author is leading initiatives in one of the schools. In summary, matters we are particularly interested in exploring are represented by intersections in Figure 1, and the paper elaborates aspects of how we have gone about teaching and researching these interests.
T(echnology) C∩T
M∩T M∩C∩T
M(odelling) M∩C
C(ontent) Figure 1. Interactions between modelling, mathematics content, and technology
2. The Components 2.1 Mathematics Content With respect to mathematics, it has long been recognised that when learning to model it is unreasonable to expect students to access unaided, and apply mathematics that is at the frontiers of their experience and expertise or beyond. That is, problems need to be such that the mathematics required for solution is within the range of what might be called known and practised knowledge and techniques. It may not be clear however, just which mathematics is appropriate for the job at hand – such decisions are part of the requirements of the modelling process. This is a well-trodden area so we shall not elaborate further. 2.2 Technology With respect to technology the situation is certainly complicated, not only by the knowledge and facility required, but by the skill and confidence with which students work with particular technologies. A focus here is on how students handle tensions between competing authorities, for example machine output, and mathematical integrity (Doerr & Zangor, 2000; Goldenberg, 1990). Doerr and Zangor refer to student preference for calculator output over contextual reality, whereby students insisted on working with 6 decimal places on problems whose data involved using crude measuring devices, while Goldenberg reports on the erroneous interpretation of the graphical representation of functions. Gaps between real mathematics, and the image of mathematics depicted by a screen, suggest the potential emergence of a new ‘tyranny of the screen’ as an authoritative source, replacing, and possibly more insidious, than the traditional ‘tyranny of the text’. It also needs to be recognised that students are not passive recipients of methods, but also have opinions regarding their own perceptions of the effectiveness of approaches they are required to use. IT is okay for drawing graphs … but I feel I still need to understand the principle behind the maths. I have a mental block against performing like a trained ‘circus animal’ and just pressing the right buttons. I need to know why? What for? What am I trying to find out? (Povey & Ransom, 2000, p. 52)
However, a "technology-rich teaching and learning environment" (TRTLE) affords new ways of engaging students in learning mathematics. Affordances 2
are the offerings of such an environment for both facilitating and impeding learning, they are potential relationships between the teacher and/or student and the environment. Affordances need to be perceived and acted on by teachers and students alike in order to take advantage of the opportunities arising. As we know, the presence of electronic technologies in the classroom can fundamentally change how we think mathematically and what becomes privileged mathematical activity. In the classroom reported here, the intention is that the technology is much more than a black box. The teacher moves purposefully to integrate technology throughout the teaching and learning process. The teaching and learning environment (see also Brown, 2004, 2005), includes opportunities for both teacher and students to use a variety of affordances of the technology (in this case, graphical calculators and laptop computers), to support the learning of mathematics in ways well beyond those necessary simply for the production or checking of results. Rather, the technology use is integrated into tasks with the goal of contributing to the development of understanding, and the conceptual and skill development of the students. In particular, the use of multiple representations, easily accessible with a graphical calculator, and tasks that are amenable to electronic technology, harness the opportunity for students to use technology to stimulate higher order thinking in the context of modelling real-world situations. More scaffolding of technical aspects is provided through demonstration or peer interaction when warranted, in an endeavour to ensure task cognitive demand is not increased by technology use (Stillman, Edwards, & Brown, 2004). The intention is to scaffold layers of support for students through the use of a multiple representational approach over the course of the year. Diagrams where construction is facilitated by physical or animated media representations of the situations are used in the development of students’ initial understanding of the task and during the solution process, and for local and global verification of methods and results. Interpretation can occur at all stages of the task solution through, the opportunity for interpretation of interim results in terms of the real situation. However, a multiple representation approach offers additional opportunities for interpretation across representations as well as from each representation back to the situation being modelled. Another factor of importance in technology use is the level of confidence and facility that students believe they possess in accessing and using technology. A series of studies extending over a number of years (e.g., Goos, Galbraith, Renshaw, & Geiger, 2003), have led to the development of a descriptive taxonomy of sophistication with which secondary students worked with technology. The existence of such qualitatively different levels of confidence and expertise clearly has relevance for an introduction to mathematical modelling in which students at the intermediate stage of secondary school are being introduced to technology concurrently. Students in the class studied came with a variety of prior experiences of scientific calculators and spreadsheets from previous classes. Year 9 is the first year that students are required to have their own laptop and TI-83 Plus graphical calculator, and is the first time they use graphical calculators. 2.3 The modelling process 3
Various versions of the diagram in Figure 2 exist (e.g., Edwards & Hamson, 1996) and most may be recognised as relatives or descendants of a diagram initially provided among the teaching materials of the Open University (UK). It represents both a description of a dynamic iterative process, and a scaffolding infrastructure to help beginning modellers through stages of what can initially appear to be a demanding and unfamiliar approach to problem solving. Some such framework is desirable to support a modelling initiative, whether overtly as in Figure 2 or as a means to structure effective sequences of activities, both mathematical and pedagogical. The arrows represent fundamental transitions that depict the dynamic nature of the process, and these are associated with some of the most demanding phases of the modelling process – particularly we would suggest the specification of a solvable mathematical problem from a messy real world context, and its formulation in a way that will lead to an appropriate mathematical solution. Students at the conclusion of a modelling program at senior secondary level rated the formulation phase as both the most demanding and the most important part of the modelling process (Galbraith & Clatworthy, 1990). In this paper we are interested particularly in these and other transition phases as students engage with their first experiences of modelling activity. Real world messy problem
Specify math problem
Formulate
Report
Evaluate
Solve
Interpret
Figure 2. Modelling Process Chart
3. The Problems Below we summarise aspects of two problems that have formed a focus for the introduction of modelling to a class of 28 year 9 students (11 male, 17 female 14-15 year olds) at an independent school in Melbourne. 3.1 Orienteering - Cunning Running (CR) In the Annual “KING OF THE COLLEGE” Orienteering event, competitors are asked to choose a course that will allow them to run the shortest possible distance, while visiting a prescribed number of check point stations. In one stage of the race, the runners enter the top gate of a field, and leave by the bottom gate. During the race across the field, they must go to one of the stations on the bottom fence. Runners claim a station by reaching there first. They remove the ribbon on the station to say it has been used, and other runners need to go elsewhere. There are 18 stations along the fence line at 10 metre intervals, the station closest to Corner A is 50 metres from Corner A, and the distances of the gates from the fence with the stations are marked on the map.
4
Figure 3. Diagram of field THE TASK Investigate the changes in the total path length travelled as a runner goes from gate 1 to gate 2 after visiting one of the drink stations. To which station would the runner travel, if they wished to travel the shortest path length? For the station on the base line closest to Corner A calculate the total path length for the runner going Gate 1 – Station 1 – Gate 2. Use Lists in your calculator to find the total distance across the field as 18 runners in the event go to one of the stations, and draw a graph that shows how the total distance run changes as you travel to the different stations. Observe the graph, then answer these questions. Where is the station that has the shortest th total run distance? Could a 19 station be entered into the base line to achieve a smaller total th run distance? Where would the position of the 19 station be? If you were the sixth runner to reach Gate 1, to which station would you probably need to travel? What is the algebraic equation that represents the graph pattern? Plot this graph of this equation on your graph of the points. If you could put in a 19th station where would you put the station, and why? (Additional suggestions were provided as to how the work might be set out, and for intermediate calculations that would provide some task scaffolding.)
The solution involves the calculation of total path as the sum of two segments, followed by graphing, construction of an algebraic model, verification, interpretation, and the search for a nineteenth station optimally located. Figure 4 shows a typical graph produced by students who chose to use a spreadsheet.
distance(metres)
Total distance of running 330 325 320 315 310 305 300 295 290 285 0
1
2
3
4
5
6
7
8
9
10 11 12 13 14 15 16 17 18
station
Figure 4. Typical spreadsheet graph produced in solution to Cunning Running
5
3.2 Shot on Goal (SOG) Many ball games have the task of putting a ball between goal posts. The shot on the goal has only a narrow angle in which to travel if it is to score a goal. In field hockey or soccer when a player is running along a particular line (a run line parallel to the side line) the angle appears to change with the distance from the goal line. At what position on the run line, does the player have the widest opening for the shot on goal? (See Figure 5) Assume you are not running in the GOAL-to-GOAL corridor. Find the position for the maximum goal opening if the run line is a given distance from the side line As the RUN LINE moves closer or further from the side line, how does the location of the position for the widest view of the goal change? (Relevant field dimensions are provided). Note: Because it was felt to be more inclusive in a co-educational school, and because a number of students play the game, hockey was selected to provide the specific context. There are some caveats associated with this decision. Firstly a shot on goal in hockey is only allowed from a point within the “almost” semi-circular penalty area, and hence technically only some of the run lines are feasible. This aspect can be included at a later stage by first finding the location of the best shooting position in terms of angle as is required by the question, and then checking its position relative to the penalty area. (With Soccer of course there are no such restrictions). ttt
Figure 5. Picture of a hockey field used for explaining the problem
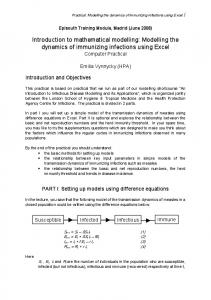
Figure 6 shows calculations obtained using the LISTs facility of a TI 83 Plus calculator, for positions of the goal shooter at perpendicular distances from the goal line of between 1 and 20 metres; along a typical run line that is 10 metres from the sideline. (Width of goalmouth is 3.67 metres). The maximum angle and its reference points are highlighted at L4 (17). Further accuracy can be obtained by testing nearby values, and a graph can be drawn. In practice a player often goes on a zigzag run. Discussion can be used to infer that whatever the path the ultimate shot is from a position on some run-line.
6
Figure 6. Kim’s LISTs for a run line 10m from the side line -1
-1
Note: Actual formulae used were L2 = tan (15.67/L1), L3 = tan (19.33/L1), and L4 = L3 - L2.
3.3 Interactions between modelling, technology, & mathematical content Figure 7 illustrates some of the interactions that take place between the modelling process (M), mathematical content (C), and technology use (T) as foreshadowed in Figure 1. Interactions M∩C
M∩T C∩T
M∩C∩T
Cunning Running
Shot on Goal
Represent problem. To g1 minimise sum of distances (Pythag)
Represent problem. To maximise D ∠BDC
g2
Strategy decisions: e.g. choice of GC functions, Excel. Computation of distances, plotting points, interpreting graphs, verification of algebraic model graphically. Carrying through to solution: Formulate →calculate paths → plot graphs→algebraic model→ interpret output→determine implications in terms of problem requirement.
A
B
C
Strategy decisions: e.g. choice of GC functions, Excel. Computations involving tangent, Use of inverse tan to find angles for different run lines, and different positions on run lines. Carrying through to solution: Choice of approach → appropriate diagram → calculations of angles→ correct graphical output→ interpretation → implications.
Figure 7. Interactions between modelling process, technology, and mathematics
4. Research Focus “You cannot discover new oceans unless you have the courage to lose sight of the shore” (Eade, 2005, p. 66). The research being undertaken is part of a design experiment (Collins, Joseph, & Bielaczyc, 2004), which is in its second cycle. The research focus has been fashioned by the nature of the program, and beliefs about how central elements of interest are best captured and analysed. A classroom in which mathematical modelling is being enacted is a varied and unpredictable place. There is intense activity, fallow time when impasses emerge, and spontaneous and unforeseen actions by students engaging with new material and challenges. Such occurrences trigger at times unplanned interventions by teachers, who grasp moments they could not themselves have envisaged, to capture, extend or clarify learning opportunities that have suddenly emerged. Such a culture is central to the 7
process of teaching mathematical modelling skills, where successive implementations even by the same teacher vary substantially in their detail. And this is to be celebrated even though it renders efforts to conduct controlled experiments highly questionable – the likelihood of replicating any genuine and substantial modelling program with respect to teacher activity is virtually zero. Hence our focus is located elsewhere – at the level of individuals learning and applying modelling skills in a TRTLE. In particular we aim to learn more about the critical points that represent transitions between phases in the solution process. These are represented by arrows in Figure 2, and refer respectively to movements from: 1. 2. 3. 4. 5. 6. 7.
Real world problem statement → Specification of a mathematical problem; Mathematical problem statement → Formulation of an approach to solution; Formulated approach → Complete solution of mathematics; Mathematical solution → Interpretation in the context of the model; Consequences of interpretation → Evaluation of the model quality; Evaluation of model → Second or higher review and refinement of model; Evaluation of model → Production of a report and recommendations.
We have chosen to focus on 1 - 4 in particular, noting that 1 and 2 have long been identified as among the most difficult phases of the entire process, and in fact act as gatekeepers to problem access. We therefore examine in detail how students approach and perform in these areas of transition, while learning modelling in an environment characterised by the interactions portrayed in Figure 1. The two tasks, Cunning Running and Shot on Goal, are the vehicles used to generate intensive data; collected by means of student scripts (24 and 28 respectively), videotaping of teacher and selected students, video and audiotaped records of small group collaborative activity, and selected post-task interviews (8 and 4 respectively). We seek to identify and document characteristic levels of performance; the occurrence or removal of blockages; the respective use of numerical, graphical, and algebraic approaches; quality of argumentation; and the respective interactions between modelling, mathematical content, and technology. The purpose is to enable an analysis of issues and activities impacting on 1 - 4 above, with implications for both the learning and teaching of introductory mathematical modelling at an intermediate stage of secondary education. As an additional dimension we note that a real-world approach to mathematical modelling means that new problems will continually be introduced as well as some tried and true favourites retained. Such problems must meet external (to the classroom) criteria of authenticity, so the question always occurs as to how they might best be structured pedagogically for student consumption. We recall that the Rasch approach to measurement simultaneously provides information on the ability level of students, and the difficulty level of items. By analogy we might argue that data from a new modelling task simultaneously provides information on student performance, and information on the suitability of task structure. That is a task can be reviewed and improved on the basis of student outcomes, and this pedagogical purpose is one with the potential to improve the structuring of modelling tasks. We therefore also look for kinds of evidence to systematically inform this purpose.
8
5. Task Implementation The first modelling task, Cunning Running, was undertaken in the fourth week of the school year. Previous learning experiences included the students’ first introduction to the use of LISTs operations on a graphical calculator, where students worked as a class through the solution of a contextualised task. The task involved investigating the area and dimensions of various sized square posters that could be hung in a square shop window, when restricted to hanging the poster by its corners from existing hooks at regular fixed intervals around the window frame. In this task numerical, graphing, and algebraic methods were used. The second modelling task, Shot on Goal, came two months after the first and there had not been a focus on graphical calculator use in the intervening time. Both tasks were undertaken over approximately a week of class time. 6. Examining Transitions As indicated above we are interested in transitions between stages of the modelling process, and in identifying blockages that impede students in moving between the stages. In Cunning Running the task required students to vary distances with the purpose of minimising the total distance run, while the Shot on Goal task involved looking at varying angles with the aim being to maximise the shot angle. Surface similarities of these tasks tend to obscure different levels of complexity in the respective formulations. 6.1 Real world problem statement to mathematical problem specification The challenge here is in identifying the key elements that will form the focus for model building. This involves: • Firstly deciding the nature of the element (what kind of mathematical entity) • Secondly identifying the specific element(s) to be focused on. Here the elements were a 'distance' in Cunning Running, and an 'angle' in Shot on Goal. Both these elements were compound entities in that they needed to be constructed from other components present in the real situation (line segments or angles). Blockages occurred, particularly in the second problem, and the blockage was only unlocked for some students, when the teacher provided a supporting physical demonstration in which class members either watched or participated, to help students clarify their thinking. This was followed by a debate by selected students using diagrams on the whiteboard about which angle was the focus. The physical enactment of the situation proved crucial for some students. Sandra: "Yeah, uh, it helped to explain like what we hoped to find out. Like I didn't really get what we were trying to do. And that kind of explained what angles we were trying to find."
While interpretation is an acknowledged component of the modelling process it is usually associated with giving meaning to a solution in its real world context. Interpretation in a different sense is seen here to be central in specifying a mathematical problem in the first place. No effort needs to be spared in ensuring that students receive a thorough appreciation of a problem context. This may involve direct experience, film or video, simulation, discussion and diagrammatic representation, or written description. Assuming that a mental representation will suffice is demonstrably suspect, and indeed 9
arguably inconsistent with the purpose of solving problems grounded in real situations. 6.2 Mathematical problem to formulation of a model Key decisions with the potential to generate blockages in this transition were identified along the following dimensions. • Deciding how to represent an identified element, so that known mathematical formulae could be applied (e.g. In SOG how to find the angle that had been identified – two different decomposition methods were available – see Figure 8.)
Figure 8. a) Di’s diagram and b) Sandra’s diagram to find the shot angle
• Choices involved in using technology to establish a calculation path. (e.g. In SOG inverse tan calculations provided an efficient means of obtaining the required angle - provided that the mathematics within the approach was understood.) • Choosing to use technology to automate extension of application of formulae to multiple cases (e.g., CR & SOG GC LISTs/spreadsheet). This required both technical facility with LISTs and/or Spreadsheet, and a strong grasp of the modelling requirements of the moment - recognising that generalisation via this activity was needed. • Recognising niceties associated with the specification of dependent and independent variables in algebraic models (e.g., CR & SOG) • Recognising that a particular independent variable must remain uniquely defined throughout an application. (e.g. In CR conflict occurred when ‘x’ was defined by some students as the distance from the station to corner A in one part of the formula, and from corner B in the other part.) • Recognising that a graph can be used on function graphers but not data plotters to verify an algebraic equation (e.g., CR verification method works on Graphical Calculator but not on a Spreadsheet) • Recognising when additional interim results are needed to enable progress (e.g. in attempting to place the 19th station in CR) • Introducing flawed problem data into the formulation phase. (e.g. two students took a stepped trajectory towards the goal, instead of advancing down a specified run line in 1 m intervals. • Selecting appropriate procedures when alternatives exist. (e.g. in CR most students drew an EXCEL scatterplot graph by joining numerical data generated by their graphical calculator LISTS facility; however a minority used formulae to generate the data - a fundamentally different approach)
10
6.3 From formulated approach to solution of mathematics As might be expected the interaction between mathematics and technology featured strongly. • Problems that occur as logical consequences of earlier errors in formulation. (e.g. approaches that gave different meanings to the same symbol, "x" in different parts of CR.) • Problems in applying formulae correctly (e.g. in SOG using inverse tan successfully to find angles) • Using technology to automate extensions of application of formulae to multiple cases (e.g. CR & SOG: GC LISTs/spreadsheet) • Using technology to produce a graphical representation (e.g., CR & SOG: GC Statplot, Function Graph or Spreadsheet Chart) • Applying algebraic simplification processes to symbolic formulae. (e.g. in CR & SOG, concatenation of GC LIST formulae to produce a two variable function) • Applying the rules of notational syntax accurately. • Using technology to verify an algebraic model. (e.g. CR & SOG: by producing a graph using a GC, or by substitution into a formula on the homescreen of a GC, or by entering a specific functional definition on a GC. • Reconciling unexpected interim results with real situation. (e.g. in SOG a student had incorrect expectations that the angle would continue to increase as the player advanced along the run line. He did not accept that his correct calculations were valid, and after debating with other students, was convinced only by another physical simulation of the activity (Figure 9).
Figure 9. Leo’s dilemma
6.4 From mathematical solution to interpretation within the model context. The following illustrate where student attempts at interpretation point to the occurrence of blockages, potential or actual. • Routine interpretations varied in depth from bald statements to integrated explanations (e.g. When asked in CR “Does running via station 1, or 2, or 3 make any difference to the overall length of the run?, students’ responses ranged from bald assertions such as, “It makes a difference,” to integrated arguments such as “Yes, it does the closer you are to corner A, the further the distance you have to run.”
11
• Interpretations in which the required outcome is amended to a variation introduced as the consequence of a preferred method of approach. (e.g. in finding the location of the station with shortest total run distance (CR), most students used their numerical lists to identify a particular station, rather than their graphs, which more legitimately provided the location of a minimum. The interpretation then referred to a station number rather than a location. While this did not matter here as the minimum was actually at station 14, it would be significant if the question was set so that the required station was in a position between others. • Differences in precision when numerical values are important. In describing the optimum position for a station (CR), most gave the station number they considered to involve minimum distance. One student added that it was " 3/4 between gate 1 and gate 2”, while another, seeing no need for any mathematical calculations at all simply asserted it was "towards the end" About 25% of students made no comment at all. • Tensions in deciding how knowledge of mathematics would actually impact on the real situation. (e.g. In CR – a number of students gave credit to the sixth runner as a mathematician who would know which station to run to – others said that in the heat of a race you wouldn’t really worry about distance, and just head for the 6th station. Meg’s response was typical, “If you were the sixth runner to reach gate 2 you would probably have [sic] travelled from Station 11. (That’s if the people in front know the fastest stations.)” On the other hand Kim argued “Most likely the sixth because you wouldn’t really think about the distance.”
• Choosing criteria to use in a later aspect of a task that requires interpretation to establish a method of approach. (e.g. In CR placement of the 19th station saw the use of various criteria – rather than applying the distance criterion (correct approach), some said it should follow 18th; some just put it 10 m from first or last station; while one student ignored all constraints, and put it on the straight line joining the gates. As an illustration, for Gary, the real world aspects were prominent. th
Gary [reading from his report during interview]: “A 19 station could be placed into the base line and achieve approximately the same running distance of 288.44 m by placing the th station 178.75 m from corner A.” Because my theory on trying to get the 19 gate [sic] … roughly the same distance as [station] 14. I thought a good race is a close race so I was thinking if you have the first two runners going to the same station round about it is going to be a closer race."
7. Reflections Analysis of responses to the two modelling tasks has focused on the transitions between stages in the modelling process. It is clear that there are many points in each transition that potentially pose blockages for students, and these give rise to many questions: What goes on as students try to specify a mathematical problem from the real world problem? What blocks them and what unblocks them on the path to identifying the problem as being to optimise an angle or a distance? Having obtained a problem statement, what occurs as students try to design an appropriate method of attack? Again, what blocks and unblocks them as they express the desired angle or distance in terms of other variables, set up a viable solution process, and decide whether and how technology will be 12
integrated into this process. How do students make key decisions such as in Shot on Goal as to which method of angle decomposition to use, or in Cunning Running whether to attack the problem from the station number or from the distance the station is from a corner of the field? In practice formulation slides into solving especially as errors sometimes lead to reformulations, so iterative loops occur. Once a mathematical approach has been formulated, what do students need to do to transform a viable approach into a solution? What prevents this transition occurring or slows its progress? It is necessary to carry out mathematical and calculator activities successfully to do this, so what prevents this happening - lack of mathematical knowledge general or specific? lack of calculator skills? technical expertise? accuracy? Having arrived at a mathematical solution, what are the blockages as students seek to make meaning of this in contextual terms - keeping in mind that the interpretation may be simple direct translation, or more demanding as in Cunning Running where it is needed to address another question - where to put the 19th station? What factors give rise to the hierarchies of quality found in interpretation? And what blockages result from mistakes in interpretation, overlooking where interpretation is necessary, providing superficial or irrelevant comments, and not seeing where interpretation is required for further progress to be made? Questions such as these will guide future project activity, as students engage with further problems. The intention is to search for a higher synthesis, using additional data to clarify and illustrate conceptual structures indicative of the transitional issues provisionally identified in this paper. 8. References Brown J (2005) ‘Affordances of a technology-rich teaching and learning environment’ in Clarkson P, Downton A, . Gronn D, Horne M, McDonough A, Pierce R, Roche A (Eds.) Building connections: Theory, research and practice. Proceedings of the 28th annual conference of the Mathematics Education Research Group of Australasia Sydney: MERGA,177- 184. Brown J P (2004) ‘Enabling teachers to perceive the affordances of a technologically rich learning environment for linear functions in order to design units of work incorporating best practice’ in Yang W-C, Chu A-C, de Alwis T, Ang K-C (Eds.) Technology in Mathematics: Engaging learners, empowering teachers, enabling researchers, Proceedings of the 9th Asian Technology Conference in Mathematics Blacksburg, VA: ATCM, 242-251. Collins A, Joesph D, Bielaczyc K (2004) ‘Design research: Theoretical and methodological issues’ Journal of the Learning Sciences 13(1), 15-42. Doerr H, Zangor R (2000) ‘Creating meaning for and with the graphing calculator’ Educational Studies in Mathematics 41(1), 143-163. Eade, R (2005) Courier Mail, May 11 p. 66. Edwards, D & Hamson, M. (1996). Mathematical Modelling Skills. London: Macmillan. Galbraith P, Clatworthy N (1990) ‘Beyond standard models—meeting the challenge of modelling’ Educational Studies in Mathematics 21, 137-163. Goldenberg E P (1990) ‘The difference between graphing software and educational graphing software’ in Zimmermann W, Cunningham S (Eds.) Visualisation in teaching and learning mathematics. MAA Notes 19 Washington, DC: Mathematical Association of America, 77-86. Goos M, Galbraith P, Renshaw P, Geiger V (2003) ‘Technology enriched classrooms: some implications for teaching applications and modelling’ in Ye Q-X, Blum W, Houston K Jiang, Q-Y (Eds.) Mathematical modelling in education and culture: ICTMA 10. Chichester: Horwood Publishing, 111-125. Edwards D, Hamson M (1996) Mathematical modelling skills. Basingstoke: Macmillan.
13
Julie C (2002) ‘Making relevance relevant in mathematics teacher education’ in Vakalis I, Hughes Hallett D, Quinney D, Kourouniotis C (Compilers) 2nd International Conference on the teaching of mathematics: ICTM-2 New York: Wiley [CD-ROM]. Povey H, Ransom M (2000) ‘Some undergraduate students' perceptions of using technology for mathematics: tales of resistance’ International Journal of Computers for Mathematical Learning 5(1), 47-63. Stillman G, Edwards I, Brown J (2004) ‘Mediating the cognitive demand of lessons in realworld settings’ in Tadich B, Tobias S, Brew C, Beatty B, Sullivan P (Eds.) Towards excellence in mathematics, Proceedings of the 41st Annual Conference of the Mathematical Association of Victoria Melbourne: MAV, 487-500.
14