INRA Theix, France) and Dr. F. Foufelle (Ho#pital St Vincent de Paul, Paris, France) .... 48 Thissen, J. P., Davenport, M. L., Pucilowska, J. B., Miles, M. V. and ...
147
Biochem. J. (1998) 334, 147–153 (Printed in Great Britain)
Physiological concentration of amino acids regulates insulin-like-growthfactor-binding protein 1 expression Ce! line JOUSSE, Alain BRUHAT, Marc FERRARA and Pierre FAFOURNOUX1 Unite! de Nutrition Cellulaire et Mole! culaire, INRA de Theix, 63122 Saint Gene' s Champanelle, France
Protein undernutrition is characterized by growth failure in young growing animals. Current evidence suggests that biosynthesis of insulin-like growth factor (IGF)-I and IGF-binding protein 1 (IGFBP-1) are key control points for nutritional regulation of growth. Here we examined the role of amino acid limitation in regulating the IGFBP-1 expression in the hepatic cell line. Our data show that leucine limitation strongly induces IGFBP-1 without affecting IGF-I and IGF-II expression in human HepG2 cells and in isolated rat hepatocytes. Depletion of arginine, cystine and all essential amino acids leads to induction of IGFBP-1 mRNA and protein expression in a dose-dependent manner. IGFBP-1 expression is significantly induced by leucine
concentration in the range of that observed in the blood of rats fed a low-protein diet or in humans affected by kwashiorkor. Moreover, treatment of HepG2 cells with amino acids at a concentration reproducing the amino acid concentration found in portal blood of rats fed a low-protein diet leads to a significantly higher expression of IGFBP-1. These data represent the first demonstration that an amino acid limitation, as occurs during dietary protein deficiency, induces IGFBP-1 expression in hepatic cells. Therefore, amino acids by themselves can play, in concert with hormones, an important role in the control of gene expression.
INTRODUCTION
post-natal periods and impaired development of organs such as the brain. Growth defect associated with protein malnutrition takes place in the presence of normal or elevated levels of growth hormone (GH) [20]. However, the circulating level of IGF-I is decreased, whereas IGFBP-1 expression is strongly increased, suggesting that IGF-I and IGFBP-1 are differentially regulated and may play an important role in the nutritional regulation of growth [21,22]. Strauss et al. [23] have reported a higher level of IGFBP-1 expression in protein-restricted animals than in starved animals. This difference could not be explained by a variation in the plasma level of glucose, insulin or GH. These authors suggested that other additional metabolic factors could be involved in IGFBP-1 gene regulation. They also showed that IGFBP-1 expression was induced in H4-II-E hepatoma cells deprived of an essential amino acid and hypothesized that amino acids by themselves could contribute to the regulation of IGFBP1 gene expression. In mammals, the plasma concentration of free amino acids is markedly affected by nutritional conditions [24–26] ; this is particularly evident in portal blood. Therefore liver cells are in contact with highly variable concentrations of amino acids. Although the control of mammalian gene expression by amino acids is still poorly documented, it has been shown that deprivation of a single essential amino acid causes a specific increase in mRNA abundance of certain genes, including c-myc, c-jun, ornithine decarboxylase [27], asparagine synthetase [28], the mammalian equivalent of ribosomal protein L-17 [29] and CHOP (also called gadd153) [30]. The induction of asparagine synthetase [28] and CHOP [31] genes by amino acid starvation involves both transcriptional and post-transcriptional mechanisms. In this report, we sought to determine whether amino acids can regulate IGFBP-1 expression, and especially whether a change in blood amino acid concentration, consecutive with a change in nutritional status, leads to a modification of IGFBP-
Protein undernutrition has its most devastating consequences during growth. Deficiency of any one or more of the essential amino acids, or a deficient protein intake, is characterized by negative nitrogen balance, weight loss and impaired growth in infants and children (kwashiorkor) [1]. Growth is controlled by the complex interaction of genetic, hormonal and nutritional factors. A large part of this control is due to the insulin-like growth factor (IGF) -I and -II [2–4]. IGFI and IGF-II are two polypeptides that are structurally related to proinsulin. They are produced by most tissues of the body, essentially the liver, and are abundant in the circulation. They have a broad array of biological activities, including stimulation of mitogenesis, differentiation and expression of differentiated functions. The biological activities of the IGFs are modulated by IGF-binding proteins (IGFBPs) that specifically bind IGF-I and IGF-II. Among the six IGFBPs identified [5], only IGFBP-1 displays rapid dynamic regulation in io with serum levels varying 10-fold or more in relation with food intake. Plasma IGFBP-1 is increased by fasting [6,7], malnutrition [8,9] and diabetes [10,11]. In cultured hepatocytes, IGFBP-1 expression is increased by treatment with dexamethasone and agents that raise intracellular levels of cAMP [12], and is lowered by insulin ([13], for a review see [14]). Although the function of IGFBP-1 is not completely defined, several studies demonstrate that IGFBP-1 inhibits IGF binding to cell-surface receptors and thereby modulates IGF-mediated mitogenic and cell-metabolic actions ([15] ; for a review see [14]). Using IGFBP-1 administration in rat [16] or transgenic mice over-expressing hepatic IGFBP-1 [17–19], it was shown that the IGFBP-1 level might modulate the hypoglycaemic activity of unbound IGFs in the circulation and suggest a role for IGFBP-1 in glucose counter-regulation. Moreover, these data show that permanent hepatic expression of IGFBP-1 leads to growth retardation during both ante- and
Abbreviations used : IGF, insulin-like growth factor ; IGFBP, insulin-like-growth-factor-binding protein ; GH, growth hormone ; DMEM/F12, Dulbecco’s modified Eagle’s medium F12 ; LPD, low-protein diet ; GAPDH, glyceraldehyde-3-phosphate dehydrogenase. 1 To whom correspondence should be addressed (e-mail fpierre!clermont.inra.fr).
148
C. Jousse and others
1 expression levels. Our data show that a limitation in one essential amino acid leads to induction of IGFBP-1 mRNA and protein. Moreover, an amino acid limitation, as occurring in protein-restricted animals, induces IGFBP-1 gene expression. These results demonstrate that, during malnutrition, amino acids can play an important role in the control of IGFBP-1 expression in concert with hormones.
different samples or loading errors, all blots were rehybridized with a DNA probe corresponding to 18 S RNA. Relative IGFBP1 mRNA was determined as the ratio of IGFBP-1 mRNA to 18 S RNA, and relative glyceraldehyde-3-phosphate dehydrogenase (GAPDH) mRNA was determined as the ratio of GAPDH mRNA to 18 S RNA.
cDNA probe MATERIALS AND METHODS Cell culture and treatment conditions Cells from the human hepatoma cell line HepG2 were cultured at 37 °C under 95 % air : 5 % CO in Dulbecco’s modified Eagle’s # medium F12 (DMEM}F12 ; Sigma) containing 10 % (v}v) fetal bovine serum. For amino acid starvation experiments, sub-confluent cells were washed twice with PBS and refed with a medium containing the indicated concentrations of amino acids supplemented with 10 % dialysed fetal bovine serum for the indicated time. Media containing various concentrations of leucine were made from DMEM}F12 medium devoid of methionine, leucine, lysine and glutamine (Sigma). Media starved of individual amino acids were made from DMEM}F12 medium free of amino acids (Gibco). The control medium was obtained by complementing the starved medium with the corresponding amino acids. Each amino acid was added at the concentration of that present in DMEM}F12. Media reproducing blood concentration of amino acids were made using DMEM}F12 medium free of amino acids. The concentrations of amino acids used to make the low-protein diet (LPD) medium and the control medium were as follows. (i) LPD medium ; Asp 20 µM, Thr 300 µM, Ser 300 µM, Glu 70 µM, Gly 300 µM, Ala 500 µM, Val 110 µM, Met 20 µM, Ile 60 µM, Leu 80 µM, Tyr 50 µM, Phe 40 µM, Lys 350 µM, His 70 µM, Arg 50 µM, Gln 600 µM, Asn 60 µM, Cystine 3 µM, Pro 350 µM, Trp 70 µM ; (ii) control medium ; Asp 20 µM, Thr 420 µM, Ser 300 µM, Glu 100 µM, Gly 250 µM, Ala 850 µM, Val 230 µM, Met 60 µM, Ile 90 µM, Leu 160 µM, Tyr 100 µM, Phe 60 µM, Lys 470 µM, His 100 µM, Arg 80 µM, Gln 550 µM, Asn 80 µM, Cystine 6.5 µM, Pro 700 µM, Trp 122 µM. Amino acids used were cell-culture tested (Sigma).
Primary hepatocyte culture Primary hepatocytes were prepared from male Fisher rats (about 180 g) using the collagenase perfusion method of Berry and Friend [32]. During a 4 h attachment period, cells were maintained in William Medium E containing 10 % fetal bovine serum supplemented with 1 µM dexamethasone and 1 µM insulin at a density of 2.5¬10' cells}60 mm culture dish (Falcon). Cells were then washed with PBS and refed with a DMEM}F12 medium with or without leucine for 24 or 48 h in the presence of 1 µM dexamethasone and 1 µM insulin.
RNA isolation and Northern-blot analysis Total RNA was prepared as described previously [33]. Northern blots were performed according to the procedure of Sambrook et al. [34]. RNA was cross-linked to the membrane by UV irradiation and then prehybridization was carried out for 2 h at 42 °C in 35 % formamide}6¬SSC (0.15 M NaCl}0.015 M sodium citrate)}5¬Denhardt’s reagent}0.5 % SDS. Hybridization was carried out for 16 h at 42 °C. The membranes were washed twice at 42 °C in 2¬SSC plus 0.1 % SDS for 15 min. Labelled bands were visualized and quantified using a PhosphofluoroImager (Molecular Dynamics) and the IMAGEQUANT software. To control for either variation in the amount of RNA in
The human IGFBP-1 cDNA was generously provided by Dr. Powell and Dr. Suwanichkul (Baylor College of Medicine, Houston, TX, U.S.A.). A gel-purified EcoRI fragment was used as a probe. The rat IGFBP-1 cDNA was generously provided by Dr. G. T. Ooi (National Institute of Diabetes and Digestive and Kidney Diseases, Bethesda, MD, U.S.A.). A gel-purified EcoRI} ApaI fragment (642 bp) was used as a probe. The human IGFII cDNA was generously provided by Dr. Y. Le Bouc and S. Babajko (Ho# pital Saint-Antoine, INSERM U142, Paris, France). A gel-purified EcoRI (663 bp) fragment was used as a probe. The cDNA probes were labelled by random priming with [α-$#P]dCTP [Ready-To-Go2 DNA Labelling Beads (-dCTP) by Pharmacia Biotech].
Immunoblot analysis Proteins from 15 µl of culture medium were separated by SDS}PAGE on a 12 % (w}v) polyacrylamide gel and electrophoretically transferred to a membrane in 25 mM Tris}190 mM glycine. IGFBP-1 protein was detected in F. Cavaille’s laboratory (INSERM U142, Ho# pital Saint-Antoine, Paris, France). Membranes were blocked for 1 h at 37 °C with a solution of 5 % nonfat milk powder in TN [50 mM Tris}HCl (pH 8.0)}150 mM NaCl]. The blots were then incubated with the anti-IGFBP-1 antibody (1 : 500) in blocking solution overnight at 4 °C then washed four times in TN containing 0.05 % Triton X-100, and incubated with horseradish peroxidase-conjugated goat antirabbit IgG (1 : 1000) in blocking buffer for 1 h at room temperature. After five washes the blots were developed using the enhanced chemiluminescence (ECL) detection system (Amersham). The quantification was performed after scanning of the film using the NIH IMAGE software.
Reverse transcription and PCR amplification Cellular RNA (2 µg) was reverse transcribed in 20 µl of reaction mixture containing 200 units of Superscript (Gibco BRL) reverse transcriptase and 3.3 µM of random hexanucleotide primers (Gibco BRL). Comparative kinetic analysis of PCR products has been used to accurately detect changes in mRNA levels between two samples [35,36]. PCR was performed using 2 µl of cDNA preparation with reactions carried out for 18, 20 and 22 cycles of 94 °C denaturation for 20 s, 58 °C annealing for 20 s and 72 °C elongation for 20 s. Primers used to amplify murine IGF-I were 5«-CTTCACATCTCTTCTACCTGGC-3« and 5«-CTTCTGAGTCTTGGGCATGTC-3« and yield a PCR product of 317 bp in size. To control for RNA quality and cDNA synthesis, GAPDH mRNA was also amplified (349 bp product). Primers used to amplify GAPDH were 5«-GCTGCCAAGGCTGTGGGCAAGG-3« and 5«-ATGAGGTCCACCACCCTGTTGC-3«. The PCR products were separated by electrophoresis on a 3 % agarose gel, stained with SYBR Gold (Molecular Probe) and quantified using a Phosphofluoro-Imager and the IMAGEQUANT software. Quantitative analysis of the electrophoretically isolated PCR products showed exponential expansion over the range of 18–22 cycles, as indicated by the linearity of the
Regulation of insulin-like-growth-factor-binding protein 1 expression
149
semi-logarithmic plot of fluorescence of the band versus cycle number (results not shown). Results were calculated as the ratio of IGF-I to GAPDH values at the y intercept [35,36].
RESULTS Induction of IGFBP-1 mRNA and protein expression by leucine limitation To understand the role of amino acids on IGFBP-1 expression, we have studied the effect of leucine limitation on IGFBP-1 mRNA and protein content in HepG2 cells. We chose leucine because : (i) leucine is an essential amino acid that was poorly utilized by the cells during a 16 h incubation period (results not shown) ; and (ii) leucine, which is transported by system L, is rapidly equilibrated through the cell membrane. To test the possibility that leucine concentration can influence IGFBP-1 expression, HepG2 cells were incubated for 16 h in medium containing different concentrations of leucine. As shown in Figure 1(A), IGFBP-1 mRNA levels were low in control medium
Figure 2 Effect of leucine limitation on IGFBP-1 expression in primary culture of rat hepatocytes Primary culture of rat hepatocytes were incubated for 24 or 48 h in DMEM/F12 (leu) or in DMEM/F12 lacking leucine (®leu) and harvested for RNA isolation. Northern-blot analysis was performed as described in the Materials and methods section. The blot was hybridized with rat IGFBP-1 and GAPDH probes.
Figure 3 Induction and reversal of IGFBP-1 expression by leucine starvation Figure 1 The effect of leucine concentration on expression of IGFBP-1 mRNA and protein HepG2 cells were incubated for 16 h in DMEM/F12 containing the indicated leucine concentration. The leucine concentration in the DMEM/F12 control medium was 420 µM. (A) Total RNA was extracted, and Northern-blot analysis was performed as described in the Materials and methods section. The blot was hybridized with a probe corresponding to human IGFBP-1. The IGFBP-1 mRNA migrates as a single 1 kb transcript. The same membrane was rehybridized with an 18 S probe to normalize for RNA loading. (B) Culture medium (15 µl) was analysed for the presence of IGFBP-1 protein. Western-blot analysis was performed as described in the Materials and methods section. (C) The quantification of the above-mentioned data was performed as described in the Materials and methods section. Each value represents the mean of 3 independent experiments.
(A) HepG2 cells were incubated in DMEM/F12 (leu) or in DMEM/F12 lacking leucine (®leu) and harvested for RNA isolation after the indicated incubation times. (B) Following 16 h of leucine starvation, 420 µM leucine was added to the culture medium, then cells were harvested at the indicated times for RNA isolation. Northern-blot analysis was performed as described in the Materials and methods section. The blots were hybridized with human IGFBP1 and 18 S probes. Quantification of the Northern blots is given graphically, below the respective panels. Each value represents the mean of 2 independent experiments.
containing 420 µM leucine and were inversely proportional to the leucine concentration in the medium, ranging from 8- to 12-fold over the control value. Figure 1(B) shows that the IGFBP-1
150
Figure 4
C. Jousse and others
Effect of cycloheximide on IGFBP-1 induction by leucine starvation
HepG2 cells were incubated in DMEM/F12 ( leu) or in DMEM/F12 lacking leucine (®leu), with or without cycloheximide (CHX). After the indicated incubation times, cells were harvested for RNA isolation. Northern-blot analysis was performed as described in the Materials and methods section. The blots were hybridized with a human IGFBP-1 probe and rehybridized with an 18 S probe to normalize for RNA loading (top panel). A quantification of the data obtained is shown in the bottom panel. Each value represents the mean of 2 independent experiments.
protein level, determined by Western blotting, was dramatically increased when the leucine concentration decreased in the culture medium, following what was observed for its corresponding mRNA (Figure 1C). These results indicate that the expression of IGFBP-1 mRNA and protein, in human HepG2 cells, is regulated in response to changes in leucine concentration. The lowest plasma leucine concentration (in the range of 50–60 µM) is found in the blood of rats fed an LPD [24,37,38]. The highest plasma leucine concentration (approximately 500 µM) is found during the absorptive period of the nycthemere of rats fed a high-protein diet [24]. These data show that IGFBP-1 expression is significantly induced at leucine concentrations in the range of those observed in blood of protein-restricted animals. To determine whether the induction of IGFBP-1 expression by leucine occurs in more differentiated cells than in the hepatocellular carcinoma cell line, we investigated the amino acid regulation of IGFBP-1 in isolated liver cells. As shown in Figure 2, the IGFBP-1 mRNA level is increased in response to leucine starvation to the same magnitude as that observed in HepG2 cells. These results show that amino acid regulation of IGFBP1 is not confined to hepatoma cells and occurs in well-differentiated isolated hepatocytes.
Figure 5 Effect of individual amino acid starvation on IGFBP-1 mRNA expression (A) HepG2 cells were incubated for 16 h in medium lacking one amino acid. Total RNA was extracted, and Northern-blot analysis was performed. The blot was hybridized with a probe corresponding to human IGFBP-1, then rehybridized with an 18 S probe. (B) The data were quantified and normalized as described in the Materials and methods section. Each value represents the mean of 2 independent experiments.
the culture medium. Figure 3(B) shows that leucine addition results in a rapid loss of IGFBP-1 mRNA content, with levels declining by over 90 % in the 4 h following the addition of leucine.
Role of protein synthesis in the regulation of IGFBP-1 expression by leucine starvation To assess the importance of protein synthesis to the increase in IGFBP-1 mRNA expression during leucine starvation, cells were simultaneously deprived of leucine and treated with cycloheximide for 6, 8 and 10 h. Treatment with high cycloheximide concentration (2 µg}ml) totally inhibited protein synthesis, whereas treatment with low cycloheximide concentration resulted in a partial (approx. 50 %) protein synthesis inhibition (results not shown). As shown in Figure 4, cycloheximide, at any concentration tested, totally abolished the accumulation of IGFBP-1 mRNA. These results indicate that the increase in IGFBP-1 mRNA during leucine starvation is dependent on de noo protein synthesis.
Time-course analysis of IGFBP-1 regulation by amino acids A time-course analysis of IGFBP-1 mRNA levels in HepG2 cells exposed to medium lacking leucine indicated that mRNA was detectable 6 h after starvation and that a maximum level was reached after 24 h (Figure 3A). To determine whether the induction of IGFBP-1 expression by leucine starvation is reversible by leucine replenishment, cells were first incubated for 16 h in leucine-free medium ; then 420 µM leucine was added to
Specificity of the amino acid-dependent control of IGFBP-1 mRNA To better characterize the amino acid-dependent regulation of IGFBP-1 mRNA, HepG2 cells were transferred to a complete medium or medium deficient in a single amino acid. RNA was isolated at 16 h to assay the IGFBP-1 and 18 S mRNA content. The level of IGFBP-1 mRNA was significantly increased in response to starvation of 11 amino acids : leucine, arginine,
Regulation of insulin-like-growth-factor-binding protein 1 expression
Figure 7
Figure 6 Effect of amino acid concentrations reproducing the liver afferent blood concentration of amino acids in rats fed an LPD or a control diet HepG2 cells were incubated for 16 h in medium containing a liver afferent blood amino acid concentration corresponding to rats fed with an LPD or a standard (C) diet. The amino acid concentrations are given in the Materials and methods section. (A) Total RNA was extracted, and Northern-blot analysis was performed as described in the Materials and methods section. The blots were successively hybridized with a labelled probe corresponding to human IGFBP1, GAPDH and 18 S. (B) After quantification and normalization, results are given as percentages of IGFBP-1 or GAPDH expression in LPD medium. The error bars represent the S.D.s from the means of 3 independent experiments. Statistical differences were assessed by using the Student’s t test (n & 6).
valine, isoleucine, methionine, phenylalanine, threonine, histidine, tryptophan, lysine and cystine (Figure 5). Depletion of phenylalanine (10-fold increase), cystine, methionine, valine and leucine (about 8-fold increase) resulted in the greatest increase in IGFBP-1 mRNA. Most of these amino acids are essential, with the exceptions of arginine, which can be synthesized in hepatic cells by the urea cycle, and cystine, which can be synthesized from methionine. Starvation of other non-essential amino acids does not significantly induce IGFBP-1 mRNA expression.
Amino acid concentrations corresponding to physiological concentration modify the IGFBP-1 mRNA level To determine whether the amino acid-dependent regulation of IGFBP-1 mRNA occurred at physiological amino acid levels, HepG2 cells were incubated in a medium reproducing amino acid concentrations measured in the liver afferent blood of rats fed either an LPD or a control diet. The amino acid concentrations used in this experiment are given in the Materials and methods section. Plasma afferent concentrations of amino acids in rats fed an LPD are the average of data from Fafournoux et al. [24], Leung et al. [38], Moundras et al. [39] and Munro et al. [40]. Plasma afferent concentrations of amino acids in rats fed a control diet come from Fafournoux et al. [24]. The concentration of most of the amino acids increased in parallel with food protein
151
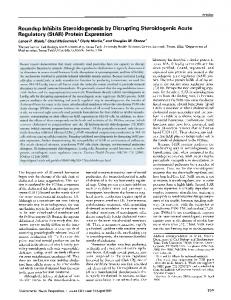
Effect of leucine limitation on IGF-II expression in HepG2 cells
Cells were incubated for 16 h in DMEM/F12 (leu) or in DMEM/F12 lacking leucine (®leu) and harvested for RNA isolation. Northern-blot analysis was performed as described in the Materials and methods section. The blot was hybridized with a human IGFBP-1 probe (top panel), a human IGF-II probe (middle panel) and a GAPDH probe (bottom panel). The histogram represents the quantification of the 5.3 kb IGF-II mRNA normalized with GAPDH.
content, particularly essential amino acids and glucogenic amino acids. HepG2 cells were incubated for 16 h in an LPD or control medium and then RNA was isolated to assay IGFBP-1, GAPDH and 18 S mRNA contents (Figure 6A). Relative IGFBP-1 and GAPDH mRNA were determined as the ratio of the mRNA to 18 S RNA, as described in the Materials and methods section. The control data are given as percentage of the LPD value. As shown in Figure 6(B), the IGFBP-1 mRNA level was increased significantly by approx. 1.8-fold when cells were incubated in LPD versus control medium. In the same conditions, GAPDH mRNA content was not affected by alterations in amino acid concentrations in the culture medium. These results indicate that a change in amino acid concentrations corresponding to a change in the nutritional status can regulate IGFBP-1 mRNA expression.
The response of IGFBP-1 to amino acid limitation is not accompanied by changes in the amounts of IGF-I and IGF-II It has been shown that IGF-I, IGF-II and IGFBP-1 expression are differentially regulated in response to malnutrition [17,18]. The abundance of the hepatic IGF-I and IGF-II mRNA is decreased in young rats fed an LPD whereas IGFBP-1 expression is dramatically increased. To assess the role of amino acids in the hepatic IGF regulation, cellular IGF-I and IGF-II mRNA content was measured in response to leucine starvation. The human IGF-II gene consists of eight exons that are transcribed and processed into three different mRNA species, which share common coding and 3«-untranslated regions [41]. As shown in Figure 7, in HepG2 cells, the amounts of the two predominant human IGF-II mRNAs of 6.0 and 5.3 kb are not significantly affected by leucine starvation.
152
C. Jousse and others
Figure 8 Effect of leucine limitation on IGF-I expression in primary culture of rat hepatocytes mRNAs used were those obtained in the experiment described in Figure 2. Briefly, primary culture of rat hepatocytes were incubated in DMEM/F12 (leu) or in DMEM/F12 lacking leucine (®leu) and harvested for RNA isolation. After reverse transcription, IGF-I (317 bp fragment) and GAPDH (349 bp fragment) were amplified as described in the Materials and methods section. (A) The PCR product for the analysis of one typical experiment. (B) The histogram represents the quantification of several independant experiments (n ¯ 4) as described in the Materials and methods section.
Like IGF-II, the IGF-I gene is transcribed and processed into several mRNA species in human and in rat [41]. In human HepG2, IGF-I mRNAs were not detectable in a Northern blot (result not shown), probably due to the low level of IGF-I expression. Therefore, the relative amounts of IGF-I mRNA were estimated in primary culture of rat liver cells using reverse transcriptase PCR. We designed oligonucleotides in exons 2 and 3, which are common to all rat IGF-I mRNA species [41]. Figure 8 shows that IGF-I expression levels are not significantly affected in cells incubated in a leucine-free medium.
DISCUSSION In protein-restricted animals it has been shown that the high IGFBP-1 expression levels cannot be explained entirely by a variation in the plasma level of glucose, insulin or GH [23]. These authors have hypothesized that amino acids by themselves could be involved in the higher induction of IGFBP-1 by protein restriction. The experiments reported in this paper were designed to investigate the role of amino acids in the control of IGFBP1 gene expression, the major goal being to determine whether a change in amino acid concentration, corresponding to a change in the nutritional status, can regulate IGFBP-1 expression. The two major sites of synthesis of IGFBP-1 in post-natal animals are liver and kidney. As liver is the source of most of the IGFBP-1 in blood [42,43], and because amino acid concentration is markedly affected by nutritional condition in the portal blood, it was of interest to examine the regulation of hepatic IGFBP-1 by amino acids.We have shown that IGFBP-1 regulation by leucine limitation occurs in well-differentiated isolated hepatocytes, as well as in the hepatoma cell line HepG2 (Figure 2) and the
H4-II-E cell line [23]. Therefore, HepG2 cells constitute a good model to study amino acid regulation of IGFBP-1 expression. To characterize the role of amino acids in the control of IGFBP-1 expression we have tested the effects of individual amino acid depletion on hepatic IGFBP-1 mRNA. Our results show that depletion of arginine, cystine and all essential amino acids significantly affects IGFBP-1 mRNA levels in a human hepatoma cell line, HepG2. It is noticeable that amino acids whose concentrations are affected by nutritional status [24] are those that play a major role in the control of IGFBP-1. Starvation of most of the non-essential amino acids fails to induce IGFBP-1 expression. These data are consistent with two hypotheses : (i) the intracellular concentration of non-essential amino acids is not depleted enough to allow IGFBP-1 induction ; and (ii) the regulatory mechanism of IGFBP-1 expression is specific to certain amino acids. Several results favour the second hypothesis. First, depletion of two non-essential amino acids, arginine and cystine, can significantly induce IGFBP-1 mRNA expression. Secondly, we reproduced an amino acid starvation using alcohol derivatives of amino acids, which inhibit the corresponding tRNA synthetase, and we have shown that alaninol treatment is not able to induce IGFBP-1 expression, whereas leucinol and histidinol treatments induce IGFBP-1 expression (results not shown). Similar results were obtained for the regulation of asparagine synthetase [44]. The induction of IGFBP-1 mRNA and protein in response to leucine limitation was observed for concentrations ranging from 0 to 70 µM. Similarly, IGFBP-1 expression was significantly induced for partial methionine or arginine depletion in the range of 20 and 50 µM, respectively (results not shown). These concentrations are of the same magnitude as those observed in the blood of rats fed an LPD [24,38]. All together, these results show that amino acids by themselves participate in IGFBP-1 gene regulation. A change in the nutritional status leads to a modification in blood concentration of most amino acids. However, the variation in concentration differs for individual amino acids. In order to determine whether a change in amino acid concentration corresponding to a change in the nutritional status can modify IGFBP-1 expression, we reconstituted a culture medium reproducing the amino acid concentration found in the portal blood of animals subjected to various diets. Amino acid concentrations reproducing portal blood of rats fed an LPD lead to a significantly higher expression of IGFBP-1. In these experiments, the culture-medium concentrations of other components involved in IGFBP-1 regulation were not changed. Particularly, the glucose concentration was kept at a high level (4 g}l), whereas insulin was kept at low levels. These data show that amino acid concentrations reproducing nutritional situations can significantly modify IGFBP-1 gene expression. In humans, plasma amino acid profiles have been shown to be altered in cases of malnutrition. For example, an amino acid profile alteration has been reported when there is a deficiency of any one or more of the essential amino acids, a dietary imbalance of amino acids or an insufficient intake of protein. Moreover, malnutrition is often associated with high levels of infection and infestation. Therefore, the pattern of amino acids in the plasma of subjects with malnutrition is also influenced by the effects of infection and loss of appetite [45]. In such a situation, the plasma concentration of certain essential amino acids can be dramatically lowered ; for example, leucine and methionine concentrations are reduced to 20 and 5 µM, respectively, in plasma of children affected by kwashiorkor [46,47]. Therefore, in the case of malnutrition, amino acids by themselves play an important role in the regulation of IGFBP-1 expression.
Regulation of insulin-like-growth-factor-binding protein 1 expression Nutritional status is also an important regulator of the IGFI and IGF-II [9]. In rat, expression of IGFs is decreased by specific protein restriction, whereas IGFBP-1 expression is strongly increased [9,23]. Very little is known about molecular mechanisms involved in the nutritional regulation of blood IGFs. In the present study we show that amino acid limitation does not decrease hepatic IGF-I and IGF-II expression. However, in animals fed an LPD, the clearance rate of IGF-I is increased [48]. According to Thissen et al. [48] this increase might be caused by an increase in the fraction of IGF-I complexed with IGFBP1. Our results suggest that, in protein-restricted animals, amino acid limitation could be one of the regulators of IGFBP-1 expression. Consequently, IGFBP-1 could regulate the biological activities of the IGFs and, finally, could be involved in the regulation of animal growth. Our results show that amino acids can co-operate with glucose, GH and insulin to regulate IGFBP-1 gene expression. These data represent the first demonstration that a shortage of amino acids, as occurs in protein-restricted animals, induces IGFBP-1 mRNA and in this fashion participates in the regulation of growth. Further studies will be necessary to know the molecular mechanisms involved in the regulation of IGFBP-1 gene expression by amino acids. The molecular basis for gene regulation by dietary protein intake is important with respect to growth regulation of young individuals living under conditions of restricted or excessive food intake. We thank Dr. Powell and Dr. Suwanichkul (Baylor College of Medicine, Houston, TX, U.S.A.) for providing the human IGFBP-1 cDNA plasmid, Dr. G. T. Ooi (National Institute of Diabetes and Digestive and Kidney Diseases, Bethesda, MD, U.S.A.), Dr. F. Cavaille! (INSERM U142, Ho# pital St Antoine, Paris, France) for IGFBP-1 protein detection, Dr. S. Babajko and Dr. Y. Le Bouc (Ho# pital St Antoine, Paris, France) for providing IGF-I and IGF-II cDNA plasmid, and Dr. C. Morand, Dr. C. Besson (U3M, INRA Theix, France) and Dr. F. Foufelle (Ho# pital St Vincent de Paul, Paris, France) for rat hepatocyte isolation. We thank Dr. P. Brachet, Dr. C. Demigne! , Dr. F. Mc Kenzie, Dr. S. Mordier, Dr. P. Patureau-Mirand and Dr. C. Re! me! sy for critically reading the manuscript and for helpful discussions. This work was supported by grants from the Institut National de la Recherche Agronomique and the Fondation pour la Recherche Me! dicale. C.J. is a recipient of a French M.E.N.S.R. pre-doctoral scholarship and A.B. is supported by a fellowship from the Socie! te! de Secours des Amis des Sciences.
REFERENCES Albanese, A. A. (1952) J. Clin. Nutr. 1, 44–51 Baker, J., Liu, J. P., Robertson, E. J. and Efstratiadis, A. (1993) Cell 75, 73–82 Binoux, M. (1995) Diabetes Metab. 21, 330–337 Rechler, M. M. and Nissley, S. P. (1990) in Handbook of Experimental Pharmacology (Sporn, M. B. and Robert, A. B., eds.), pp. 263–367, Springer-Verlag, Berlin 5 Shimasaki, S. and Ling, N. (1991) Prog. Growth Factor Res. 3, 243–266 6 Busby, W. H., Snyder, D. K. and Clemmons, D. R. (1988) J. Clin. Endocrinol. Metab. 67, 11225–11230 7 Cotterill, A. M., Cowell, C. T., Baxter, R. C., McNeil, D. and Silinik, M. (1988) J. Clin. Endocrinol. Metab. 67, 882–887 8 Donovan, S. M., Atilano, L. C., Hintz, R. L., Wilson, D. M. and Rosenfeld, R. G. (1991) Endocrinology 129, 149–157 9 Straus, D. S. and Takemoto, C. D. (1990) Endocrinology 127, 1849–1860 10 Brismar, K., Gutniak, M., Povoa, G., Werner, S. and Hall, K. (1988) J. Endocrinol. Invest. 11, 599–602 1 2 3 4
Received 1 December 1997/29 April 1998 ; accepted 10 June 1998
153
11 Suikkari, A.-M., Koivisto, V. A., Rutanen, E.-M., Yki-Ja$ rvinen, H., Karonen, S. L. and Seppa$ la$ , M. (1988) J. Clin. Endocrinol. Metab. 66, 266–272 12 Suwanichkul, A., DePaolis, L. A., Lee, P. D. K. and Powell, D. R. (1993) J. Biol. Chem. 268, 9730–9736 13 Ooi, G. T., Orlowski, C. C., Brown, A. L., Becker, R. E., Unterman, T. G. and Rechler, M. M. (1990) Mol. Endocrinol. 4, 321–328 14 Lee, P. D. K., Conover, C. A. and Powell, D. R. (1993) Proc. Soc. Exp. Biol. Med. 204, 4–29 15 Walton, P. E., Dunshea, F. R. and Ballard, F. J. (1995) Prog. Growth Factor Res. 6, 385–395 16 Lewitt, M. S., Denyer, G. S., Cooney, G. J. and Baxter, R. C. (1991) Endocrinology 129, 2254–2256 17 Rajkumar, K., Barron, D., Lewitt, M. S. and Murphy, L. J. (1995) Endocrinology 136, 4029–4034 18 Rajkumar, K., Krsek, M., Dheen, S. T. and Murphy, L. J. (1996) J. Clin. Invest. 98, 1818–1825 19 Gay, E., Seurin, D., Babajko, S., Doublier, S., Cazillis, M. and Binoux, M. (1997) Endocrinology 138, 2937–2947 20 Vance, M. L., Hartman, M. L. and Thorner, M. O. (1992) Horm. Res. 38, 85–88 21 Kita, K., Tomas, F. M., Owens, P. C., Knowles, S. E., Forbes, B. E., Upton, Z., Hughes, R. and Ballard, F. J. (1996) J. Endocrinol. 149, 181–190 22 Straus, D. S. (1994) FASEB. J. 8, 6–12 23 Straus, D. S., Burke, E. J. and Marten, N. W. (1993) Endocrinology 132, 1090–1100 24 Fafournoux, P., Remesy, C. and Demigne, C. (1990) Am. J. Physiol. 259, E614–E625 25 Ozalp, I., Young, V. R., Nagchaudhuri, J., Tontisirin, K. and Scrimshaw, N. S. (1972) J. Nutr. 102, 1147–1158 26 Peng, Y. and Harper, A. E. (1970) J. Nutr. 100, 429–437 27 Pohjanpelto, P. and Ho$ ltta$ , E. (1990) Mol. Cell. Biol. 10, 5814–5821 28 Guerrini, L., Gong, S. S., Mangasarian, K. and Basilico, C. (1993) Mol. Cell Biol. 13, 3202–3212 29 Laine, R. O., Shay, N. F. and Kilberg, M. S. (1994) J. Biol. Chem. 269, 9693–9697 30 Marten, N. W., Burke, E. J. M., Hayden, J. and Straus, D. S. (1994) FASEB J. 8, 538–544 31 Bruhat, A., Jousse, C., Wang, X-Z., Ron, D., Ferrara, M. and Fafournoux, P. (1997) J. Biol. Chem. 272, 17588–17593 32 Berry, M. N. and Friend, D. S. (1969) J. Cell Biol. 43, 1485–1490 33 Chomczynski, P. and Sacchi, N. (1987) Anal. Biochem. 162, 156–159 34 Sambrook, J., Fritsch, E. F. and Maniatis, T. (1989) in Molecular Cloning, a Laboratory Manual, 2nd edn., pp. 7–46, Cold Spring Harbor Press, Cold Spring Harbor 35 Salomon, R. N., Underwood, R., Doyle, M. V., Wang, A. and Libby, P. (1992) Proc. Natl. Acad. Sci. U.S.A. 89, 2814–2818 36 Dallman, M. J., Montgomery, R. A., Larsen, C. P., Wanders, A. and Wells, A. F. (1991) Immunol. Rev. 119, 163–179 37 Gomez-Angelats, M., Ruiz-Montasell, B., Felipe, A., Marin, J. J., Casado, F. J. and Pastor-Anglada, M. (1995) Am. J. Physiol. 268, E368–E374 38 Leung, P.M-B., Rogers, G. R. and Harper, A. E. (1969) J. Nutr. 96, 303–318 39 Moundras, C., Remesy, C. and Demigne, C. (1993) Am. J. Physiol. G1057–G1065 40 Munro, H. N. (1968) in Mammalian Protein Metabolism (Munro, H. N., ed.), pp. 299–375, Academic Press, New York 41 Daughaday, W. H. and Rotwein, P. (1989) Endocr. Rev. 10, 68–91 42 Murphy, L. J., Seneviratne, C., Ballejo, G., Groze, F. and Kennedy, T. G. (1990) Mol. Endocrinol. 4, 329–336 43 Mohn, K. L., Melby, A. E., Tewari, D. S., Laz, T. M. and Taub, R. (1991) Mol. Cell Biol. 11, 1393–1401 44 Hutson, R. G. and Kilberg, M. S. (1994) Biochem. J. 304, 745–750 45 Jackson, A. A. and Grimble, R. F. (1990) in The Malnourished Child, vol. 19 (Suskind, R. M. and Suskind, L. L., eds.), Nestle Nutrition Workshop Series, Nestle Ltd., Vevey Raven Press 46 Baertl, J. M., Placko, R. P. and Graham, G. G. (1974) Am. J. Clin. Nutr. 27, 733–742 47 Grimble, R. F. and Whitehead, R. G. (1970) Lancet i, 918–920 48 Thissen, J. P., Davenport, M. L., Pucilowska, J. B., Miles, M. V. and Underwood, L. E. (1992) Am. J. Physiol. 262, E406–E411