Services within the context of mobile data service ... complex data services, namely Mobile Commerce. ... In the 3-tier Mobile model, as adopted in South. African ...
Information Management in Modern Enterprise: Issues & Solutions 477
Factors Affecting the Adoption of Mobile Content Services amongst Youth in the Western Cape, South Africa Clint Gilham; University of Cape Town; South Africa; Jean-Paul Van Belle; University of Cape Town; South Africa;
Abstract This paper presents an analysis of Mobile Content Services within the context of mobile data service provision and mobile phone usage. The focus is on understanding mobile phone user behaviour more specifically amongst the youth in the Western Cape Province of South Africa. The main theme in this paper is the notion that Mobile Content Services usage is the gateway to understanding, implementing and the eventual success of more complex data services, namely Mobile Commerce. The study tests a model called the Innovation Diffusion Theory (IDT). The model identifies factors (constructs) that impact on the intent to use Mobile Content Services amongst the youth. These constructs includes Relative Advantage, Compatibility, Complexity, Trialability, Observability, Image, Voluntariness and Cost. Key words: Mobile Technology, Mobile Content Services, Mobile Commerce, Diffusion of Innovation Theory, Technology Acceptance Model. 1. Introduction The phenomenon of mobility and connectivity, expressed through choice and control, attributes to the ultimate cell phone user experience [1]. By extension, Mobile Commerce (also known as MCommerce) has the potential for associated mobile technologies to change mobile phone usage. Earlier predictions exemplifying the ubiquity of Mobile Commerce have however not materialized [2] [3]. One clear observation that supports this has been that the rate of adoption of M-Commerce has not kept pace with the rate of adoption of the mobile handset commonly referred to as a cell phone [4]. Studies also suggest an innate hype surrounding MCommerce, which has been compounded by a lack of empirical research, making such predictions lack justification [1] [2]. One other influential factor impacting on use and adoption of mobile data services has been manufacturers' perceptions. Manufacturers produce cell phones based on their abstract conceptions of what the general mobile user might value or desire [3]. They proceed to explain that what manufacturers appear to be missing is a clear understanding of the motivations and circumstances surrounding mobile device use and adoption from the perspective of consumers.
2. Key Concepts M-Commerce This study adheres to the notion that m-commerce is not the internet rendered accessible from a mobile handset. Indeed the richness and connectivity steered by a powerful network technology available in PCs is currently neither substitutable nor replaceable by the handset [5]. The mobile market is at a crucial point in its evolution (high voice/data capacity and speed), bit the promises of all these technology goodies cannot be realised without an underpinning widespread acceptance [6]. Pale et al [7] extrapolate this idea further and implores future mobile technology usage to be a dominant feature of culture. The theme of this study therefore centres on the social progress and relates mobile technology usage as an advancement steered by user perception. Mobile Content Services (MCS) The terms Mobile Content Service, Mobile Data Services and Mobile Applications have often been used interchangeably by various authors. This study has confined itself with the services that primarily provide entertainment and information via cell phones for instance, the conventional and polyphonic ring tones, logos, music, games, dating services etc. It is worth while to note that newer technologies like the Global System for Mobile Communications (GSM) over the General Packet Radio Switching (GPRS) have not lived up to their expectations. GPRS while enhancing GSM from a 2nd generation (2G) Mobile technology to a more advanced 2.5 generation (2.5G) network standard has not met expectations. The same may be said of the more technologically robust Wireless Application Protocol (WAP), a standard meant to cater for the savvier cell phone internet browsing public. Mobile Bearer Services (MBS) The term describes technologies that enable conveyance of information across the mobile network. The technologies include both Short Message Services (SMS) and the Unstructured Supplementary Services Data (USSD). USSD differs from SMS in that it allows the user to establish a direct and synchronous session.
Information Management in Modern Enterprise: Issues & Solutions 478
Mobile Entities (3-Tier Model) In the 3-tier Mobile model, as adopted in South African, the 3 principle stakeholders are; a) the network operator who manages the mobile network; b) Service providers in who essence responsible for retailing mobile telecommunication products; and c) Wireless Application Service providers (WASPs) who are primarily engaged in creating, marketing and hosting Mobile Content Services.(e.g. iTouch SA). This particular 3-tier model is apparently unique to South Africa [8], but may create problems within the value chain, in that profits have to be split 3 ways. When contrasted to European countries and the US, for example, Network Operators also perform the dual role of Service Provider. It can be argued that in South Africa, WASP's have less incentive to introduce more services, as the revenue has to be shared with two other entities. Areskoug and Engstrom have identified similar issues with their research on Content Services in Scandinavian countries where a 5-tier model is currently in use [9]. On the other hand, Yell argues that the South African model, based on the inclusion of 3rd party Service Providers, is one of the reasons why cellular has been so successful in South Africa [8]. Mobile User Billing Content Services are billed according to 'Premium' rates that are regulated by the Independent Communications Authority of South Africa (ICASA). In the case of contract subscribers, the Service Provider is responsible for billing the subscriber is accordance with the rate in question. The Network Operator invoices the Service Provider and WASP. Prepaid uses are charged immediately by the Network Operators by having their airtime value debited. 3. Adoption and Usage At the time of writing, no academic research into the usage and adoption of Mobile Content Services within South Africa was available. Alberts and Jovanovic discuss in detail the results of a recent ITWeb.com online readership survey aimed at addressing wireless Data Services usage in South Africa [10]. The findings showed a surprisingly high level of understanding and actual usage of services and technologies like wireless access to E-mail, the Internet, GRPS and WAP. Unfortunately the sample of 628 only reflected wireless vendors, corporate usage and professionals most of whom are subscribers to ITWeb. The studies have not paid any attention to Mobile Content Services. At a broader and global level, it is noted that adoption rates of mobile data services differ significantly across countries [4] [7]. In US, Asia
and Europe, a number of compelling factors can be attributed to the different rates of adoption, as confirm in the study of i-mode in Japan [5]. Services with an entertainment emphasis generally gain mass adoption particularly among the youth faster than other services such as information-based services [11]. Ring tones, operator logos and network-based mobile games are the most popular. This is certainly true for Japan, where simple entertainment based services represent 75% of mobile traffic followed by E-mail and news [5]. Table 1: I-mode Sites and Access [1] Category Nr of % access to isites mode's official menu News/Weather/ 35 19% Information Mobile Banking 243 4% Credit Card/ 11 (see Mobile Securities/Insurance Banking) Travel/Traffic/Maps 17 1% Shopping/Living 27 5% Gourmet/Recipes 9 1% Melodies/Images 54 (see Entertainment) Games/Fortune 33 (see EnterTelling tainment) Entertainment 101 64% Town Information/ 56 2% Administration Dictionary/Tools 24 4% Total 610 100% An interesting comparison can be drawn between Mobile Banking and Entertainment. Mobile Banking has the highest web presence yet is not very popular, illustrating that the true value and usage of MCommerce has not yet been realised. South African Youth According to the Statistics Bureau of South Africa, 44% of all South Africans currently have cell phones. This equates to 15 million users. A significant proportion of these users are the South African youth. In terms of youth spending, a more recent study by iTouch based on a survey conducted amongst secondary and tertiary students in South Africa reveal that 53% spend less than R100 an month on mobile charges (ZAR1 ≈ US$0.15). The majority are prepaid users. Further more, as many as 86% of the students at tertiary institutions are prepaid subscribers. In addition to spending, the South African youth are following global trends and are becoming the fastest-growing users of cell phones [12] [13]. Studies in Japan, reveal that youth consider the cell phone to be an extension of their image and a
Information Management in Modern Enterprise: Issues & Solutions 479
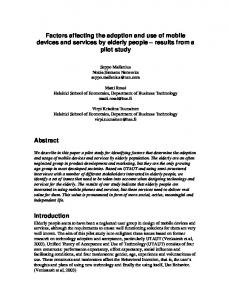
reflection of their values [4] [5]. Two thirds of the imode subscribers in Japan are under 35, with the under 25 market segment generating the highest monthly bills.
under 20 7%
over 39 29%
20-24 24%
under 20 20-24 25-29 30-34 35-39
35-39 8%
over 39 30-34 12%
25-29 20% (Source: NTT DoCoMo, October 2000)
Figure 1: i-mode Users by Age Group [1] The cell phone embodies much of what young people demand namely mobility, affordability and constantly staying in touch with friends. In so doing, the cell phone allows users to express their individuality, satisfies their technology-obsession and builds image [12]. The research suggests that the ‘Y-Generation’ has accepted the cell phone as a personal accessory because it is mobile, useful and has changeable characteristics. This group is techno-savvy and is not afraid to try out trendsetting capabilities, sounds and graphics. Furthermore, this group finds the cell phone liberating, free from monitoring, easy to use and provides instantaneous access to their peers [4]. Leps discusses the concept of the youth in South Africa adopting a 'Mobile Personality'. He says that the youth have latched onto cell phones as a means of personal expression. "The market is young and vibrant with an insatiable appetite that needs regular refreshment. This leads to youngsters constantly updating their cell phone profiles, as they are concerned about their image." [13]. An iTouch survey (conducted recently amongst students and scholars in South Africa) revealed that youngsters were changing their ring tones as often as 10 times a year and that personalisation of the cell phone is one of the more popular activities. SMS is also a popular form of communication amongst youth in South Africa. The number of text messages being sent is roughly equal to the number of voice calls being made [12]. In South Africa, mobile vendors are strongly aware of the potential in this youthful market and they actively attempt to educate students on campuses across the country. This is done using flyers, campus radio, websites and magazines [2].
Technologies and Convergence 3rd generation (3G) cellular networks are said to be the next big leap for mobile technology. Supporters hope that it will solve existing problems of 2G networks, namely that of speed and bandwidth. 3G, however, has its own shortcomings that will made it difficult for it to live up to all its expectations [1] [14]. 3G bandwidth varies from 144 Kbps to 3Mps depending on a subscriber’s proximity to a hub. This will impact on the user’s ability to roam without compromising the quality of service. The technology is expensive and Network Operators have invested a considerable amount of money for 3G licenses. This will impact on quality of service, as rural areas will most probably be served on a 2G/2.5G network for some time to come. Companies in South Africa are already offering 3G technologies in the form of wireless Local Area Networks (LANs) using Wireless Fidelity (Wi-Fi) hotspots in certain areas (e.g. restaurants, hotels, airports). These technologies have the bandwidth and speed to cope with the demand for mobile data services in the future but they have inherent roaming issues [15]. Hotspots may be a cheaper medium for sending large amounts of data but GPRS will always have its place, because it can be used wherever there is a cell phone signal, while Wi-Fi is restricted to hotspots [16]. It is generally believed that the future of wireless services will lie in the convergence of different mobile technologies. The future is likely to see an ecosystem of technologies from which a user will be able to choose when wanting to connect from a mobile device. No individual mobile technology, used in isolation, will be the sole answer to all our mobile needs. Eventually the connection might even be seamless and transparent to the user [14] [16]. Innovation Diffusion Theory (IDT) IDT model was identified as a better model to help explain user behaviour with regards to acceptance of mobile technologies and also for its congruency with two of the central studies in this research [3] [4]. Whilst [5] suggest that both models can be used to examine the factors that influence the adoption and diffusion of new technologies in a social system, IDT has been identified as the most appropriate model to explain the adoption rates of mobile data applications across various countries [4]. Everett Rogers spent 30 years studying the diffusion of innovations of all kinds from the QWERTY keyboard to agricultural innovations in developing countries [5]. He developed a set of key innovation characteristics that he and others have shown may explain the outcomes of innovation diffusion.
Information Management in Modern Enterprise: Issues & Solutions 480
Table 2: Comparison different wireless technologies in SA (Norwood-Young and Haggard, 2004) Cellular Hotspot My Wireless Technology
Performance
Coverage
Cost
GSM GOOD 9.6kbps-64kbps (depending on connection used and coverage area)
EXCELLENT basic coverage countrywide, GPRS in some metropoles FAIR normal/premium cellular call costs or average of R31 per MB for GPRS
Wi-Fi EXCELLENT 11mbps-100mbps (for accessing local content) GOOD 64kps and upwards (for accessing the Internet, depends on service provider) FAIR only metropolitan areas where there are hotspots GOOD depends on service provider. Average of R1 per min
RF technology EXCELLENT 128kbps-3mbps (depending on package and coverage area)
POOR only certain areas within metropoles fall within the coverage area GOOD R670 per month upwards.
Table 3: The Original IDT Constructs Construct
Definition
Source
Relative Advantage (RA) Compatibility (CT) Complexity (CP) Trialability (T) Observability (O) Image (I) Voluntariness (V) Cost (C)
The degree to which the innovation is perceived as being better than the practice it supersedes The extent to which adopting the innovation is compatible with what people do The degree to which an innovation is perceived as relatively difficult to understand and use The degree to which an innovation may be experimented with on a limited basis before making an adoption (or rejection) The degree to which the result of an innovation are visible to others The degree to which use of an innovation is perceived to enhance one's image or status in ones social system The degree to which use of the innovation is perceived as being voluntary or of free will The degree to which use of an innovation is perceived to be relatively expensive
Rogers (1983)
The constructs in another widely used technology adoption model, TAM, can be mapped quite easily on the IDT's constructs. Relative Advantage is analogous to the 'perceived usefulness' construct in TAM while Complexity is analogous to the ‘perceived ease of use’ construct in TAM. [17] Moore and Benbasat identified two further constructs that were added to Rogers' 1983 IDT model, namely Image and Voluntariness. For the purposes of this research, Voluntariness has been excluded [18]. They built their model within the context of an organisation, where individuals were required to use the information technology in question as part of their jobs. Using Mobile Content Services, for the most part, is voluntary and there is therefore no need to include or measure it as a factor. Another construct suggested was Cost [19]. Moore and Benbasat excluded the Cost construct from their model, as they argued that within organisations, the individuals who are measured do
Rogers (1983) Rogers (1983) Rogers (1983) Rogers (1983) Moore and Benbasat (1991) Moore and Benbasat (1991) Tornatzky and Klein (1982)
not have control over the cost of the information technology in question. However, cost is relevant in this research, as the individuals using Mobile Content Services are largely responsible of paying for them. Relative Advantage (RA) Compatibility (CT) Complexity (CP) Trialability (T)
Usage Intent
Actual Usage
Observability (O)
Image (I)
Cost (C)
Figure 2: Revised Diffusion of Innovation Model Moore and Benbasat made an interesting observation of Rogers’ (1983) IDT model. They noted that Rogers' definitions were based on the
Information Management in Modern Enterprise: Issues & Solutions 481
perceptions of the innovation itself, and not on the perceptions of actual use of the innovation. They sorted this confusion out by simply rewording the measures used. This research will use Moore and Benbasat's measures in the instrument as illustrated in Figure 2. 4. Methodology Sampling Methodology for Primary Data Collection The 2001 Census showed that at the time of the census, there were 2,113,774 individuals under the age of 25 years living in the Western Cape. Budgetary and time constraints limited the researchers’ ability to apply a random sampling technique on this large profile group and hence a more practical sampling approach was taken. The basis was call centers which provided a profound cluster of this group. Two company call centers were identified as accessible and convenient to survey namely one in the Retail industry and the other in the Mobile Communications industry. The timing of the survey coincided with the July holidays in the hope that the call centers would have a proportionally higher percentage of young students trying to earn extra money. Research Strategy and Design A quantitative research design was chosen. The survey instrument, which is available on simple request from the authors, is a structured questionnaire split into four sections and appropriately designed improve the response rate as well as facilitate data capture.
of the questionnaire were made and distributed to candidates over a two week period. The supervisor distributed questionnaires at the beginning of candidates working shifts and briefly explained its purpose. All responses were coded and captured, checked for anomalies, and then imported into Statistica (a data analysis tool). Likert-scale responses were captured “as-is” and blank spaces were used where responses were omitted. Identifiers (unique sequence number) were used to separate individuals’ responses and this number was manually captured onto each questionnaire for referencing purposes. The majority of the descriptive statistics was done with the help of a spreadsheet (Excel), while the Correlations, Factor Analysis and Regression Analysis were done using Statistica. All inferential statistics were done using case-wise deletion. Mean substitution was not used to correct missing pairs. 5. Analysis and Results Survey Demographics Results are based on 84 responses (no cases needed to be rejected).The majority of responses (73%) came from the Retail Call Centre. The average age across both samples was 23 years while the average monthly cell phone expenditure was R259.19 as shown in Table 4 below. The average respondent was also female, worked as a casual, owned a cellphone, used the Vodacom network and was on the prepaid service.
The first section considers demography and trends while the next section looked at the available Mobile Content Services. In this section, users are asked to specify usage frequency, importance and ranking. The third section highlights on technology usage. The last section relates to the different hypotheses that needed to be tested. The responses options use a 5-point Likert scale. A pilot test questionnaire was sent to 3 people. This exposed some initial slight limitations of the instrument which were subsequently addressed in the final questionnaire.
Table 4: Respondent Profile across Samples Factor Mode Median Std Skew Dev Age 22 22 3.3 0.652 Gender Female Working Casual Status Own a Cell Yes Phone Network VodaOperator com Type of Prepaid Service Avg Monthly 60 162.5 257.8 1.45 Expenditure
Data Collection The contact persons for the two call centers (Retail and Mobile Communications) were senior managers. With their assistance, the research instruments were distributed in an organized way to ensure adequate coverage. The objectives and goals of this research were carefully explained to the senior managers. Identified supervisor were designated to administer the questionnaire and assess candidate suitability (based on age). Copies
The initial data analysis revealed that the two sample call center profiles were quite different from each other in terms of age, working status, type of service, mobile service provider and monthly cell phone expenditure profiles. The gender profile however, was similar across both samples. The difference was attributable to the fact that in one call center it was standard practice to employ fulltime workers (having marginally higher disposable income and hence older people) as opposed to the
Information Management in Modern Enterprise: Issues & Solutions 482
other call center where casual workers were predominant. It was observed that students, noted as prime target for casual work, usually did not accrue benefits of a cell phone contract which carried along with it benefits like cell phone allowances as demonstrated by the other call center. Diversity and Frequency of Use The study revealed that the most frequently accessed/acquired content service for both male and female was the Info/Alert Weather, which was used daily. Males however had higher affinity to Movies and Music, as opposed to Women whose inclinations steered them to Astrology and Games. Contrary to popular opinion dating services was not popular to either gender. The strength and result of this study amplifies the work of [4] [5], which suggest that there are essential features provided by Mobile Content Services deemed to be of prime importance. This study ranks “Ring tones” as the highest “Could not Live Without” feature. The “Games” feature is ranked second while Operator Logos is ranked third. While analysing the average price the respondents were prepared to pay for the different Mobile Content Services it was interesting to note that although Ring tones were of prime importance, many people were willing to pay double its price to access exam assignments and results. Conversely people were willing to marginally spend half that amount on most info/alerts. The study also investigated the general awareness/knowledge of latest cell phone technologies. Respondents were asked if some of these technologies were activated on their mobile phones. The data was analysed by service type, i.e.
understanding of the different mobile technologies, to the extent that they had these newer mobile technologies installed in their respective cell phones. A possible reason for these differences would be the possibility that the vast majority of contract respondents are educated about the features of mobile technology and handsets and are therefore willing to pay extra premium for these. The respondents also displayed deeper insights that influenced their procurement behavior. For instance some respondents noted that the high premiums paid for content services impacted on their frequency of use. Others acknowledged that price of cell phones was high and out of reach. This problem was exacerbated by expensive airtime. A few suggested that though some features of content services were desirable, they had no idea how these were acquired/accessed or even that they were available. Only a minority enjoyed the full privileges of all the cell phone features. These findings corroborate previous research work [12] [20]. D o you know w hat M M S is ?
91%
D o you kn ow wh at G P R S is ?
86%
D o you kn ow wh at W A P is ?
53%
Do you know what GPRS is?
27%
35%
Do you know what WAP is?
22%
24%
Is your cell phone GPRS-enabled?
44%
20%
Is your cell phone WAP-enabled?
15%
7%
16%
7%
20%
36%
24%
0%
7%
44%
55%
Is your cell phone MMS-enabled?
13%
33%
44%
20% Yes
40% No
Unsure
11%
22%
60%
13%
80%
9% 5%
95%
Is your c ell phon e M M S en abled?
82%
Is your c ell phone G P R S enab led?
82%
Is your c ell phone W A P enab led?
5% 0%
18% 0%
14% 5%
91% 0%
10 %
20%
Y es
Do you know what MMS is?
9%0%
30%
No
4 0%
U nsure
9%0%
50 %
60%
7 0%
80%
90%
1 00%
N on-R esponse
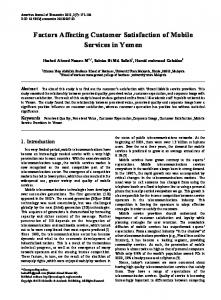
Figure 4: Indication of User Knowledge and Handset Technology among Contract respondents. Construct Validity and Reliability The study excludes Cronbach’s Alpha testing for reliability and derivation of standard deviation for each of the 8 Lickert Scale question groups since the study incorporates 2 questions per construct. (Cronbach’s Alpha requires at least 3 in order to calculate standard deviation).
11%
100%
Non-Response
contract or prepaid (see figures 3 and 4). Figure 3: User Knowledge and Handset Technology among Prepaid respondents The study revealed distinct differences between the prepaid and contract respondents in this survey. For instance, contract respondents showed a better
Correlation matrices were calculated for each of the three content services surveyed in order to test for reliability of the different question groups. They suggest that the majority of question groups did not correlate as well as could be hoped for. A number of reasons may attribute to this finding. For instance it is possible that some questions were not well understood by the respondents. This meant that within the same construct and similar
Information Management in Modern Enterprise: Issues & Solutions 483
questions, the respondents gave different responses. One way of overcoming this difficulty is the inclusion of more questions per construct. If one question had been misunderstood, the others would still mitigate this oversight, capture content and hence correlate. The limitation of this study may have been that some of the questions used were replicas of the original IDT model [18]. The IDT model holds true for identifying behavioral factors that impact the intent to use IT applications within a traditional working environment, but may not have been best-suited to the Mobile Content Services environment. A further test for construct validity was undertaken using Factor Analysis. Factor Analysis is usually undertaken for two reasons, namely either to identify structure or relationships that exist within the questions or to confirm that certain questions load on a particular factor as initially predicted. Factor Analysis in all three content services surveyed confirmed the results from the Correlation Matrixes. The related questions from the different constructs did not load cleanly on different factors. Questions from different constructs loaded on the same factors. We then attempted a varimax rotation Factor Analysis for all three content services surveyed. A varimax solution yields results that make it reasonably simple to identify each construct with a single factor, and it is also the most common rotation option (Table 5).
content services. This could possibly be attributed to the fact that Information Alerts are accessed more frequently (as shown in the survey) and that the majority of the content for Information Alerts is only useful for a relatively short period of time (e.g. news, weather, TV guide). The user might therefore be more sensitive to the cost of Information Alerts. Finally, the study has also supported the following hypotheses. • Relative Advantage has a positive effect on the intent to use Ring Tones • Increased Trialability has a positive effect on the intent to use Ring Tones • Increased Complexity has a negative effect on the intent to use Operator Logos • Increased Compatibility has a positive effect on the intent to use Operator Logos • Increased Compatibility has a positive effect on the intent to use Information Alerts • Increased Cost has a negative effect on the intent to use Information Alerts • Relative Advantage has a positive effect on the intent to use Information Alerts Compatibility (CT) Complexity (CP) Trialability (T) Image (I) Usage Intent (UI) Cost (C)
Relative Advantage (RA)
Observability (O)
Ring Tones
Trialability (T)
Image (I)
Compatibility (CT) Usage Intent (UI)
Relative Advantage (RA)
CT1 CT2 RA1 RA2 CP1 CP2 T1 T2 I1 I2 C1 C2 O1 O2 Expl Var Prp Tot
Factor 1 0.3700 0.6921 0.7493 0.1968 -0.0814 0.1578 0.0498 0.1154 0.8453 0.6994 -0.0019 0.2247 0.1143 -0.4039 2.6942
Factor 2 0.1535 0.2541 -0.1118 -0.0672 -0.0074 0.7102 0.5501 0.7828 -0.0360 0.1028 0.0776 0.0107 0.0542 0.5883 1.8925
Factor 3 0.6455 0.1350 0.2014 0.8459 -0.0699 -0.2560 0.2857 0.0724 0.1691 0.2345 0.4484 0.7906 0.2071 0.2233 2.3511
Factor 4 0.0525 0.0366 -0.1354 -0.0784 0.9326 0.1734 0.4560 -0.1766 0.1851 -0.1691 0.5208 0.0740 0.2343 -0.0131 1.5624
Factor 5 0.1709 0.0513 -0.0313 0.1292 0.1045 0.0616 0.2233 -0.1990 0.1251 0.0007 -0.6299 -0.0931 0.7447 0.3166 1.2298
0.1924
0.1351
0.1679
0.1116
0.0878
Table 5: Factor Analysis (Varimax Normalized) of Ring Tones Hypotheses Testing Figure 5 gives a graphical summary of the findings of this study where only those relationships which showed a statistically significant correlation have been shown. An interesting and profound development in this study is that Cost only showed a significant relationship with Information Alerts and not with the Ring tones or the Operator logos
Complexity (CP)
Observability (O)
Operator Logos
Trialability (T) Compatibility (CT) Image (I)
Complexity (CP)
Cost (C)
Usage Intent (UI)
Relative Advantage (RA)
Information Alerts
Figure5: Summary of factors impacting on Usage Intent for all three mobile content services surveyed 6. Conclusion This research demonstrates that the adoption of Mobile Content Services among cell phone users is strongly influenced by a number of independent factors as stipulated by the IDT model. The analysis of this survey’s results indicates that a majority of the independent factors (Relative Advantage, Compatibility, Complexity, Trialability, Observability, Image and Cost) have either directly or indirectly impacted on the intent to use some of the content services (Ring Tones, Operator Logos and Information Alerts). These findings are consistent with similar research conducted in other parts of the world.
Information Management in Modern Enterprise: Issues & Solutions 484
The study has highlighted on the behavioural disparity between prepaid and contract users specifically in the confines of mobile technologies. There is reason to believe that the technology refresh rate on handsets is greater amongst contract than prepaid users. This may explain the prepaid users’ lack of understanding and familiarity with newer mobile technologies. More importantly, outdated handsets may be a future barrier to getting cell phone users to use more advanced mobile data services. Furthermore, though most respondents in this study showed familiarity with Mobile Content Services and related technologies as exhibited by a general willingness to use them, gender appears to have played a greater role by being a key differentiator in the frequency of use (and usage) of Mobile Content Services. Caution is taken on the fact that these findings cannot be inferred onto the general population with greater assertiveness by virtue of the research instruments and the sampling frame. In conclusion, this paper illustrates the importance of which a thorough understanding of the factors that contribute to the adoption and usage of Mobile Content Services should be placed. This is of particular relevance if we are to understand the general behavior of mobile data services’ users and in so doing, assist with the future development and success of more complex mobile data services such as M-Commerce. 7. References [1] Giussani, B., 2001, ‘Roam: Making Sense of the Wireless Internet’, Random House Business Books, London. [2] Ashford, W., 2004, ' Broadband Power to the People', ITWeb Brainstorm, April 72-74 [3] Sarker, S., Wells, J., 2003, 'Understanding Mobile Handheld Device Use and Adoption', ACM 46,12. [4] Fife, E., Pereira, F., 2003, 'The Diffusion of Mobile Data Applications', The Journal of Communications Network, Vol 2 Part 3, JulySeptember 2003 [5] Barnes, S., Huff, S., 2003, 'Rising Sun: i-mode and the Wireless Internet', ACM 46, 11 [6] MacMillan, D., 2003. ‘Client Issues for Mobile and Wireless’, Gartner, AV-21-1650. [7] Palen, L., Salzman, M., Youngs, E., 2001, 'Discovery and Integration of Mobile
Communications in Everyday Life', Personal and Ubiquitous Computing 5:109-122 [8] Hislop, R., 2004, 'Hobbled by Ball and Value Chain', ITWeb Brainstorm, April 62-64 [9] Areskoug, C., Engstrom, J., 2002, 'The Consumer Market for Mobile Content Services', Post&Telestyrelsen, PTS-ER-2002:21 [10] Alberts, C., Jovanovic, R., 2004, 'On the Cusp of Something Great', ITWeb Brainstorm, April 4752 [11] Pienaar, M., 2002, 'Usage of Content Services by Mobile Device', Vodacom Knowledge Based Systems. [12] Mattheus, D., 2004,' South African Youths' Love Affair with Cell Phones', [Online] Available http://www.itweb.co.za [07-April-2004] [13] Leps, S., 2002, 'Youth Adopt Mobile Personalities', [online] www.mediatoolbox.co.za [1 April 2003] [14] Rotter, M., 2002, 'The Hurdles Facing 3G in SA', IT Web, [Online] Available http://www.itweb.co.za [30 January 2004] [15] Norwood-Young, J., Haggard, B., 2004, 'The Reality of Being on the Road', ITWeb Brainstorm, April 5. [16] Alberts, C., 2004, ‘Predicable Perspectives’, [Online] Available http://itweb.co.za/sections/columnists/dotcolumn/al berts040325.asp [25 March 2004] [17] Taylor, S., Todd, P., 1995, 'Understanding Information Technology Usage: A Test of Competing Models', Information Systems Research, 6:2 [18] Moore, G., Benbasat, I., 1991, 'Development of an Instrument to Measure the Perception of Adopting an Information Technology Innovation', Information Systems Research, 2:3 [19] Venkatesh, V., Morris, M., Davis, G., Davis, F., 2003, 'User Acceptance of Information Technology: Toward a Unified View', MIS Quarterly Vol 27, no3, September 2003 [20] Bakker, B., 2004, 'Is South Africa Ready?', ITWeb Brainstorm, April 54-55