International Journal of Human-Computer Interaction
ISSN: 1044-7318 (Print) 1532-7590 (Online) Journal homepage: http://www.tandfonline.com/loi/hihc20
Factors Affecting Web Portal Information Services Usability: A Canonical Correlation Analysis Rex Bringula To cite this article: Rex Bringula (2016): Factors Affecting Web Portal Information Services Usability: A Canonical Correlation Analysis, International Journal of Human-Computer Interaction, DOI: 10.1080/10447318.2016.1199180 To link to this article: http://dx.doi.org/10.1080/10447318.2016.1199180
Accepted author version posted online: 10 Jun 2016. Published online: 10 Jun 2016. Submit your article to this journal
Article views: 1
View related articles
View Crossmark data
Full Terms & Conditions of access and use can be found at http://www.tandfonline.com/action/journalInformation?journalCode=hihc20 Download by: [Rex Bringula]
Date: 13 June 2016, At: 02:40
Factors Affecting Web Portal Information Services Usability: A Canonical Correlation Analysis Rex Bringula
ip t
[email protected]
cr
Abstract
us
combinations of student, web portal design, and objective measure-related factors might
an
influence both frequency and satisfaction of use of the web portal information services (WPIS). Data gathered from the two studies revealed that usability of WPIS is a combination of self-
M
initiative, commitment, content, availability, speed, aesthetics, ease of use, and effectiveness of WPIS. Thus, the null hypothesis stating that the predictor variable set cannot explain any of the
ed
variance of the dependent variables was rejected. It was concluded that the WPIS usability was more sensitive to design-related factors than the student-related factors. It was likewise shown
ce pt
that effectiveness is a design consideration and not a dimension of usability in the context of web portal. Further, it was disclosed that initiative and commitment and not external pressure influence usability of WPIS. Limitations and recommendations were also offered. Keywords – commitment, design factors, effectiveness, self-initiative, web portal, web portal
Ac
Downloaded by [Rex Bringula] at 02:40 13 June 2016
This study employed canonical correlation analysis to determine which of the possible
information services
1
Introduction Higher education institutions are seeking innovative ways to collect, store, and
ip t
disseminate information to its stakeholders (i.e., faculty members and students). Stakeholders have a high demand for up-to-date, accessible, and relevant information. On one hand, teachers
cr
may post their grades online, disseminate announcements, or search for educational materials for
us
announcements from their teachers, or verify their current account balances. Universities respond
an
to these demands by offering a university web portal. Web portal serves as both information
M
aggregator and disseminator.
Different studies (e.g., Lee, 2008; Cheung and Lee, 2009; Santosa, 2009; Bringula and
ed
Basa, 2011; Bringula, 2013) were conducted to determine the factors that influence educational web portal usability so as to ensure its optimal use. However, the existing threads of
ce pt
investigations analyzed the factors that predicted web portal usability in a “linear” perspective; that is, the analyses were mostly done to find the influence of a single metric factor from a linear function of another set of factors. This is not always the case for usability studies (Bringula and Basa, 2011). Cheung and Lee (2009) commented that previous studies on information systems (IS) assumed that independent variables symmetrically and linearly affected user satisfaction.
Ac
Downloaded by [Rex Bringula] at 02:40 13 June 2016
their lessons. On the other hand, students may be interested to know their course grades, receive
They further argued that this method may misestimate the actual impact of independent variables on dependent variables. For example, a product or an innovation may not be used frequently but users nevertheless got satisfaction from utilizing it (Bringula and Basa, 2011). Thus, it is worth
2
investigating to find the possible combinations of factors that might influence the combination of indicators of student web portal usability. In light of this research gap, this paper was conceived. Specifically, this study aimed to
ip t
answer the following questions. 1) What are the student-related factors that might influence
cr
students’ use of the web portal information systems in terms of duration of use of the web portal, computer skills, Internet usage skills, commitment to the use of the web portal, level of
us
perceived the web portal design-related factors in terms of effectiveness, ease of use, content,
an
availability, speed, and aesthetics? 3) What are the objective measure-related factors that might influence students’ use of the web portal information systems in terms of time spent, problems
M
encountered, and success rate of the participants in carrying out different tasks in using the
ed
WPIS? 4) What is the usability of the web portal information services in terms of frequency of use and level of satisfaction? 5) Do the following factors ⎯ student, web portal, and objective
ce pt
measure- related factors ⎯ explain any variance in the usability of the web portal information services?
Literature Review
Ac
Downloaded by [Rex Bringula] at 02:40 13 June 2016
isomorphic pressure, and level of self-initiative to use the web portal? 2) How do participants
Student-Related Factors The skills of computer users may affect the perceived effective design of a system (Sandvig and Bajwa, 2004). Lee (2008) commented that users who are skilled in using
3
computers may work more effectively in performing a task. Hence, it is important to determine the skills and experiences of users in using a computer and the Internet (Bringula and Basa, 2011). In general, self-efficacy is the perceived ability of a person to perform a task believing
ip t
that that a person will achieve a certain outcome (Maddux, 2007). Self-efficacy beliefs are task specific (Palladino, 2006), subjective, and situation-dependent (Maddux, 2007). Thus, computer
cr
self-efficacy is “an individual’s perceptions of his or her ability to use computers in the
us
Tung, 2008 from Compeau and Higgins, 1995, p. 192). Computer self-efficacy is one indicator
an
of computer skills (Pearson and Pearson, 2008).
Zhang et al. (2006) showed that satisfaction of users of e-service correlated positively with the
M
users’ skills and experiences in using a computer. In the study of Chan and Tung (2008), computer self-efficacy and other variables (e.g., compatibility, perceived usefulness, ease of use,
ed
and system quality) were hypothesized to predict behavioral intentions of students to use online
ce pt
learning course websites. Structural equation modeling on the data gathered from 212 undergraduate students in Taiwan revealed that computer self-efficacy and all other variables mentioned influenced the use of online learning course websites. Researchers (e.g., Bringula and Basa, 2011; Bringula, 2013) advocated the inclusion of
Ac
Downloaded by [Rex Bringula] at 02:40 13 June 2016
accomplishment of a task rather than reflecting simple component skills” (adapted by Chan and
commitment as a factor that might influence usability of a system. Commitment is a “force that binds an individual to a course of action” (Meyer and Herscovitch, 2001, p. 301). In the context of portal usage, “teachers who are committed to use e-learning and online digital library resources could be expected to use the technology even if the benefits are not apparent”
4
(Bringula 2013, p. 189). Bringula (2013) showed that commitment had positive influence on faculty web portal usability. Absent in the literature is the possible impact of isomorphic pressures on web portal usability.
ip t
Isomorphic pressures were extensively discussed in the field of business (e.g., Dimaggio and
cr
Powell, 1983; Teo et al., 1997; Ashworth et al., 2009; Brouthers et al., 2013; Li and Ding, 2013). Dimaggio and Powell (1983) proposed that there were three forms of isomorphic pressures. The
us
because of laws issued by governments, parent corporations, and other dominant institutions.
an
Mimetic pressure, on the other hand, is the type of pressure where institutions adopt practices or innovations because of the technical value of such practices and innovations. The purpose of the
M
adopting institution in this type of adoption pressure was to gain social legitimacy. The last pressure was normative pressure which may be exerted by suppliers, customers, business, trade,
ed
and professional organizations. The adopting organization may be compelled to adopt an
ce pt
innovation since their stakeholders are embracing the same technology.
Usability and Web Portal Usability A product was usable when individuals could use the product easily and intuitively
Ac
Downloaded by [Rex Bringula] at 02:40 13 June 2016
first form was coercive in nature. In this form, organizations adopted practices or innovations
(Preece, 2001; Preece, 2001; Koohang and Ondracek, 2005). It is expected that such usage lead to satisfying the needs and specifications of users (Koohang and Ondracek, 2005). According to ISO 9241 (1998), usability was composed of efficiency (resources spent in performing tasks), effectiveness (the ability of users to complete tasks using a technology with the assurance that
the output of that task have quality), and satisfaction (subjective evaluation of contentment by
5
using the technology). Nevertheless, there is no universal definition of usability (Sindhuja and Dastidar, 2009) since it is “context-dependent and is shaped by the interaction among users, tasks and system purpose” (Granic et al., 2011, p. 341). Thus, usability investigations varied from one
ip t
study to another.
cr
Usability studies had been carried out in the context of web portals. Educational web portal integrates information and library services. As an information provider, it stores, processes, and
us
student-teacher forum. It may function as library portal where digital resources and web-based
an
library services are offered and may be accessed anytime, anywhere (Letha, 2006). In both
M
capacities, it allows users to perceive and consume information effectively (Koneru, 2006). Different studies investigated the usability of educational portals. Bringula (2013) studied
ed
the faculty- and web portal design-related factors that influenced usability of faculty web portal. The author investigated the faculty web portal usability in the context of e-learning services and
ce pt
online library resources. Age, highest educational attainment, length of use of web portal, level of user experience, Internet access at home, and commitment to the use of web portal were indicators of the first factor. Web portal design-related factors comprised of ease of use, information content, availability, speed, and aesthetics. Hierarchical regression analysis on the
Ac
Downloaded by [Rex Bringula] at 02:40 13 June 2016
disseminates information such as distribution of lecture notes, student-student interaction, and
data gathered from 118 faculty participants revealed that age, commitment, and information content had positive influenced on the faculty web portal usability. In their study, Navarro and Rodriguez (2012) hypothesized that increased student use of e-learning portals is positively associated with their use of basic Internet and Intranet systems,
6
and use of groupware systems. They also assumed that students’ achievement in the course was positively associated with the use of collective systems by the universities. The researchers concluded that by “effectively developing higher levels of groupware systems, teachers empower
ip t
students to make better, and more informed decisions—and facilitate the utilization of e-learning
cr
portals” (Navarro and Rodriguez, 2012, p. 85).
Underutilization of university websites by students in a southeastern university in the United
us
six students showed that the participants were comfortable in using the student page interface
an
(e.g., links, breadcrumbs, opening portable digital files, and using graphical links). The participants also had no concerns with the design or layout of the website and perceived that the
M
layout allowed easy scanning of its content, and were primarily interested in information-related services such as exam schedules and important dates. However, students perceived that the
ed
university’s student page was difficult to navigate and the style was out dated. Participants
ce pt
looked for information at the student portals but not on the student page of the website. It was concluded that lack of information (e.g., news, events, and other student-related information), lack of instrumentation (e.g., architecture support from technology department, content support from the marketing department, and oversight by a content manager), and lack of motivation (i.e., students were not motivated to browse the student page) were the reasons of low use of the
Ac
Downloaded by [Rex Bringula] at 02:40 13 June 2016
States prompted Snider and Martin (2012) to conduct a usability study. One-on-one testing with
student website. They recommended that the presentation and navigation characteristics of the web pages be improved.
7
Guided by ISO (1997), Joo and Lee (2011) argued that effectiveness, efficiency, and satisfaction were the dimensions of usability of academic libraries. Joo and Lee added learnability as one of the usability dimensions. They adopted the definition of Nielsen (1993) of
ip t
learnability as “measures of how easy it is for casual learners to learn a system” (Joo and Lee, 2011, p. 525). The study managed to develop a valid and reliable instrument which contained
cr
four items each on effectiveness and learnability, and three items each on efficiency and
us
assessment were the four usability criteria of digital libraries. Santosa (2009) conducted a similar
an
study on Papirus, an e-learning system developed in one department of a university. Santosa found out that ease of navigation had a strong effect on perceived ease of use, which in turn
M
affected attitude and satisfaction of users.
Tarafdar and Zhang (2005) analyzed 200 websites of different kinds in order to determine
ed
the factors that influence usability. The authors hypothesized that information content, ease of
ce pt
navigation, download speed, availability, security, and personalization and customization influenced website usability. Information content refers to the quality, variety, relevance, timeliness, and comprehensive content of a website. Ease of navigation denoted the simplicity with which users can move around the website. Download speed as the measure of delay of web pages to appear in the browser. Website availability referred to a website whose pages are always
Ac
Downloaded by [Rex Bringula] at 02:40 13 June 2016
satisfaction. Meanwhile, Saracevic (2004) proposed that content, process, format, and overall
present whenever needed. Security intended to measure the safety of executing instructions. Personalization and customization is the extent to which a website could be tailored to user needs. It was disclosed that information content, ease of navigation, download speed, and website availability had positive influence on website usability.
8
Cheung and Lee (2009) pointed out that past research in IS user satisfaction were focused on “key driver analysis”. They commented that these approaches viewed that independent variables were symmetrically and linearly affect user satisfaction. Bringula and Basa (2011) agreed with
ip t
this argument. To provide evidence to this argument, Cheung and Lee investigated the effects of information quality of an educational Internet-based portal (http://www.hkedcity.net) on user
cr
satisfaction. Information quality was contextualized in terms of appropriateness, up-to-date-ness,
us
negative perceived performance on all four quality attributes had a greater impact on user
an
satisfaction than the positive perceived performance.
It was shown that aesthetics served as predictor of website usability. Uniformity of design,
M
appropriate graphics, and organized patterns, good color combination, and text are desirable qualities of a website (Teoh et al., 2009; Wells et al., 2011). It was shown that visual appeal in
ed
terms of colors and graphics were found significant indicators of a commercial website quality
ce pt
(Wells et al., 2011). Cyr (2008) further disclosed that visual design which includes colors, photographs, shapes, and font, were found to be significant factors influencing trust and satisfaction in a commercial website. In a related study, Liao et al. (2011) revealed that the perceived usefulness of web portal was influenced by its perceived attractiveness.
Ac
Downloaded by [Rex Bringula] at 02:40 13 June 2016
accuracy, and completeness of information found in an Internet portal. It was revealed that all
Subjective measures of usability are balanced with objective measures (Filippi and Barattin, 2012). According to Herman (1996), objective measures of usability may generate more reliable data than subjective measures. This is because the data gathered was not dependent on the perception of the users (Hornbaek, 2005; Brooks and Hestness, 2010). Instead, they were “direct
9
measures of either the process or outcome of user behaviour” (Brooks and Hestness, 2010, p.9). Objective measures were measured using different performance indicators. Filippi and Baratin (2012) outlined 21 objective measure indicators that were collected during usability evaluation.
ip t
These were task duration, task accuracy, completeness, effectiveness, efficiency, dead time, productiveness, error rate, number of errors, recovery time, help system usage, expert help, used
cr
commands/features, unused comments/features, critical statements ratio, sidetracking, training
us
papers in human-computer interaction journals, 57% used task duration to measure objective
an
usability.
ed
Terms and Hypothesis
M
Synthesis of Literature Review, Research Framework, Definition of
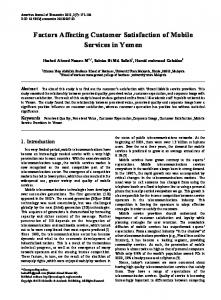
The foregoing review of related literature served as basis for the construction of the research
ce pt
framework shown in Figure 1. The author adopted the concept of non-linearity in the evaluation of information systems (IS). Web portal information services (WPIS) of a university in Manila was the system under investigated. The complete description of the WPIS was discussed in the succeeding sections. WPIS usability was measured in terms of self-report frequency (Frequency) and satisfaction of use (Satisfaction). These were the dependent variables.
Ac
Downloaded by [Rex Bringula] at 02:40 13 June 2016
time, learning rate, and cognitive workload. Hornbaek (2005) showed that of the 113 published
Computer self-efficacy was operationalized in terms of duration of use (Duration), computer usage skill (CompSkill), and Internet usage skill (InternetSkill). Commitment to the use of the WPIS was included in the framework. Absent in the literature was the inclusion of isomorphic
10
pressure (Pressure) as factor that might influence usability. Thus, it was decided that this factor be included. Nonetheless, it was argued that users may use the WPIS even without pressure. Hence, the author decided to include students’ self-initiative (Initiative) as one of the
ip t
independent variables.
cr
This study contended that effectiveness (Effectiveness) was not an indicator of usability. Instead, it was a design consideration. In other words, a system has to be designed effectively so that
us
Thus, effectiveness of WPIS was considered as one of the independent variables. Ease of use
an
(Ease), content (Content), availability (Availability), speed (Speed), and aesthetics (Aesthetics) were deemed the most appropriate design factors of WPIS. Time task duration and success rates
M
were the elements of objective measures. These were selected since these were the most appropriate performance measures in the context of the WPIS. It is hypothesized that the
ed
predictor variable set cannot explain any of the variance of the dependent variables.
1. 2.
ce pt
The variables were defined as follows. Duration of Use of the WPIS (Duration) is the period of use of the web portal. Computer Skills (CompSkill) is a self-report ability of the students to use computers.
Ac
Downloaded by [Rex Bringula] at 02:40 13 June 2016
users may be engaged in using the WPIS and so that satisfaction may be derived from using it.
3.
Internet Skills (InternetSkill) is a self-report ability of the students to use the Internet for
searching and downloading files. 4.
Commitment to the Use of the WPIS (Commit) indicates how dedicated the students are
in using the WPIS.
11
5.
Level of Isomorphic Pressure (Pressure) refers to students’ use of the web portal as a
result of pressure from classmates, friends, or teachers. 6.
Level of Self-Initiative (Initiative) is the degree to use the web portal without the
Perceived Effectiveness of the WPIS (Effectiveness) are the characteristics of the WPIS
cr
7.
ip t
influence of isomorphic pressures.
us
and to increase students’ efficacy in learning.
Ease of Use (Ease) is the attribute of a WPIS that allows students to use them with less
an
8.
9.
Content
(Content)
M
effort. refers
to
the
comprehensiveness,
reliability,
updatedness,
10.
ed
completeness, accuracy, and relevance of the WPIS.
Availability (Availability) is the characteristic of the WPIS in which its elements may be
ce pt
accessed anytime, anywhere undisrupted whenever the user is connected to the Internet. 11.
Speed (Speed) is “the response time of the web server of the web portal on the different
user’s activities” (Bringula and Basa, 2011, p. 257).
Ac
Downloaded by [Rex Bringula] at 02:40 13 June 2016
to save time and effort for increasing level of access in looking for school-related information
12.
Aesthetics is “the general look of the web portal. It includes various design attributes
such as color, web pages layout, font styles and sizes, and general appearance” (Bringula and Basa, 2011, p. 257).
12
13.
Time to complete task was the duration of the task completed. It was measured in
seconds. 14.
Success rate is the quotient of completed tasks and the total number of tasks multiplied
Web Portal Information Services Usability was measured in terms of two indicators –
cr
15.
ip t
by 100%.
us
16.
Frequency of Use (Frequency) refers to how often the participants use the web portal in a
Satisfaction of Use (Satisfaction) refers to the subjective rating of how pleasant it is to
M
17.
an
week.
use the web portal elements and how the WPIS fulfilled the educational and information needs of
ed
the users.
ce pt
Methodology Study 1
This descriptive study was conducted in one of the universities in Manila. The university
Ac
Downloaded by [Rex Bringula] at 02:40 13 June 2016
frequency (Frequency) and satisfaction (Satisfaction) of use of WPIS.
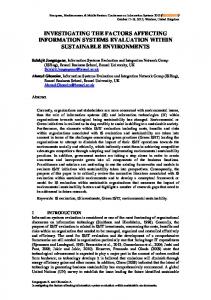
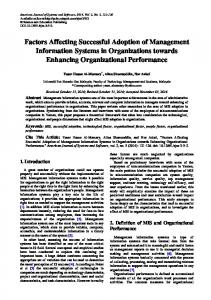
has a student web portal that provides information services (See Figures 2 and 3.). The WPIS is capable of storing, processing, and disseminating information for students’ perusal. They can download lecture notes (Figure 2-a) and relevant forms (Figure 2-b), evaluate teacher’s performance (Figure 2-e), participate in a forum (Figure 3-d), and view class schedule (Figure 2-
13
d), subjects taken (Figure 2-c), account balances (Figure 3-a), grades (Figure 3-b) and subject offerings (Figure 3-c). The study utilized a questionnaire in data gathering. The questionnaire had four parts. The first
ip t
part gathered demographic data of the participants in terms of age, gender, year level, presence
cr
of computer access at home, Internet access at home, and computer self-efficacy (e.g., duration of web portal usage, computer usage skills, and Internet usage skills). The second part included
us
self-initiative. Evaluation of the web portal design-related factors in terms of effectiveness of the
an
information services, ease of use, content, availability, speed, and aesthetics were the third part
M
of the questionnaire.
The last part collected information on the usability of the information services of the web portal
ed
in terms of frequency and satisfaction of use on the WPIS. The information services of the web portal entailed downloading of lectures, downloading of on-the-job training forms, evaluating
ce pt
online teacher’s evaluation form, visiting a forum, and viewing class schedule, taken subjects, account balances, grades, and subject offerings (See Figures 2 and 3.). The questionnaire can be answered in 5-10 minutes time. The items of the student-related factors, web portal designrelated factors, and usability of the WPIS are shown in Tables 1-3.
Ac
Downloaded by [Rex Bringula] at 02:40 13 June 2016
student-related factors in terms of commitment to the use of the WPIS, isomorphic pressures, and
Participants used the five-point Likert type scale (1 – Strongly disagree to 5 – Strongly agree) on answering each question of student-related factors, web portal design-related factors, and satisfaction of use of WPIS. On the other hand, frequency of use of information services was measured using the scale of 1 (never) to 5 (very often). Computer self-efficacy was measured in
14
terms of duration of use of the web portal (1 – less than one semester usage, 2 – one semester, 3 – two semesters, 4 – three semesters, 5 – four semesters, and 6 – more than 4 semesters), computer and Internet usage skills (1 – Not skilled to 5 – Highly skilled).
us
an
There was an almost equal number of participants in terms of gender (male, f = 89, 51%; female,
M
f = 85, 49%). The participants’ average age was 19 years old. All colleges of the university were represented (Arts and Sciences, f = 29, 17%; Business Administration, f = 45, 26%; Computer
ed
Studies, f = 28, 16%; Dentistry, f = 41, 24%; Education, f = 10, 6%; and Engineering, f = 21,
ce pt
12%). Every school level was also represented (first year, f = 20, 12%; second year, f = 72, 41%; third year, f = 29, 17%; fourth year, f = 52, 30%; and fifth year, f = 1, 1%). Most had computer (f = 162, 93%) and Internet (f = 158, 91%) access at home. Before the questionnaires were distributed, it was pretested to 40 students to determine its
Ac
Downloaded by [Rex Bringula] at 02:40 13 June 2016
cr
ip t
The survey forms were distributed to all six colleges of the university. There were 18,649 students in the university at the time of the study. Using Sloven’s formula, the computed sample size was 100 (n = 1/(1 + Ne2); e = 0.10; N = 18,649). The questionnaires were distributed during class sessions. Class sections were randomly selected. Classroom numbers were written on a piece of paper and randomly picked out. With the permission of the teacher, the questionnaire was distributed to their students. The teacher assisted the researchers in distributing the forms. It was decided to distribute the survey forms in this location because of time constraint (i.e., less disruption of classes). Two hundred forty survey forms were distributed (40 survey forms per college) to accommodate non-usable forms. There were 174 usable forms retrieved and these were all used in the analysis. Data gathering lasted for one month. No monetary incentives were given to the participants due to a university policy.
validity and reliability. The students in the pretest were excluded in the sample. Factor analysis with a threshold of 0.50 and Cronbach’s alpha values of at least 0.70 were employed to determine the validity and reliability of the instrument, respectively. The results of the validity and reliability tests were shown in Table 1, Table 2, and Table 3.
15
Canonical correlation analysis was employed in an attempt to address the research gap. The canonical variates were interpreted as beta coefficients (Meyers et al., 2013). Variates with at least 0.30 value were retained and interpreted.
ip t
Study 2 The second study gathered subjective and objective measures of usability. In terms of the
cr
subjective measures, the same instrument in Study 1 was utilized. Time completion of tasks
us
components of the objective measure of usability. Participants were given five tasks to complete.
an
These were downloading a lecture, showing the semester the participants have taken a programming course, showing the room or laboratory assignment of their first class, showing the
M
grade in a programming course, and finding the posted announcement by a teacher in an online forum. Participants were given five minutes to complete each task. The experiment was
ed
conducted in one laboratory with an Internet connection of 22 Mbps.
ce pt
The researcher gave the tasks to the participants. The observer in turn recorded the length of time the participants spent doing the tasks. The participants would inform the observer that the task was completed. Problems encountered in using the WPIS were gathered through interviews. Interviews were conducted after all tasks were completed. Data gathering lasted for three weeks.
Ac
Downloaded by [Rex Bringula] at 02:40 13 June 2016
(measured in seconds), problems encountered in doing the tasks, and success rates were the
The participants (n = 86) of the study consisted of second (f = 43, 50%), third (f = 33, 38%), and fourth (f = 10, 12%) year computing (Computer Science and Information Technology) students enrolled in human-computer interaction course. Since the tasks to be completed are teacherdependent (e.g., if teachers do not use the portal, the student has nothing to download), only the
16
students of the researcher were involved. There were 87 students but only 86 participated. The one non-participating students did not complete the experiment due to absences. No monetary incentives were given to the participants since this was not allowed by the university. Instead,
ip t
participants received a 50-point credit as a seatwork. There were 68 (79%) male and 18 (21%) female participants. The average age of the participants was 19 years old. Canonical correlation
cr
was employed to determine which of the subjective and objective measures could influence the
us an
Results
M
Table 4 shows the student-related factors in terms of computer self-efficacy, commitment to the use of the WPIS, isomorphic pressure, and self-initiative. Students in Study 2 had been
ed
using the WPIS longer (at least 5 semesters) than the students in Study 1 (at least 4 semesters). Students in Study 2 were more skilled in using the computer (mean = 3.62) and the Internet
ce pt
(mean = 3.90) than the students in Study 1 (Computer skill = 3.40; Internet usage skill = 3.48). Study 2 participants were more committed to the use of the WPIS (mean = 3.51) than the Study 1 participants (mean = 3.24). The findings showed that that isomorphic pressure played a role in using the system to a lesser extent for both set of participants (Study 1, normative pressure = 2.89; Study 2, normative pressure = 2.98). On the other hand, they reported it was their own
Ac
Downloaded by [Rex Bringula] at 02:40 13 June 2016
web portal usability services.
decision to utilize the WPIS. As can be gleaned from Table 5, both set of participants agreed that the WPIS was easy to use (Study 1 = 3.51; Study 2 = 3.80). They perceived that the content (Study 1 = 3.87; Study 2 = 3.76) of the WPIS was adequate. The software got favorable mean ratings of 3.89 in terms of availability for both set of participants. This indicates that it was accessible whenever the
17
students need the information services of the web portal. They perceived that the WPIS was an effective (Study 1 = 3.89; Study 2 = 3.80) tool as an information provider. Availability and effectiveness got the highest mean ratings. Study 2 participants had lower mean rating in terms of speed (mean = 3.48) and aesthetics (mean = 3.33) than the Study 1 participants (Speed, mean = 3.60; Aesthetics, mean = 3.76). Overall, all participants perceived that the WPIS had a good design.
ip t
Table 6 shows the time to complete task and the success rates in completing the 5 tasks of
cr
participants in Study 2. The fastest task completed was finding the message posted in the forum.
Meanwhile, the slowest task completed was finding the semester where the Study 2 participants
us
seconds. At the first task, it has been observed that 20 participants had difficulty in using the
an
portal. They tended to click every button in the dashboard (Figure 2-f) while trying to find the appropriate button. However, after the first task was completed, they learned which button was
M
appropriate for the task at hand and no problems were encountered afterwards. Follow up interviews with the 20 participants confirmed that they were in agreement that they clicked many
ce pt
ed
buttons because they wanted to memorize first the interface of the system.
Table 7 shows the usability ratings of both sets of participants. Both sets of participants least utilized the downloading of OJT forms (Study 1 = 2.17; Study 2 = 1.94). Use of online teachers’ evaluation form (Study 1 = 3.30; Study 2 = 3.45), viewing of subject offerings (Study 1 = 3.40;
Ac
Downloaded by [Rex Bringula] at 02:40 13 June 2016
took the Introductory Programming. Interestingly, all tasks were completed in less than 30
Study 2 = 3.12), and visiting of forums (Study 1 = 2.94; Study 2 = 2.15) were utilized on occasional basis. The most utilized information service was viewing of grades (Study 1 = 3.91; Study 2 = 4.26). Both participants of the study used the WPIS on a regular basis in terms of downloading of lectures (Study 1 = 3.57; Study 2 = 3.90). However, Study 1 participants had
18
higher usage of the WPIS in terms of viewing of class schedule (Study 1 = 3.57), viewing of subjects taken (Study 1 = 3.62), and viewing of account balances (mean = 3.53) than the Study 2 participants (viewing of class schedule = 3.34; viewing of subjects taken = 3.38; viewing of
ip t
account balances = 3.38). Lastly, they were satisfied with the WPIS (Study 1 = 3.75; Study 2 =
an
us
Tables 8-10 show the results of canonical correlation analysis on the data. Success rate was excluded in the analysis since all tasks were completed successfully. Two functions were extracted in the analysis in both studies. In the first study, the first function had an eigenvalue of 1.84 with an associated variance of 91%. The canonical correlation and its squared value between variates were found to be 0.80 and 0.65, respectively. On one hand, the second function had an eigenvalue of 0.19 with 9% explained variance. The canonical correlation and the squared value of the second function were found to be 0.40 and 0.16, respectively. It was found out that the relationship between the sets of variables was statistically significant (Wilks’ lambda = 0.30, Rc2 = 0.70, Approximate F(24,318) = 11.17, p < 0.001). The Cramer-Nicewander Index is 0.40.
M
In Study 2, the first function had an eigenvalue of 2.47 with an associated variance of 92%. The canonical correlation and its squared value between variates were found to be 0.84 and 0.42,
ed
respectively. The second function had an eigenvalue of 0.22 with 8% explained variance. The
ce pt
canonical correlation and the squared value of the second function were found to be 0.42 and 0.18, respectively. The relationship between the sets of variables was statistically significant (Wilks’ lambda = 0.24, Rc2 = 0.76, Approximate F(26,142) = 5.78, p < 0.001). The CramerNicewander Index is 0.44.
Ac
Downloaded by [Rex Bringula] at 02:40 13 June 2016
cr
3.70).
Dimension reduction analysis (Table 9) showed that both roots were statistically significant. However, upon inspection of eigenvalues and squared canonical correlations, only the first functions of both studies could contribute to explaining the issue under study. Thus, only the first functions were retained and explained in the analysis.
19
Table 10 shows the structure coefficients of the two canonical functions for both studies. However, as mentioned above, only the fist functions were interpreted. Variates with structure coefficient (Rc) of less than 0.30 were not interpreted. The results in Study 1 shows that
ip t
Initiative (Rc = 0.66), Effectiveness (Rc = 0.82), Content (Rc = 0.89), Availability (Rc = 0.64), Speed (Rc = 0.77), and Aesthetics (Rc = 0.63) both predicted Frequency of Use (Rc = 0.68) and
cr
Satisfaction (Rc = 0.92). The final canonical model is shown in Figure 4. It is worth noting that
us
0.86; Ease of Use = 0.68; Content = 0.69; Availability = 0.69; Speed = 0.66; and Aesthetics =
an
0.34) were also the predictors in Study 1 with an addition of Commitment (Rc = 0.76). Time to
ed
Discussion
M
complete the tasks was not a significant predictor of Frequency of Use and Satisfaction.
This study attempted to determine the multiple factors that influenced both frequency and
ce pt
satisfaction of use of web portal information services. Toward this aim, two studies were conducted. The first study solicited subjective measures of usability. The second study solicited subjective and objective measures of usability. It was revealed that participants of both studies were knowledgeable about the WPIS. However, participants in the first study reported that they were skilled in using computers and the Internet to a moderate extent. On the other hand, the
Ac
Downloaded by [Rex Bringula] at 02:40 13 June 2016
the predictors of Frequency of Use and Satisfaction in Study 2 (Initiative = 0.56; Effectiveness =
participants in the second study disclosed that they were skilled in using computers and the Internet. This is not surprising since Study 2 participants are exposed to computers and the Internet.
20
It was shown that Study 1 participants were less committed to using the WPIS than the Study 2 participants. However, both set of participants further revealed that teachers, classmates, and friends had a slight influence in persuading them to use the WPIS. They attributed their use of
ip t
the WPIS to their self-initiative. It must be noted that there is no institutional policy enjoining the use of the WPIS and that there is no equivalent grade incentives or recognition given to students
cr
who used the WPIS. They utilized the WPIS not because of pressures from external forces or
us
This finding can be explained by the fact that students had a high appreciation on the
an
effectiveness of the system. They perceived that the WPIS saves time and effort in storing and retrieving information since it provides accessible information. For example, before WPIS was
M
installed in the university, students tracked their credit units by accumulating their grade cards. Students had to keep these records throughout their college years in order to keep track of their
ed
earned units. Students may lose these records through the course of time. On the other hand,
ce pt
WPIS offered viewing of taken subjects with accompanying grades. These capabilities allowed students to keep track of the subjects they have already taken and may use this information to plan on the courses they will be taken on the following semesters. The convenience of having this information anytime, anywhere resulted to its high rating.
Ac
Downloaded by [Rex Bringula] at 02:40 13 June 2016
they were obliged to do so; instead, it was their own decision to use the WPIS.
Moreover, WPIS is able to store and disseminate lecture notes of teachers. These educational materials can be distributed electronically by a teacher to all students before, during, or after class sessions. Students can save time and costs of photocopying the materials since these are automatically sent to their individual accounts. Each student will receive the teacher’s lecture
21
notes and therefore, can have equal access to information. These files will be available throughout the semester and may be downloaded whenever they are needed. Study 1 participants utilized frequently five of the nine elements of WPIS while Study 2
ip t
participants frequently used two information services. Both participants used downloading of
cr
lectures and viewing of grades frequently. They were in agreement that downloading of OJT forms, online teachers’ evaluation, viewing of subject offerings, and visiting forums were
us
since they were only done on semestral basis. For instance, evaluating a teacher’s performance is
an
only conducted once a semester. This is also the same with downloading of OJT forms and viewing of subject offerings. As to forums, students will only visit this module when a teacher
M
has to post an important announcement that the latter had forgotten to disseminate during the
ed
class.
Meanwhile, it can be noted that all participants had high satisfaction on the information
ce pt
services provided by the web portal. They agreed that the services were suited to their needs and they were pleased with them. They perceived that it was a right decision to use the WPIS. Bringula and Basa (2011) argued that usability of a system was a combination of frequency of use and satisfaction. This present study provided empirical evidence that the whole picture of
Ac
Downloaded by [Rex Bringula] at 02:40 13 June 2016
utilized on occasional basis. It is understandable that these services were not fully optimized
usability was both explained by frequency and satisfaction of use.
WPIS was evaluated in terms of its design dimensions. Both sets of participants perceived that the information services were designed effectively. They further believed that the software was easy to use. Availability, effectiveness, and content had the top mean ratings of all the factors.
22
These findings revealed that participants perceived that the WPIS services are available whenever they need them. It is a good indication that the University is committed to providing the students valuable, comprehensive, reliable, and appropriate information that are easily
ip t
obtainable whenever the need arises. However, Study 2 participants had lower ratings in terms of Speed and Aesthetics. This can be explained by the fact that Study 2 participants are exposed to
cr
more advanced and faster computers and are very knowledgeable in website designs.
us
the WPIS is appropriate to the needs of the organization and students; hence, the objectives of
an
the WPIS were achieved.
The results of the laboratory experiment shown in Table 6 showed that it was very easy for the
M
participants to find the message posted in the forum. This is because posted messages of a teacher are automatically shown at the left side of the dashboard. In this manner, students are
ed
quickly notified about posted messages. On the other hand, it took a longer time to identify the
ce pt
semester the participants took Introductory Programming course. This is because students had to scroll through the web pages and find the specific school year and semester of a course. Remarkably, all these tasks were completed within a span of less than 30 seconds. Canonical correlation analysis showed that both studies confirmed that the combination of
Ac
Downloaded by [Rex Bringula] at 02:40 13 June 2016
Nonetheless, all participants had favorable ratings in the overall design of the WPIS. To this end,
independent variables such as initiative, effectiveness of the WPIS, ease of use, content, availability, speed, and aesthetics both predicted frequency and satisfaction of use. It is interesting to note that commitment was found to be a unique significant predictor in Study 2. All predictor and predicted variables proved positive. These indicate that the increased frequency
23
and satisfaction of use of WPIS all accounted for the positive initiative of the students to use the WPIS, commitment to the use of the WPIS, clear-cut effectiveness of the WPIS, and welldesigned WPIS.
ip t
Initiative was a consistent indicator of student-related factors that influenced usability of WPIS.
cr
The finding implies that external forces such as influence of other people were not necessary to attain usability of the WPIS. Instead, the internal drive of the students due to realization of the
us
imposing the use of the technology, educational technology developers and school administrators
an
should ensure that the technology is relevant to the information needs of the stakeholders. In other words, relevant information services warrant usability of the system. In fact, canonical
ed
predictors.
M
correlation analysis revealed that Content had the highest predictive coefficient of all the
For Study 2 participants, commitment further explains the variability in the WPIS usability. This
ce pt
factor was not found significant in the first study. This offers a clear finding in web portal services usability. As previously shown, Study 2 participants had lower rating in terms of speed and aesthetics of the WPIS. While they may perceived that the portal had relatively slow web page loading and a moderately acceptable design, commitment ensures utilization of the WPIS.
Ac
Downloaded by [Rex Bringula] at 02:40 13 June 2016
benefits of using WPIS urges them to use the technology. The result suggests that instead of
In fact, commitment had the second highest structure coefficient in predicting WPIS usability. Thus, commitment is a binding force for technical users to use the WPIS. It is worth noting that two variables of student-related factors (i.e., initiative and commitment) and all of the design-related factors predicted WPIS usability. The result is a vivid contribution
24
to information systems management in the context of web portal information services. First, the result indicates that initiative, commitment, and design-related factors influence the two dimensions of WPIS usability. Second, it was shown that WPIS usability was more sensitive to
ip t
design-related factors. In order to ensure that the information services are used optimally, web designers are encouraged to plan meticulously the development of the system. Initial interviews
cr
or participatory approach may be employed to determine the students’ needs.
us
in other studies where effectiveness was considered as a dimension of usability, this study
an
purported that it was a design factor. The result of the study showed that effectiveness was indeed a design factor and not as an outcome of a usable system. This discrepancy can be
M
explained by the fact that usability is context-dependent as suggested by Sindhuja and Dastidar (2009), and Granic et al. (2011). The finding implies that usability would be achieved if it was
ed
designed effectively in the first place. In other words, usability starts at the successful and
ce pt
effective design considerations (Snider and Martin, 2012). It can be noticed that all design factors influenced both usability indicators. In terms of ease of use, the findings of the study were found to be similar to the studies of Tarafdar and Zhang (2005), and Santosa (2009). This confirms that usable web portal services are a product of an
Ac
Downloaded by [Rex Bringula] at 02:40 13 June 2016
It is worth noting that effectiveness of the WPIS was a significant predictor of usability. Unlike
easy-to-use design. Similarly, the quick response time of the web pages positively influence usability of the WPIS. Tarafdar and Zhang (2005) were in agreement with this finding. Availability of its appropriate, relevant, and up-to-date content ensures higher frequency of usage and satisfaction. These were in agreement with the findings of Tarafdar and Zhang (2005),
25
Cheung and Lee (2009), and Bringula (2013). This study also supports the findings of Teoh et al. (2009), Wells et al. (2011), and Liao et al. (2011) in terms of aesthetics. Lastly, the study revealed that WPIS usability entails combination of technical and non-technical
ip t
aspects. Nonetheless, the technical design considerations outweigh the non-technical aspects.
cr
This is because the barrier of non-familiarity or lack of skills in using computers and the Internet
can be addressed through training and orientation. In contrast, users cannot do an outright change
us
M
an
software developers heed to the design recommendations of the users.
ed
Conclusions, Limitations, and Recommendations This study attempted to determine if the combination of the student-, web portal design-, and
ce pt
objective measure-related factors might explain the usability of web portal information services. It was revealed that initiative and commitment of student-related factors and all factors of design considerations positively influenced both the frequency and satisfaction of use of the WPIS. Thus, the null hypothesis stating that the predictor variable set cannot explain any of the variance
Ac
Downloaded by [Rex Bringula] at 02:40 13 June 2016
to the design of the features of the WPIS. Changes in the system can only be instituted when the
of the dependent variables was rejected. Initiative and commitment, not isomorphic pressure, positively influenced the frequency and satisfaction of use of WPIS. This may be attributed to the participants’ affirmative perception of relevant content of the WPIS. It can be concluded that while the usability of the WPIS were both
26
influenced by technical and non-technical aspects, the system was more sensitive to the former factors. The study provided empirical evidence that usability was both measured in terms of frequency and satisfaction of use. Further, contrary to popular notion, it was revealed that
ip t
effectiveness of a system was a design consideration and not an outcome of usability.
cr
The canonical model presented by the study had an explanatory power of at most 44%. This
means 44% in the variability of usability of the WPIS accounted for the predictor variables. The
us
to-date-ness of exam schedule and important dates (Snider and Martin, 2012) may be included as
an
possible predictor variables. Attitudes towards the use of the WPIS may also be incorporated (Tarafdar and Zhang, 2005; Santosa, 2009). Learnability of a system may also contribute in
M
increasing the predictive power of the model (Joo and Lee, 2011).
ed
At the time the study was conducted, the web portals of two other schools were in the development stage. Initial interviews with the researcher’s colleagues revealed that the portal of
ce pt
another school has its own portal design. Some of the features (e.g., student enrolment, uploading /downloading of lectures) are not yet present in other schools’ portal. The researcher found that it would be difficult to evaluate other portals with different designs and capabilities. Inclusion of other student web portal services may not be plausible at this moment.
Ac
Downloaded by [Rex Bringula] at 02:40 13 June 2016
remaining variability may be explained by other variables not captured in the present study. Up-
In light of these limitations, it is recommended that excluded variables be included in future investigations. In terms of practice, the results are valuable in ensuring the web portal information services usability. The findings may serve as guide for web portal developers. Finally, it will be easier for school administrators to convince its stakeholders to use the web
27
portal information services by emphasizing the convenience and relevance of using the technology.
ip t
Acknowledgements References
cr
Ashworth, R., Boyne, G., & Delbridge, R. (2009). Escape from the iron cage? Organizational
us
and Theory, 19, 165-187. doi:10.1093/jopart/mum038.
an
Bringula, R. P.(2013). Influence of faculty- and web portal design-related factors on web portal
10.1016/j.compedu.2013.05.008.
M
usability: A hierarchical regression analysis. Computers & Education, 68, 187-198.doi:
ed
Bringula, R. P., & Basa, R. S. (2011). Factors affecting faculty web portal usability. Educational Technology & Society, 14 (4),253–265.
ce pt
Brooks, P., & Hestness, B.(2010).User measures of quality of experience: Why being objective and quantitative is important. IEEE Network, 24(2),8-13. Brouthers, L. E., O’ Donnell, E., & Keig, D. L. (2013). Isomorphic pressures, peripheral product, attributes, and emerging market firm export performance. Management International Review, 53,
Ac
Downloaded by [Rex Bringula] at 02:40 13 June 2016
change and isomorphic pressures in the public sector. Journal of Public Administration Research
687-710.
Chan, S.-C., & Tung, F.-C. (2008). An empirical investigation of students’ behavioural intentions to use the online learning course websites. British Journal of Educational Technology, 39(1), 71–83. http://dx.doi.org/10.1111/j.1467-8535.2007.00742.x.
28
Cheung, C. M. K. & Lee, M. K. O. (2009). User satisfaction with an Internet-based portal: An asymmetric and non-linear approach. Journal of the American Society for Information Science and Technology, 60(1), 111-122.doi: 10.1002/asi.20946.
ip t
Compeau, D. R., & Higgins, C. A. (1995). Computer self-efficacy: development of a measure
cr
and initial test. MIS Quarterly, 19(2), 189–211.
Cyr,D.(2008).Modeling website design across cultures: Relationships to trust, satisfaction, and e-
us
an
1222240402.
DiMaggio, P. J. & Powell, W. W. (1983). The iron cage revisited: Institutional isomorphism and
M
collective rationality in organizational fields. American Sociological Review, 48(2), 147-160. Filippi, S. & Barattin,D.(2012).Generation, Adoption, and Tuning of Usability Evaluation
ed
Multimethods.International Journal of Human-Computer Interaction,28(6),406-422, DOI: 10.1080/10447318.2011.607421.
ce pt
Granic,A., Mitrovic, I., & Marangunic,N.(2011).Exploring the usability of web portals: A Croatian case study. International Journal of Information Management, 31, 339-349. doi:10.1016/j.ijinfomgt.2010.11.001.
Herman,L.(1996).Towards effective usability evaluation in Asia:Cross-cultural differences.
Ac
Downloaded by [Rex Bringula] at 02:40 13 June 2016
loyalty.Journal of Management Information Systems, 24(4),47-72.doi:10.2753/MIS0742-
Proceedings from the 6th Australian Conference on Computer-Human Interaction (OZCHI '96).Los Alamitos, CA: IEEE Computer Society Press. International Standard Organization (ISO). (1998). ISO 9241-11: Ergonomic requirements for office work with Visual Display Terminals (VDTs): Guidance on usability specification and
29
measures (Part 11). Geneva, Switzerland: International Standard Organization. Available at http://www.iso.org/iso/catalogue_detail.htm?csnumber=16883. Joo, S. & Lee, J. Y. (2011). Measuring the usability of academic digital libraries: Instrument and
validation.
The
Electronic
Library,
523-537.doi:
cr
10.1108/02640471111156777.
29(4),
ip t
development
Koneru, I. (2006). Strategic and collaborative approaches for fostering information literacy via
us
an
Koohang, A. & Ondracek, J. (2005). User’s views about the usability of digital libraries. British Journal of Educational Technology, 36(3), 407-423.
M
Lee, H. S., Choi, Y. H., & Jo, N. O. (2009). Determinants affecting user satisfaction with campus portal services in Korea. Journal of Internet Banking and Commerce, 14(1), 1-18.
ed
Lee, H. S. (2008). Influencing factors on user satisfaction with campus portal services. The Academy of Customer Satisfaction Management, 10(2),35-52.
ce pt
Letha, M. M. (2006). Library portal: A tool for web-enabled information services.DESIDOC Bulletin of Information Technology, 26(5), 11-16. Li, F. & Ding, D. Z. (2013). The effect of institutional isomorphic pressure on the internationalization of firms in an emerging economy: Evidence from China. Asia Pacific
Ac
Downloaded by [Rex Bringula] at 02:40 13 June 2016
an information portal. DESIDOC Bulletin of Information Technology, 26(6), 3-12.
Business Review, 19(4), 506-525.doi: 10.1080/13602381.2013.807602. Liao, C., To, P.-L., Liu, C.-C., Kuo, P.-Y., & Chuang, S.-H.(2011). Factors influencing the intended use of web portals. Online Information Review, 35(2), 237 - 254
30
Maddux, J. E. (2007). Self-efficacy. In Encyclopedia of Social Psychology. (Vol. 2, pp. 814817). Thousand Oaks, CA: SAGE Reference. Meyer, J. P., & Herscovitch, L. (2001). Commitment in the workplace toward a general model.
ip t
Human Resource Management Review, 11(3), 299–326.
us
Navarro, J.-G. C. & Rodriguez, F. J. C. (2012). Factors affecting the use of an e-learning portal
an
at university. Journal of Educational Computing Research, 46(1), 85-103.
Nielsen, J. (1993), Usability Engineering. Cambridge, MA: Academic Press.
M
Palladino, J. (2006). Efficacy theory. In Encyclopedia of Educational Leadership and Administration. (Vol. 1, pp. 327-328). Thousand Oaks, CA: SAGE Reference.
ed
Sandvig, J. C., & Bajwa, D. (2004). Information seeking of university web sites: an exploratory
ce pt
study. The Journal of Computer Information Systems, 45(1), 13–22. Santosa, P. I. (2009). Usability of e-learning portal and how it affects students’ attitude and satisfaction: An exploratory study. In Proceedings of PACIS 2009, paper 71. Retrieved from http://aisel.aisnet.org/pacis2009/71.
Ac
Downloaded by [Rex Bringula] at 02:40 13 June 2016
interpretation 2nd edn.USA: Sage Publications, Inc.
cr
Meyers, L. S., Gamst, G., & Guarino, A. J. (2013). Applied multivariate research: Design and
Saracevic, T. (2004). Evaluation of digital libraries: an overview. In M. Agosti & N. Fuhr (Eds.), Notes of the DELOS WP7 Workshop in the Evaluation of Digital Libraries (pp. 1-13). Padua, Italy. Retrieved from https://comminfo.rutgers.edu/~tefko/DL_evaluation_Delos.pdf.
31
Sindhuja, P. N., & Dastidar, S. G. (2009). Impact of the factors influencing website usability on user satisfaction. The IUP Journal of Management Research, 8(12), 54–66. Snider, J. & Martin, F. (2012). Evaluating web usability. Performance Improvement, 51(3), 30-
ip t
40. Doi: 10.1002/pfi.21252.
cr
Tarafdar, M., & Zhang, J. (2005). Analyzing the influence of web site design parameters on web
us
Teo, H. H., Wei, K. K., & Benbasat, I. (2003). Predicting intention to adopt interorganizational
an
linkages: An institutional perspective. MIS Quarterly, 27(1), 19–49.
Teoh, K. K., Ong, T. S., Lim, P. W., Liong, R. P. Y., & Yap, C. Y. (2009). Explorations on web
M
usability. American Journal of Applied Sciences, 6(3), 424-429.
Wells, J. D., Valacich, J. S., Hess, T. J.(2011). What signal are you sending? How website influences
perceptions
of
product
ed
quality
quality
and
purchase
intentions.MIS
Quarterly,35(2),373-396.
ce pt
Zhang, X., Prybutok, V., & Huang, A. (2006). An empirical study of factors affecting e-service satisfaction. Human Systems Management, 25, 279–291.
Ac
Downloaded by [Rex Bringula] at 02:40 13 June 2016
site usability. Information Resource Management Journal, 18(4), 62–80.
32
Figure 1. Research Framework of the Study
Independent Variables
Dependent Variables
ip t
Duration CompSkill
cr
InternetSkill
us
Pressure
Effectiveness
SR- and WP Design-Related Factors
Availability Speed
ce pt
Aesthetics
ed
Content
WPIS Usabilit
M
Ease
an
Initiative
Time to Complete Task
Success Rate
Ac
Downloaded by [Rex Bringula] at 02:40 13 June 2016
Commit
33
Frequency Satisfaction
us an M
(b) OJT Online Form
ce pt
ed
(a) Lecture Notes
Ac
Downloaded by [Rex Bringula] at 02:40 13 June 2016
cr
ip t
Figure 2. Student Web Portal Information Services
(c) Subjects Taken
(d) Class Schedule
34
ip t cr us
an
(f) Student Portal Dashboarb
ce pt
ed
M
Performance
Ac
Downloaded by [Rex Bringula] at 02:40 13 June 2016
(e) Online Student Evaluation on Faculty
35
us an
(b) Grades Viewer
ce pt
ed
M
(a) Account Balances
Ac
Downloaded by [Rex Bringula] at 02:40 13 June 2016
cr
ip t
Figure 3. Web Portal Information Services (continuation)
(d) Forum
(c) Subject Offering
36
Figure 4. Canonical Correlation between the Canonical Variates (Study 1) Initiative 0 66 0 62
Ease Content
SR- and WP Design-Related Factors
0 89
0 80
Speed 0 63
ce pt
ed
M
an
Aesthetics
0 92
us
0 77
Ac
Downloaded by [Rex Bringula] at 02:40 13 June 2016
Availability
0 68
Frequency
Satisfaction
cr
0 64
WPIS Usabilit
ip t
Effectiveness
37
Figure 5. Canonical Correlation between the Canonical Variates (Study 2)
Commitment 0 76
0 56 0 86 SR- and WP Design-Related Factors
Ease
0 69
Availability 0 66
an
Speed 0 34
ce pt
ed
M
Aesthetics
WPIS Usabilit
0 71
0 97
us
0 69
Ac
Downloaded by [Rex Bringula] at 02:40 13 June 2016
Content
0 84
Frequency
cr
Effectiveness
ip t
Initiative
38
Satisfaction
Table 1. Validity and Reliability of Student-Related Factors factor loadings
ip t
Indicators
cr
(f.l.)
0.757
0.656
0.872
ed
M
I feel obliged to use the portal.
I am dedicated to use the portal.
us
an
No matter how busy, I find time to use the portal.
0.878
One of my responsibilities is to use the portal.
0.821
ce pt
Using the portal is one of the duties of a student.
Isomorphic Pressure (α = 0.810)
Ac
Downloaded by [Rex Bringula] at 02:40 13 June 2016
Commitment to the Use of the WPIS (α = 0.854)
My classmates are using the portal so I have to use it too.
39
0.899
0.838
My teachers are using the portal so I have to use it too.
0.841
ip t
My friends are using the portal so I have to use it too.
0.621
cr
My teachers are requiring us to use the portal.
us an
It is my own decision to use the portal.
0.785
0.717
M
I use the portal even without university policy.
I use the online library resources in the portal even without additional
ed
0.864
ce pt
grade incentives.
I use the online library resources in the portal without thinking of recognition.
Ac
Downloaded by [Rex Bringula] at 02:40 13 June 2016
Self-initiative (α = 0.799)
40
0.805
Table 2. Validity and Reliability of Web Portal Design-Related Factors Indicators
f.l.
ip t
Effectiveness of Information Services (α = 0.890)
us
cr
0.936
an
Services offered in the portal saves effort.
M
Services offered in the portal increase my effectiveness in learning.
0.909
0.899
0.723
ed
Services offered in the portal increases access to information.
ce pt
Ease of Use (α = 0.907)
All links redirect the user to the correct web pages.
0.854
All links redirect the user to working web pages.
0.882
Ac
Downloaded by [Rex Bringula] at 02:40 13 June 2016
Services offered in the portal saves time.
Users can easily go from one web page to another.
0.790
Users do not feel “lost” or “confused” when browsing web pages.
0.803
41
0.848
Services offered by the portal are easy to use.
0.788
ip t
There are no “dead” links – links that do not function.
cr
Content (α = 0.870)
us
0.902
an
Services offered are reliable.
ed
Availability (α = 0.871)
0.884
0.890
M
Services offered are appropriate to my needs.
ce pt
The portal is always accessible – 24 hours a day, 7 days a week.
0.611
The portal can be accessed at home.
0.737
The portal can be accessed at internet cafés.
0.815
Downloading of online library resources is always available.
0.856
Ac
Downloaded by [Rex Bringula] at 02:40 13 June 2016
Services offered are comprehensive.
42
0.831
Services offered by the portal are always available.
0.862
ip t
Services offered by the portal are always functional.
cr
Speed (α = 0.909)
us
0.882
M
Search results are presented quickly.
an
Web pages responded fast to online search.
0.904
0.920
0.848
ed
The portal does not hang when downloading multiple files.
ce pt
Aesthetics (α = 0.940)
The layout of the portal is attractive.
0.737
The portal has a pleasant atmosphere.
0.882
The portal has a comfortable atmosphere.
0.893
Ac
Downloaded by [Rex Bringula] at 02:40 13 June 2016
Web pages are accessed fast.
43
0.886
The colors that are used on the portal do not strain the eyes.
0.929
ip t
The colors that are used on the portal are attractive.
0.806
cr
Font sizes and font styles are legible.
ce pt
ed
M
an
us
0.870
Ac
Downloaded by [Rex Bringula] at 02:40 13 June 2016
Overall, I find that the portal looks attractive.
44
Table 3. Validity and Reliability of Usability of WPIS Indicators
f.l.
us
cr
0.846
ed
Viewing class schedule
M
Evaluating teacher’s performance
an
Downloading OJT forms
0.621
0.803
0.819
0.879
ce pt
Viewing list of taken subjects
Viewing of account balances
0.862
Viewing of grades
0.859
Ac
Downloaded by [Rex Bringula] at 02:40 13 June 2016
Downloading lecture notes
ip t
Frequency of Use of Information Services (α = 0.876)*
Viewing of subject offerings
0.905
Visiting a forum
0.820
45
Satisfaction of Use of Information Services (α = 0.854)
0.842
ip t
I am pleased with the services offered by the portal.
us an M ed ce pt Ac
Downloaded by [Rex Bringula] at 02:40 13 June 2016
Using services offered by the portal is a wise decision.
0.905
cr
Services offered by the portal are suited to my needs.
46
0.907
Table 4. Student-Related Factors
Mean
Study 2
Verbal
Mean
Verbal
Interpretation
us
Interpretation
Web Portal
an
5.33
M
Computer Self-efficacy
Computer Usage Skill
3.40
Moderately skilled
3.62
Skilled
Internet Usage Skill
3.48
Moderately skilled
3.90
Skilled
3.24
Moderately agree
3.51
Agree
2.89
Moderately agree
2.98
More than 4
Duration of Use of the 4.14
ce pt
ed
semesters
More than 5 semesters
Commitment to the Use of the Web Portal IS
Ac
Downloaded by [Rex Bringula] at 02:40 13 June 2016
ip t
Study 1
cr
Student-Related Factors
Moderately
Normative Pressure to Use
agree
the Web Portal IS
47
ed
ce pt
Ac
ip t
cr
us
an
M
Downloaded by [Rex Bringula] at 02:40 13 June 2016
Self-initiative to Use the 3.74 Agree
48
3.65 Agree
Web Portal IS
ip t
Table 5. Web Portal Design-Related Factors Study 1
Study 2
Verbal
Mean
Verbal Interpretation
Mean
3.89
Agree
3.80
Agree
Ease of Use
3.51
Agree
3.66
Agree
Content
3.87
Agree
3.76
Agree
Availability
3.89
Agree
3.89
Agree
Speed
3.60
Agree
3.48
Moderately agree
Aesthetics
3.76
Agree
3.33
Moderately agree
Overall mean
3.75
Agee
3.65
Agree
ce pt
ed
M
an
Effectiveness
us
Interpretation
Ac
Downloaded by [Rex Bringula] at 02:40 13 June 2016
Factors
cr
Design
49
Table 6. Time Spent Completing a Task and Success Rates % of Participants Completed Task
Time Spent (seconds)
semester
of 12.1
an
Introductory Programming
Finding the schedule of a first
ce pt
Introductory Algebra
ed
Finding the grade of the
100%
100%
M
7.7
class
100%
cr
the
7.5
100%
6.8
100%
8.6
100%
Find the message posted in the forum
Ac
Downloaded by [Rex Bringula] at 02:40 13 June 2016
Finding
8.94
us
Downloading a lecture
ip t
the Task
AVERAGE
50
Table 7. Frequency and Satisfaction of Use of Web Portal Information Services (WPIS) Verbal
Verbal Usability
Mean
Mean
Interpretation
ip t
Interpretation
3.57
Often
Downloading of OJT forms
2.17
us
cr
Downloading of lectures
Often
Sometimes
3.45
Sometimes
3.57
Often
3.34
Sometimes
Viewing of subjects taken
3.62
Often
3.38
Sometimes
Viewing of account balances
3.53
Often
3.38
Sometimes
Viewing of grades
3.91
Often
4.26
Often
Viewing of subject offerings
3.40
Sometimes
3.12
Sometimes
an
Rarely
Using online teachers’ evaluation
Rarely
3.90
1.94
M
3.30
ed
form
ce pt
Viewing of class schedule
Ac
Downloaded by [Rex Bringula] at 02:40 13 June 2016
Frequency of Use of WPIS
51
Visiting of forums
Sometimes
2.15
Rarely
3.33
Sometimes
3.27
Sometimes
3.74
Agree
ip t
Overall Mean
2.94
3.57
us
Agree
Agree
3.59
Agree
3.73
ed
Agree
3.73
Agree
Overall Mean
3.75
Agree
3.70
Agree
Services offered by the portal are
an
offered by the portal.
3.77
M
suited to my needs.
Using services offered by the portal
ce pt
is a wise decision.
Ac
Downloaded by [Rex Bringula] at 02:40 13 June 2016
I am pleased with the services
cr
Satisfaction of Use of WPIS
52
ip t
Table 8. Eigenvalues, Cumulative Percentage Variance, and Squared Canonical Correlation for Each Canonical Function
Canonic
d Canoni
Eigenv
Varia
al
ion
alue
nce
Correlat
Explai
ions
1.84
91
0.80
ce pt
1
2
0.19
d
Eigenv
Varia
al
Canoni
alue
nce
Correlat
cal
Correla
Explai
ions
Correla
tion
ned
cal
ed
ned
Canonic
M
Funct
9
0.40
Square
t
an
t
Percen
us
Square
tion
0.65
2.47
92
0.84
0.71
0.16
0.22
8
0.42
0.18
Wilks’ Lambda = 0.30
Wilks’ Lambda = 0.24
Rc2 = 0.70
Rc2 = 0.76
Approximate F(24,318) = 11.17
Approximate F(26,142) = 5.78
Ac
Downloaded by [Rex Bringula] at 02:40 13 June 2016
Percen
Study 2
cr
Study 1
53
p < 0.001
Cramer-Nicewander Index = 0.40
Cramer-Nicewander Index = 0.44
us an M ed ce pt Ac
Downloaded by [Rex Bringula] at 02:40 13 June 2016
cr
ip t
p < 0.001
54
ip t
Table 9. Dimension Reduction Analysis Study 1
Study 2
Sig.
1 to 2
0.30
11.17
0.000
2 to 2
0.84
2.73
cr
F
Wilks L.
F
Sig.
5.78
0.000
1.32
0.225
us
Wilks L.
0.24
an
ce pt
ed
M
0.003
Ac
Downloaded by [Rex Bringula] at 02:40 13 June 2016
Roots
55
0.82
ip t
Table 10. Structure Coefficients for the First Two Predictor Canonical Variates and Two Dependent Canonical Variates Study 1
Study 2
cr
Predictor Variables
us
Duration of Use of Web
-0.17
0.42
0.02
-0.28
0.23
0.01
0.05
-0.34
Commitment
-0.08
-0.39
0.76
-0.13
Normative
-0.24
-0.39
0.27
-0.20
Initiative
0.66
0.18
0.56
0.17
Effectiveness
0.82
-0.31
0.86
0.08
an
0.11
Ac
Portal
0.21
ed
Computer Usage Skill
0.19
M
0.002
Internet Usage Skill
ce pt
Downloaded by [Rex Bringula] at 02:40 13 June 2016
Function 1 Function 2 Function 1 Function 2
56
-0.44
0.68
0.42
Content
0.89
-0.11
0.69
0.48
Availability
0.64
-0.30
0.69
Speed
0.77
0.01
Aesthetics
0.63
cr 0.66
us -
0.04
0.001
0.34
0.52
-0.28
-0.06
M
-
ed
Function 1 Function 2 Function 1 Function 2
0.68
0.738
0.71
-0.70
0.92
-0.404
0.97
0.26
ce pt
Frequency of Use
Satisfaction
-0.28
an
Time Completion
Dependent Variables
ip t
0.44
Ac
Downloaded by [Rex Bringula] at 02:40 13 June 2016
Ease
57