Knowledge Transfer to the Society⦠..... A free access is sometimes offered by an ISP. ...... The IDE to develop the website is using Adobe Dreamweaver CS4.
Faculty of Computer Science and Information Technology
Personalisation the Internet the Indigenous Personalisation of the of Internet AccessAccess for thefor School-age Children of the Sarawak IndigenousCommunities Communities: A Preliminary Study
Abrar Noor Akramin bin Kamarudin
Master of Science 2018
Personalisation of the Internet Access for the School-age Children of the Sarawak Indigenous Communities: A Preliminary Study
Abrar Noor Akramin bin Kamarudin
A thesis submitted In fulfilment of the requirements for the degree of Master of Science (Computer Science)
Faculty of Computer Science and Information Technology UNIVERSITI MALAYSIA SARAWAK 2018
DECLARATION
I hereby declare that the thesis is based on my original work except for quotations and citations, which have been duly acknowledged. The thesis has not been accepted for any degree and is not concurrently submitted in candidature for any other degree.
___________________________________ Name: Abrar Noor Akramin bin Kamarudin Matric No: 14020200 Date:
i
ACKNOWLEDGEMENT
First and foremost, special thanks to my supervisor, Assoc. Prof. Dr. Balisoamanandray RanaivoMalançon for her constructive supervision, thoughtful encouragement and intellectual commitment in guiding me through my study and writing this thesis. Thanks to my co-supervisor Dr. Nadianatra Musa for her valuable comments. My sincere thanks to my wife Noorfadhilah Khairi, who allowed me to develop my own academic interests, yet guided me to keep focused. I am grateful for her encouragement and support in guiding me through my study. I am highly indebted to my beloved mother, Ms Noraizan Labib, my father Mr. Kamarudin Mohamad Isa, my children, Aidil Noor Aufa, Ahmad Noor Aufa and Arissa Noor Aufa for all their encouragement, support, sacrifices, and prayers. I would like to thank the Ministry of Higher Education Malaysia for providing me with the MyBrain15 scholarship, the Sarawak Education Department, Serian District Education Office, Serian district school teachers and students who graciously participated in the study. The motivation to complete this research also come from a circle of friends who share their expertise and encouragement. This includes the faculty members for providing me with valuable guidance and training, Mr. Faizol Mohd Suria for the PHP tutorial, Knowledge Transfer lab colleagues, Usrah Serian group members, Doctorate Support Group, and Root of Science team members.
ii
ABSTRACT
The aim of this study is to propose a personalised Internet access environment for the indigenous communities. It is found that the Internet access in rural areas is still limited and such communities who lived there are experiencing the digital divide. Due to the lack of the early Internet education, bad Internet contents can be accessed unintentionally once they get connected to the Internet. Thus, a survey is conducted to assess the Internet usage and the challenges among the children there. Data for this study were collected from the secondary school students in Serian district (N=237). A personalised Internet access framework is designed based on their Internet requirements. It consists of a cross-platform system interface, a multi-languages support, educative and assistive mediums, a human verified web pages database and a hybrid web content filtering. The system prototype is implemented in PHP, JavaScript and Python programming languages. Two types of system testing are performed which (1) the black-box testing to find system’s functional faults and (2) usability testing to evaluate the user acceptance. The testing results indicate that the proposed system is clearly accepted by the indigenous communities in guiding them to find information from the Internet.
Keywords: personalisation; Internet education; survey; recommendation technique; indigenous communities; black-box testing; usability testing.
iii
Pemeribadian Akses Internet untuk Kanak-Kanak Sekolah dari Kalangan Masyarakat Pribumi Sarawak: Satu Kajian Awal
ABSTRAK
Tujuan kajian ini dijalankan adalah untuk mencadangkan persekitaran akses Internet peribadi untuk masyarakat pribumi. Akses Internet di kawasan luar bandar adalah terhad dan masyarakat pribumi yang tinggal di kawasan pedalaman masih lagi terpinggir dari dunia digital. Oleh kerana kekurangan pendidikan awal mengenai Internet, kandungan Internet yang tidak baik boleh dicapai secara tidak sengaja sebaik sahaja mereka berpeluang menggunakan Internet. Oleh itu, satu kaji selidik dijalankan untuk menilai penggunaan Internet dan cabaran yang dihadapi oleh kanak-kanak komuniti pribumi tersebut. Data untuk kajian ini diperolehi daripada pelajar-pelajar sekolah menengah di daerah Serian (N=237). Satu rangka kerja akses Internet yang diperibadikan direka berdasarkan kepada keperluan Internet mereka. Ia terdiri daripada antaramuka sistem yang silang platform, sistem sokongan pelbagai bahasa, medium pendidikan dan bantuan, pangkalan data halaman web yang telah ditentu sahkan, serta sistem tapisan kandungan laman sesawang hibrid. Prototaip sistem ini dibina dengan menggunakan bahasa pengaturcaraan PHP, JavaScript dan Python. Dua jenis ujian telah dijalankan ke atas sistem tersebut iaitu (1) ujian kotak hitam untuk mencari ralat fungsi sistem dan (2) ujian kebolehgunaan untuk menilai penerimaan pengguna. Hasil ujian menunjukkan bahawa sistem yang telah dicadang dapat diterima dengan baik oleh masyarakat pribumi dalam membimbing mereka mencari maklumat dari Internet.
Kata kunci: pemeribadian; pendidikan Internet; kaji selidik; teknik cadangan; komuniti pribumi; ujian kotak hitam; ujian kebolehgunaan.
iv
TABLE OF CONTENTS Page
1.1
Research Problems (RP)…………………………………………………………....... .... 1
1.2
Research Questions (RQ)…..……………………………………………………….. ..... 2
1.3
Research Objectives (RO)..…………………………………………………………. ..... 3
1.4
Brief Description of the Research Methodology…………………………………….. .... 3
1.5
Research Scope………………………………………………………………………..... 5
1.6
Expected Contributions……………………………………………………………… .... 6
1.7
Organisation of the Thesis…………………………………………………………… .... 6
2.1
Introduction………………………………………………………………………….. .... 8
2.2
Personalisation………………………………………………………………………...... 8 2.2.1 What is “Personalisation”? ...................................................................................... 8 2.2.2 Personalisation Techniques ..................................................................................... 9
v
2.2.3 Applications of Personalisation............................................................................. 10 2.3
Indigenous Communities and ICT………………………...……………………….. .... 14 2.3.1 Indigenous Definition............................................................................................ 14 2.3.2 Problems……………………................................................................................ 14 2.3.3 Current Solutions…………………… .................................................................. 15
2.4
Monitoring Internet Access………………………………………………………… .... 17
2.5
Chapter Summary…………………………………………………………………... .... 19
3.1
Introduction………………………………………………………………………… .... 21
3.2
The Survey Design Process………………………………………………………… .... 21 3.2.1 The Sample……………………............................................................................ 21 3.2.2 Permission for Data Collection ............................................................................. 25
3.3
The Survey Design Questionnaire………………………………………………….. .... 26 3.3.1 Overview of the Survey Content ........................................................................... 26 3.3.2 Respondent’s Background and Internet Access (Section 1) ................................. 27 3.3.3 Internet Usage among the Respondents (Section 2) ............................................. 27 3.3.4 Difficulties in Accessing the Internet (Section 3) ................................................. 28 3.3.5 The Need of Assistance When Using the Internet (Section 4).............................. 28 3.3.6 Facilities Used by the Respondents (Section 5) .................................................... 28 3.3.7 Abilities When Using the Internet (Section 6) ...................................................... 28 3.3.8 Internet Safety Measurements among the Respondents (Section 7) ..................... 29 3.3.9 Learning Approach Using Mobile and Desktop (Section 8) ................................. 29
3.4
Pilot Study………………………………………………………………………….. .... 29
vi
3.5
The Primary Data Collection……………………………………………………….. .... 30
3.6
Chapter Summary…………………………………………………………………... .... 32
4.1
Introduction………………………………………………………………………… .... 34
4.2
Descriptive Statistics……………………………………………………………….. .... 34 4.2.1 Socio-Demographic Profile................................................................................... 35 4.2.2 Language Usage…………………… .................................................................... 38 4.2.3 Internet Access Background ................................................................................. 39 4.2.4 Educative and Assistive Mediums ........................................................................ 42 4.2.5 Facilities Used with Friends .................................................................................. 44 4.2.6 Self-Assessment on the Abilities When Using the Internet .................................. 46 4.2.7 ICT Difficulties Faced by Respondents ................................................................ 47 4.2.8 Security Measures and Bad Internet Content Exposure........................................ 48 4.2.9 Learning through Mobile Device and Computer .................................................. 50
4.3
Inferential Statistics………………………………………………………………… .... 52 4.3.1 Relation: Ethnicity and Parent’s Education Level ................................................ 52 4.3.2 Relation: Finding True Information, Ethnicity and English Language................. 56
4.4
Chapter Summary…………………………………………………………………... .... 59
5.1
Introduction………………………………………………………………………… .... 61
5.2
Conceptual Design Enhancement………………………………………………….. ..... 61
vii
5.3
User Actions………………………………………………………………………... .... 62
5.4
Main Page Access………………………………………………………………….. .... 63 5.4.1 Main Page Access Design ..................................................................................... 64 5.4.2 Main Page Access Implementation ....................................................................... 65
5.5
Educative and Assistive Mediums…………………………………………………. .... 66 5.5.1 Educative and Assistive Main Page Design .......................................................... 67 5.5.2 Educative and Assistive Main Page Implementation ............................................ 67 5.5.3 Educative and Assistive Mediums Selection ........................................................ 68
5.6
Search Page………………………………………………...………………………. .... 69 5.6.1 Search Page Design…………………… ............................................................... 69 5.6.2 Search Page Implementation ................................................................................. 70
5.7
Search Engine………………………………………………………………………. .... 71 5.7.1 Search Engine Design ........................................................................................... 72 5.7.2 Search Engine Implementation ............................................................................. 72
5.8
System Implementation Requirements……………………………………………... .... 73 5.8.1 Programming Language and the IDE .................................................................... 73 5.8.2 Human-Edited Directory of the Web .................................................................... 74 5.8.3 Database and Connection ...................................................................................... 74 5.8.4 Apache HTTP Server ............................................................................................ 75 5.8.5 Development Platform .......................................................................................... 76
5.9
Chapter Summary…………………………………………………………………... .... 76
6.1
Introduction………………………………………………………………………… .... 77
viii
6.2
System Testing using Black-Box Testing………………………………………….. .... 77
6.3
User Acceptance Testing and Evaluation…………………………………………... .... 80 6.3.1 Tasks Description…………………… .................................................................. 81 6.3.2 User Acceptance Testing Results .......................................................................... 83 6.3.3 Analysis of User Acceptance Testing ................................................................... 84
6.4
Chapter Summary…………………………………………………………………... .... 91
7.1
Introduction………………………………………………………………………… .... 92
7.2
Integrating Personalisation in E-Learning…………………………………………. ..... 92
7.3
Indigenous Children and Personalised Learning Technology……………………… .... 93
7.4
Challenges in Collecting Data from Indigenous School Children………………. ........ 96
7.5
Knowledge Transfer to the Society……………………………………………..… ...... 98
7.6
Chapter Summary…………………………………………………………………. .... 102
8.1
Introduction……………………………………………………………………….. .... 103
8.2
Contributions……………………………………………………………………… .... 103
8.3
Limitations of the Study………….………….………….………….……………... .... 104 8.3.1 Lack of Respondents ........................................................................................... 104 8.3.2 Lack of Available Indigenous Languages Resource ........................................... 104
8.4
Future Work………….………….………….………….………….……………… .... 105
ix
LIST OF TABLES Page Table 2.1
Comparison of personalisation techniques ................................................................ 10
Table 2.2 Mapping literature findings and personalisation features……...……….……...……20 Table 3.1
Number of students for the whole Sarawak as 31st October 2015 ............................. 23
Table 3.2
The number of students in Serian district age 13 to 19 years old .............................. 23
Table 3.3
Determining sample size (Krejcie & Morgan, 1970) ................................................. 24
Table 3.4
Questionnaire distributed and returned by the schools .............................................. 25
Table 3.5
Questionnaire content ................................................................................................ 27
Table 4.1
Variables description.................................................................................................. 34
Table 4.2
Socio-demographic profiles of the respondents (N=237) .......................................... 37
Table 4.3
Language usage .......................................................................................................... 38
Table 4.4
Abilities when using the Internet ............................................................................... 46
Table 4.5
Learning using mobile device and computer desktop ................................................ 51
Table 4.6
Compared variables and their categories ................................................................... 52
Table 4.7
Ethnicity vs. parent’s education level cross-tabulation .............................................. 53
Table 4.8
Chi-square test ........................................................................................................... 54
Table 4.9
Symmetric measures .................................................................................................. 55
Table 4.10 Set of variables ........................................................................................................... 56 Table 4.11 Categorical variables codings .................................................................................... 57 Table 4.12 Classification tablea,b.................................................................................................. 57 Table 4.13 Chi-square test of model coefficients......................................................................... 58 Table 4.14 Classification tablea .................................................................................................... 58 Table 4.15 Variables in the equation............................................................................................ 59
x
Table 4.16 Mapping survey findings and personalisation features .............................................. 60 Table 5.1
Possible user actions .................................................................................................. 63
Table 5.2
Purpose of user information ....................................................................................... 64
Table 5.3
DMOZ Open Directory vs. Google ........................................................................... 74
Table 6.1
Test plan 1: PIAK login page ..................................................................................... 79
Table 6.2
Test plan 2: PIAK educative and assistive page ........................................................ 79
Table 6.3
Test plan 3: PIAK search page ................................................................................... 80
Table 6.4
Test plan 4: PIAK search engine................................................................................ 80
Table 6.5
Seven evaluated items for user acceptance testing .................................................... 82
Table 6.6
Descriptive statistics of respondents’ characteristics (N = 30) .................................. 83
Table 6.7
Result of user acceptance testing ............................................................................... 83
Table 6.8
Independent-samples T test results of the seven evaluated items .............................. 89
Table 6.9
No significant difference between indigenous and non-indigenous .......................... 90
Table 6.10 Significant difference between indigenous and non-indigenous ............................... 90 Table 8.1
Contributions of the study derive from the objectives ............................................. 103
xi
LIST OF FIGURES Page Figure 1.1
Overall research framework ....................................................................................... 4
Figure 1.2
Mapping research problems, questions, and objectives ............................................. 4
Figure 1.3
Studied secondary schools in Serian district .............................................................. 5
Figure 1.4
Thesis organisation roadmap ...................................................................................... 7
Figure 2.1
Searching on the Internet without filtering system ................................................... 17
Figure 2.2
Conceptual design of a personalised Internet access system .................................... 20
Figure 3.1
Sampling illustration................................................................................................. 22
Figure 4.1
Gender and age distribution ...................................................................................... 35
Figure 4.2
Ethnic group distribution .......................................................................................... 36
Figure 4.3
Parent’s education level distribution ........................................................................ 37
Figure 4.4
Age of first time using the Internet ........................................................................... 39
Figure 4.5
The extent of Internet use ......................................................................................... 40
Figure 4.6
Places to access the Internet distribution .................................................................. 41
Figure 4.7
Internet access device distribution ............................................................................ 42
Figure 4.8
Assistance seeking distribution ................................................................................ 43
Figure 4.9
Capability distribution .............................................................................................. 44
Figure 4.10 Used facilities and applications distribution ............................................................. 45 Figure 4.11 Respondent’s Internet safety skills ........................................................................... 47 Figure 4.12 ICT difficulties faced by the respondents ................................................................. 48 Figure 4.13 Distribution of installed security software or service ............................................... 49 Figure 4.14 Seen sexual image and places happen ...................................................................... 50 Figure 5.1
Enhanced conceptual design of PIAK ...................................................................... 62
xii
Figure 5.2
UML use case diagram ............................................................................................. 62
Figure 5.3
PIAK main page design ............................................................................................ 64
Figure 5.4
PIAK main page UI (desktop version) ..................................................................... 65
Figure 5.5
PIAK main page UI (mobile version) ....................................................................... 66
Figure 5.6
PIAK educative page design ..................................................................................... 67
Figure 5.7
Educative and assistive UI (desktop and mobile version) ........................................ 68
Figure 5.8
PIAK search page design .......................................................................................... 69
Figure 5.9
PIAK search page UI (desktop version) ................................................................... 70
Figure 5.10 PIAK search page UI (mobile version) .................................................................... 71 Figure 5.11 PIAK search engine design ....................................................................................... 72 Figure 5.12 PIAK search result UI (desktop and mobile version) ............................................... 73 Figure 5.13 Database schema for the system ............................................................................... 75 Figure 6.1
Testing methods ........................................................................................................ 77
Figure 6.2
Black-box testing approach ...................................................................................... 78
Figure 6.3
Black-box testing steps ............................................................................................. 78
Figure 6.4
User acceptance testing steps.................................................................................... 81
Figure 6.5
Task sheet ................................................................................................................. 82
Figure 6.6
Example of independent-samples T test output (1) .................................................. 85
Figure 6.7
Two steps reading independent samples test table ................................................... 87
Figure 6.8
Example of independent-samples T test output (2) .................................................. 88
xiii
INTRODUCTION
1.1
Research Problems (RP)
The Internet is a very large network of networks that connects computers and other devices to the World Wide Web (web). The Internet has become the “best friend” of the people around the world. Disconnecting from the Internet may put some people out of contact with the entire world. This can be a frightening experience for them as they cannot easily communicate with everyone like being back in the 1990s. Moreover, with this kind of “friend”, people get smarter every day as they can access any information on the Internet. Today, people use the Internet for different purposes: to conduct business, to increase knowledge, to do homework and assignments, to pay bills, to book flight tickets or hotel rooms, to find a job, etc. All these examples show the important role of the Internet in our daily life. Anyone can get access to the Internet by paying a subscription fee to an Internet Service Provider (ISP). A free access is sometimes offered by an ISP. Other means exist to access freely the Internet but they are against the law. Therefore, if an access to Internet exists, anyone, including children, can reach the web. The web consists of a huge system of interconnected documents (or web pages). These web pages contain information that can be qualified as either good or bad. By considering the indigenous communities who live generally in rural areas, two main problems can be raised regarding this access to the Internet and the web.
1
RP1: Indigenous communities are not assisted in accessing and making full use of Internet The indigenous communities, especially the youngsters, have limited time and accessibility to the Internet (Rennie et al., 2013). Generally, they only get to learn the computer literature during the school period, but not always at their home or during school holidays. In addition, there are no electronic guideline and specific software for the indigenous children to guide them on how to use the Internet properly. Thus, it is important to design a system that will assist the indigenous children to access the Internet properly and make full use of the true information. Learning through the Internet has so much benefit to the school students (Area-Moreira et al., 2016). Besides the ability to gain new knowledge, they also can share their own knowledge, communicate with each other and get exposed to the world diverse culture.
RP2: Web content is not always safe for children Everything on the web can be either good or bad and hence, without any supervision, children can browse the web and end up in the bad section. Unwanted web pages can simply appear within a click when children surf the web such as pornography, bullying through nasty or hurtful messages, phishing, self-harm, drug-taking and suicide (Livingstone et al., 2011). Therefore, it is important that a personalised system is developed to help the indigenous children to access the Internet content safely.
1.2
Research Questions (RQ)
The research problems described earlier arise the following research questions: RQ1. How can children of indigenous communities be assisted in accessing the Internet?
2
RQ2. How to make the Internet access safe for any children? RQ3. How to design and implement a personalised Internet system dedicated to the children of indigenous communities? RQ4. How to evaluate the personalised Internet access system?
1.3
Research Objectives (RO)
The aim of this study is to personalise the Internet access for the indigenous community in Sarawak, especially the indigenous children. This aim is supported by the following objectives: RO1. To identify the problems faced by the indigenous children of Sarawak and their requirements in accessing the Internet through the literature and a survey study. RO2. To design and implement a personalised Internet access for the indigenous children in Sarawak based on the identified problems. RO3. To evaluate the personalised Internet access system as a black-box and its usability on a sample of children.
1.4
Brief Description of the Research Methodology
The steps of the proposed research methodology are illustrated in Figure 1.1. At the initial step, the concept of personalisation is identified in the literature. After that, a set of questionnaires is developed and a pilot study is done before performing the real data collection. The outcome of the data analysis is used to propose the personalisation features. Once the system design and implementation are done, the system is tested and evaluated. Finally, the result of the analysis is reported.
3
Study literature
Start
Develop questionnaires Determine suitable personalisation features
Design a personalised Internet access system
Implement the personalised Internet access system
Conduct a survey in pilot study
Evaluate the system
Analyse the survey result
Report the findings
End
Figure 1.1: Overall research framework
Figure 1.2 shows the connection of research problems to research questions and research questions to research objectives. This will illustrate clearly the direction of the study.
RQ1 – How to assist?
RP1 – Children not assisted
RP2 – Internet contents not safe
RQ2 – How to make Internet safe?
RQ3 – How to design and implement the system?
RO1- Problem identification
RO2 – System design and implement RO3 – System evaluation
RQ4 – How to evaluate?
Figure 1.2: Mapping research problems, questions, and objectives
4
1.5
Research Scope
This study focuses on the indigenous communities in Sarawak. Therefore, it was conducted with the assistance of the secondary school children aged 13 years to 19 years from six government secondary schools in Serian, Sarawak, namely, Sekolah Menengah Kebangsaan Tebakang, Sekolah Menengah Kebangsaan Tarat, Sekolah Menengah Kebangsaan Balai Ringin, Sekolah Menengah Kebangsaan Taee, and Sekolah Menengah Kebangsaan Tebedu as shown in Figure 1.3.
Kuching City (Urban area)
SMK Tarat (73km)
SMK Taee (72km) Serian district (Rural area)
SMK Serian (74km)
SMK Tebedu (104km) SMK Balai Ringin (104km) SMK Tebakang (78km) Figure 1.3: Studied secondary schools in Serian district
5
1.6
Expected Contributions
The expected contributions of this study are threefold. Firstly, a better understanding of the problems and needs of the indigenous children of Sarawak in regard to Internet access will be identified. Secondly, as a result of this understanding, a prototype that can assist the indigenous children in accessing safely the Internet will be designed, implemented, and evaluated. Thirdly, this study is expected to contribute in the area of personalised systems. Previous research has demonstrated that personalisation can be implemented in many online applications. The proposed prototype for assisting the indigenous children in accessing the Internet will be an additional application of personalisation.
1.7
Organisation of the Thesis
The structure of the thesis is illustrated in Figure 1.4. In the Chapter 1, an overview of the research is provided. Chapter 2 surveys the three main concepts of this research, which are, personalisation, indigenous communities and their relations with Information and Communication Technology (ICT), and the Internet access. Chapter 3 describes the primary data collection and Chapter 4 reports its quantitative data analysis for the design of the prototype. Chapter 5 depicts the design and the implementation of the prototype. Chapter 6 describes the testing and the evaluation of the prototype. Chapter 7 discusses the rationale of the study and Chapter 8 concludes the thesis by highlighting the contributions of this research, its limitations and future research direction. Finally, concern letters and questionnaire are attached as appendices.
6
Chapter 1 Thesis Overview
Chapter 2 Literature Review Chapter 5 Chapter 4 Chapter 3
Primary Data Collection
Design and Implementation of the Personalised Internet Access Prototype
Statistical Data Analysis for Prototype Design
Chapter 6 Evaluation of the System
Chapter 7
Appendix A: Publications Appendix B: Ministry concern letter Appendix C: Sarawak Education Department concern letter Appendix D: Acknowledge letter from CGS Appendix E: Letter to the school principal Appendix F: Questionnaire
Discussion
Chapter 8 Conclusions and Future Work
Figure 1.4: Thesis organisation roadmap
7
LITERATURE REVIEW
2.1
Introduction
This chapter provides a review of some relevant literature on the three main concepts related to this study: personalisation, its techniques and applications, indigenous communities and ICT, and the current Internet access, mainly in the area of Sarawak.
2.2
Personalisation
2.2.1 What is “Personalisation”? Diverse definitions can be found in the literature for the term “personalisation”. Mulvenna and colleagues (Mulvenna et al., 2000) stated that the goal of personalisation is to provide a user with what he or she needs by implicitly learn user’s behaviour. In other words, personalisation “dynamically adapts a system’s service or content offered in order to better meet or support the preferences and goals of individuals and specific target groups” (Riecken, 2000). Therefore, in general, personalisation is to provide something specific to a specific user. This something differs for each application. For example, in the case of the Amazon.com, the something is products. Amazon.com recommends to their users the products that they might need without asking them explicitly. This is done by observing and analysing the users’ behaviour in purchasing and browsing the products. Besides products, the information, web pages, services or assistance are also something which can
8
be personalised. This study adopts the definition of the term “personalisation” as proposed by Mulvenna et al. (2000) and Riecken (2000).
2.2.2 Personalisation Techniques The personalisation techniques discussed in this research derived from the recommendation techniques. Common recommendation techniques are divided into three approaches: collaborative filtering, content-based filtering and hybrid technique (Segaran, 2007). As its name suggested, collaborative filtering combines the information gathered from a user as well as the other similar users to recommend something. This can be summarised as “recommend me the same thing that is popular among my peers”. If collaborative filtering is focusing on users’ behaviours, the content-based filtering technique is focusing on the content of the item to be recommended. A user is recommended something that is similar to what he liked or selected before. The hybrid technique is the combination of both content-based and collaborative filtering to support fine recommendations. Both collaborative filtering and content-based filtering have their own disadvantages when implemented independently (Bhatnagar, 2016). Collaborative filtering may not be practical in a large dataset and often unable to draw any inferences for new users as no information has been gathered yet about them. A similar situation may occur with a recommendation system using the content-based technique. The system is unable to recommend any item due to the insufficient ratings given by the users. That is the so-called cold start issue for any recommendation system. Another issue with the content-based filtering is that it might recommend very similar items, which will make the recommended list not really varied.
9
Table 2.1 shows the comparison of the different personalisation techniques. Thus, a hybrid solution is made to overcome the weaknesses of the two other approaches.
Technique Collaborative filtering Content-based filtering Hybrid
-
Table 2.1: Comparison of personalisation techniques Pros Cons Suitable for small dataset - Infeasible in large database Simple to implement - Cold start issue Faster than collaborative filtering - Overspecialisation on the technique item selection Perform better in sparse dataset - Cold start issue Solve collaborative and contentbased filtering deficiencies Solve cold-start problem
2.2.3 Applications of Personalisation Personalisation can be found in different applications such as e-commerce, digital library, and elearning. Each application has a different perspective of personalisation, which offers a specific user interface and provides different output results.
2.2.3.1 Personalisation in E-Commerce The last decade has seen a growing trend towards personalisation adoption in e-commerce web pages. To assimilate millions of customers and a vast number of products in the electronic catalogue, Amazon.com, for example, provides a user-friendly interface and adopted personalisation to provide the right products at the right time and relevant to the customer needs. The combination of content based filtering and collaborative filtering in the recommendation system are able to increase company profits and retaining buyer (Smith & Linden, 2017). Personalisation is an added value for the company if it can provide many advantages in terms of customer relationship management to increase customer loyalty, good quality of the offer,
10
easy to navigate the e-commerce site and support (Goy et al., 2007). The company must be able to demonstrate different suggestions to specific customers as well as the service delivery. This can be done by adopting a systematic approach to support a dynamic and comprehensive knowledge of their customers, opportunities, and the company’s own performance capabilities. Besides that, Travelocity.com and Landsend.com have utilised high degree of personalisation in their business (Wu et al., 2002). Both companies are using recommendation system to recommend their products and items by using both implicit and explicit input from the user’s behaviour and preferences. In addition, Shi, Larson, and Hanjalic (2014) suggest that a recommender system should exploit economic models to optimise the recommender system output without compromising the quality. This will reduce the computational complexity and optimal online recommendation can be computed under the narrow time constraints.
2.2.3.2 Personalisation in Digital Library Digital libraries play an important role in narrowing the gap between the massive amount of available information and the specific needs of both students and researchers. In fact, it has become a proactive system to offer information for their needs and continuously support the knowledge sharing (Neuhold et al., 2003). In the study of Torres, McNee, Abel, Konstan, and Riedl (Torres et al., 2004), a hybrid recommender solution using collaborative and content-based filtering was implemented to enhance the library recommendation for research papers. They found that 85% of students and researchers got at least one good recommended research paper based on their needs. Besides for academic usage, Koutrika and Ioannidis found a considerable personalisation technique for movies’ digital libraries by building a knowledge about user attribute in the user profile (Koutrika & Ioannidis, 2004). They keep the user’s query-writing rules when searching for
11
items and then manipulate it using an intelligent algorithm to generate recommended items for other similar users. Additionally, adopting a recommender system by using a Pearson coefficient algorithm can enhance the searching for the right books in digital library implicitly (Paul, 2015). Although many fields have also contributed to the development of a digital library such as human-computer interaction, user modelling in information seeking, information retrieval and hypermedia, recommendation technique using hybrid filtering is also one of the methods to personalise the information retrieval.
2.2.3.3 Personalisation in E-Learning The innovative program of personalised e-learning does not end in the formal education only. Since 2001, research by Davies, Stock, and Wehmeyer enhanced the independent Internet access towards the individual with mental retardation using a specialised web browser (Davies et al., 2001). They have shown the critical requirements to personalise the web browser and customise the available features of special needs software to suit the unique needs of each user. This initiative is also enhanced by Giannoulis, Kagia, Kakoulidis, Rikkou, and Skourlas (Giannoulis et al., 2013) to create a tool called Multimedu for disabled students. The tool consists of four interrelated and interconnected components to personalise the disabled student’s learning. Their educational materials were collaboratively shared through social networking service. In the case of lifelong learning in Hong Kong, Lee and Cribbin (2011) suggested that personalisation can become an added value to market the scheme. Students who subscribe the lifelong learning scheme are entitled to choose their flexible curriculum design, effective teaching and assessment on their learning. This learning model can be designed effectively by emphasising the involvement of student-teacher relationship in the knowledge development (Dumitrache &
12
Dumitraşcu, 2014). Additionally, personalised learning is more valuable when the system can support the reflection, planning and even controlled by the learner. This can increase their knowledge via personalised tools to find, recover and retrieve information (Kay, 2008). In an alternative view of the personalised learning system, Nedungadi and Raman (2012) validated that mobile device can be merged with the cloud-based adaptive learning system in a classroom background. Students can switch from e-learning when using the school’s computer to m-learning by using their smartphone when returning home. This will lower the cost, transportability, and provide the flexibility of learning without reducing student’s achievement and the performance of the system itself. Furthermore, Saul (2013) has demonstrated that the use of adaptation model in eassessment personalisation may contribute some development in the education area. He proposed that the questions and tests in the e-assessment must be perfectly tailored to the students or group of students. Simultaneously, the system should support or even compensate the insufficiencies in students’ individual learning by considering the students’ strengths and preferences.
2.2.3.4 Personalisation in User Interfaces A standard graphical user interface (GUI) of an operating system is required when someone bought a brand-new computer. The GUI can be customised based on the user needs. However, the effectiveness of the GUI in the personalised website development is challenging. Hearst (2009) emphasised on the aesthetic impression in designing the GUI to increase the system user acceptance. Additionally, the enjoyment feeling of using the system should come from the beauty, pragmatic, ease-of-use and usefulness of the system (Hassenzahl, 2004; Van der Heijden, 2003).
13
The aspects of the personalised user interface should also be integrated into three methods based on Antos, Headrick, and Richardson (Antos et al., 2008):
The GUI appearances are kept based on the diversity of user-usage settings
The user-usage data are recognised and examined to allow the system to deliver a suitable environment setting
The GUI is personalised by the system based on the identification of the content during the preliminary user-usage environment
2.3
Indigenous Communities and ICT
2.3.1 Indigenous Definition Based on Cambridge English Dictionary, the meaning of indigenous is “naturally existing in a place or country rather than arriving from another place”. Indigenous communities exist in both developing and developed countries. In the case of Sarawak, the International Work Group for Indigenous Affairs (IWGIA) considers that the indigenous peoples include the Iban, Bidayuh, Kenyah, Kayan, Kedayan, Murut, Punan, Bisayah, Kelabit, Berawan, and Penan. They constitute around 45.5% of Sarawak’s population, followed by other non-indigenous such as Malay and Chinese.
2.3.2 Problems Research into ICT and indigenous around the world has a long history. Many indigenous peoples lack access to the Internet or do not have the expertise to use ICTs (Rasta, 2011). The lack of access to computers and the Internet continues to be a major form of social and economic
14
exclusion for them, including lack of basic infrastructures such as electricity, trainer, computer hardware, software and language barrier (Deer & Håkansson, 2006). A study on the Internet access towards the Australian indigenous shows low participation with the Internet because of low rates of computer ownership, poor computer literacy levels, low enrolments in university IT courses and very few indigenous ICT professionals (Grant et al., 2010). Besides that, the ability of the indigenous communities to adopt ICT is also limited to several factors such as the cost of the technology, environmentally constrains because of geographic isolation or poor telecommunication infrastructure and difficulties to acquire computer and Internet knowledge (Dyson, 2004). Survey on digital inclusion among indigenous people in Perak has clear insight of indigenous problems with the ICT. Hashim, Idris, Ustadi, and Baharud-din (Hashim et al., 2011) found out that a high percentage of indigenous people did not know how to use email, word processing software or even naming the computer parts. Their findings have confirmed the existence of digital divide due to socio-economically disadvantages. Another survey in the rural area of Sarawak found out that more than half of the respondents have access to the Internet at home or their workplace (Mohd Nor et al., 2013). However, the Internet connectivity issues may have been resolved over the years, but, there is a lot of work need to be done to understand the current Internet access issues among the indigenous communities who lived in rural areas.
2.3.3 Current Solutions In June 2016, the Internet World Stats reported that the Internet users around the world are 50.1% of the total 7.34 billion world population (Miniwatts Marketing Group, 2016). It is reported that 1.85 billion Internet users are coming from Asia which results in 50.2% of the total world Internet
15
users. The Internet penetration in Malaysia has been increased to 68.1% in 2016 from 60.7% in 2012 with more than 21 million Internet users. This large number of users illustrates that Internet access is no longer a novelty among Malaysians compared to the low Internet adoption among the Thailand citizens (Tengtrakul & Peha, 2013). In China, the largest ICT project is the Distance Education Project for Rural Schools (DEPRS). It is a 5-year teacher professional development program implemented since 2003 in rural parts of southwestern China to strengthening capacity in distance education and ICT usage through the education channel of Chinese Central Television, radio, DVD and finally mobile devices (Clothey, 2015). While in Niger Delta, to make the ICT effective in this area, local content must be developed regardless the computers, Internet, and telephone lines. The information and communication of the local content is the most important priority in utilising such technologies for community development in Africa (Okon, 2015). Following the same trend, the Internet penetration in Sarawak has also increased from 47% in 2010 to 53.4% in 2014 as reported by the Malaysian Communication and Multimedia Commission (MCMC) in 2015. This observed increase in the broadband subscription is attributed to various government initiatives to encourage the natives to be ICT literate such as the 1 Malaysia Internet Centres (Pusat Internet 1 Malaysia). This Internet centre provides training workshop for the children and local community to access the Internet. However, such centre may not locate near to their house or does not have a very strong Internet connection. As the Internet access in a rural area might be different than the urban area in terms of availability, speeds, and types of services. Various efforts under the National Broadband Initiative to distribute 1 Malaysia notebook and the installation of 318 VSAT at Sarawak inland schools and public village library to promote the ICT usage (Hoe, 2009). The indigenous communities were encouraged to gain benefits using this facility. Although free WiFi access inland is available
16
at certain hotspots, the awareness to take security measure remains unknown which becomes their weakness. Thus, much more systematic approaches are needed to provide the Internet training and a secured Internet access environment for them.
2.4
Monitoring Internet Access
Figure 2.1 shows an example of a child performing a query searching on the Internet without any filtering system. The content of the Internet can be harmful to adults as well as the children. Monitoring the child’s Internet access can be done easily by checking the Internet history records. The list can be accessed via “Tools” menu in Internet Explorer or alternatively by pressing Ctrl+H in Google Chrome. By doing that, anyone should know what have the child go through when surfing the Internet unless the child knows how to delete their browsing history or using a browser with an Incognito Mode. However, there are also other methods to monitor the Internet usage whether by using a monitoring software or by referring to the logs record in the wireless router.
Figure 2.1: Searching on the Internet without filtering system
17
Much commercial parental software exists like Net Nanny, the leading brand in 2016 as it has real-time categorisation while one surfs the Web. The most common approach taken by this kind of software is to control the access of Internet by blocking unsuitable content for the children. Nevertheless, on one side, blacklisting only some websites is not sufficient and perfect, and on the other side, whitelisting may be too restrictive. In addition, none of the existing parental software has a feature for teaching children on the Internet safety. Besides parental control software, referring to the web traffic log is also one way to monitor the child’s Internet activity. The log can be retrieved from the wireless router by accessing the router’s setting page. Current wireless router is equipped with Internet content filtering features which allow the user to limit access to the Internet by block access to websites, IP blocks, DNS filtering, and Uniform Resource Locator (URL) blocking using a proxy (Murdoch & Anderson, 2008). Parents can also schedule the access to the Internet at certain times on their kid’s device. Although controlling the Internet access through the wireless router can be done without any software installation on the device, parents need to have some technical skills before accessing the router and perform such restrictions. Thus, although the Internet censorship exists, it is still not sufficient to provide a conducive learning environment for the children. Parental control apps for iOS and Android devices have emerged as the rise of mobile devices ownership continues. These apps allow parents to have a better control over their kid’s devices not only by setting the content limits but also on the amount of time their child can spend on certain apps. Similar to the parental software for the computer, the parental control mobile apps also feature monitoring web browser, app usage and downloads, pause apps remotely, set schedules for screen time, and create time limits for apps. Filtering malicious web pages can be done by using the hybrid solution proposed by Kamarudin and Ranaivo-Malançon (2015). A combination of blacklisted URLs database and
18
Naïve Bayes algorithm can prevent the unfit web pages appear on the screen. However, it is found that Support Vector Machine (SVM) outperform Naïve Bayes classifier in detecting malicious web pages at the accuracy rate of 98% (Kazemian & Ahmed, 2015). This kind of predictive model has been applied in Google Chrome browser extension. Furthermore, with the different content, layout and functionality of web pages in mobile, existing techniques to detect malicious websites are unlikely to work for such web pages. Amrutkar and colleagues demonstrate the detection of malicious web pages in mobile devices by using logistic regression classification technique (Amrutkar et al., 2016). They used a browser extension to receive a response in real-time from their backend server about the maliciousness of the visited web page. Due to the poor prediction time in real-time, Naïve Bayes and SVM classifier are not fit for their system.
2.5
Chapter Summary
Based on the literature review, the Internet access can be provided in a personalised way towards the indigenous communities. The ideas can be taken from the extensive personalisation techniques in various areas such as e-commerce, digital library and e-learning. Therefore, a conceptual design of the system is depicted in Figure 2.2. Two main components were identified in the system development namely the Internet Access Tool and the Filtering Tool. These components should be able to support multiple languages, multiple platform user interface, provide a medium of instruction, filter bad Internet contents and recommend personalised web pages to the users. Each component will be enhanced specifically based on the system requirements analysis in the primary data collection. Some important findings through literature study have been highlighted to propose a solution. Table 2.2 maps the vital findings to formulate the best features towards creating the proposed system.
19
Internet
Query
Personalization Components
Component A Internet Access Tool
Component B Search Results
Filtering Tool
Figure 2.2: Conceptual design of a personalised Internet access system
Table 2.2: Mapping literature findings and personalisation features Literature Findings Personalisation Features Recommendation technique Hybrid collaborative and content-based filtering technique is used to recommend the Internet contents Cloud-based learning Students can switch from e-learning to mlearning based on their device Information retrieval Hybrid DMOZ database and naïve Bayes filtering technique is adapted in the search engine Personalised graphical user interface (GUI) GUI is personalised based on the identification of the content during the preliminary user-usage environment
20
PRIMARY DATA COLLECTION
3.1
Introduction
This chapter describes the survey process through four steps: the design of the survey process, the development of the questions, the testing of the questions, and the primary data collection.
3.2
The Survey Design Process
This first step of the survey design process establishes the goal of the survey and how the information will be used. For this research, the goal is to get feedback from the indigenous children of Sarawak (the theoretical population) and understand their needs and problems when using the Internet. The information will be used to design and implement a dedicated prototype that personalised their Internet access.
3.2.1 The Sample As the number of children of Sarawak is very large, this research is only able to study the secondary school children aged 13 to 18 years old enrolled in Serian government schools (the study population). In Malaysia, the secondary education corresponds to five years. Each year is called Form, and thus the first year is called Form 1, the second year Form 2, and so forth. The typical age of a student going to Form 1 is 13 years old. When reaching Form 5, the typical age is 18 years old.
21
Serian is the name of the capital city of the Serian administrative division in Sarawak. The Serian division has currently six government secondary schools. The Malay term for national secondary school is Sekolah Menengah Kebangsaan abbreviated as SMK. Thus, the secondary schools in Serian division are SMK Serian, SMK Tebakang, SMK Tarat, SMK Balai Ringin, SMK Taee, and SMK Tebedu. All these schools have been approached for the survey. However, not all students in these schools were able to participate in the survey due to their preparation for the national examination. Therefore, each ICT teacher in charge in each school identified the list of potential participants. In the final stage, only students aged 13 to 14 years were selected to be involved in this study. This group of students forms the sampling frame (or the accessible population) as shown in Figure 3.1. Then, the date and time were set for the data collection.
The population of Sarawak secondary school students
Sampling frame (secondary school students in Serian district)
Original sample
Final sample (data)
Loss (non-response)
Figure 3.1: Sampling illustration
3.2.1.1 Sampling and Coverage The selected population in this study is all secondary school children aged 13 to 14 years studying in government schools in Serian, Sarawak. The Serian district is selected for the study due to the
22
indigenous communities populate nearly 60% of the population based on the 2010 population and housing census. According to the Department of Education Sarawak report, there were 202,560 secondary school enrolments from 13 to 19 years throughout the state in 2015 as shown in Table 3.1.
Table 3.1: Number of students for the whole Sarawak as 31st October 2015 Area size: 124,449.5 km2 School level
Primary School (including pre-school and special school)
Number of schools Enrolment Number of teachers
1,264 275,741 26,539
Secondary School (including religious, science and technical school) 188 199,750 15,832
Total
1,452 475,491 42,371
Source: Sarawak Education Department Web page (2016)
Furthermore, census by the Serian District Education Office in Table 3.2 shows that there were approximately 8,776 secondary school students aged from 13 to 19 years in Serian whereby 4,138 were males and 4,638 were females.
Table 3.2: The number of students in Serian district age 13 to 19 years old No. 1 2 3 4 5 6
School Name SMK Balai Ringin SMK Serian SMK Tebakang SMK Taee SMK Tarat SMK Tebedu Total
Students Enrollment Male Female 704 860 1,247 1,396 786 901 499 589 458 445 444 447 4,138 4,638
Total 1,564 2,643 1,687 1,088 903 891 8,776
Source: Serian District Education Office (2015)
This study used a convenience sampling technique in selecting the sample study. Six government secondary schools in Serian districts are fitted for the study.
23
The majority of the population in Serian district is indigenous communities based on the Population and Housing Census of Malaysia year 2000. The selected students should already expose to the Internet and they may have some understanding of using it for many purposes. These young people might encounter many issues and difficulties using the Internet technology, especially when finding true information. They are also vulnerable from threats and risks related to the Internet.
3.2.1.2 Sample Size Calculation For the purpose of this study, a table for determining the sample size of a given population as introduced by Krejcie and Morgan (1970) was used as shown in Table 3.3.
Table 3.3: Determining sample size (Krejcie & Morgan, 1970)
The size of the population and the amount of error with 95% confidence determines the size of a sample. Therefore, with the total of 8,776 students with age range 13 to 19-year-old in
24
Serian district, the sample size representative of the students needed is 368. However, 100 questionnaire sets were distributed to all six schools equally to consider the response rate between 70% to 80%. Among the 600 questionnaires, 363 were returned as undeliverable due to the closing of schools during haze pollution spike from Kalimantan, Indonesia in early September 2015 until the end of October 2015. Three schools were unable to give full cooperation due to limited time before the school’s end as shown in Table 3.4.
Table 3.4: Questionnaire distributed and returned by the schools Questionnaires Questionnaires School distributed returned SMK Balai Ringin 100 80 SMK Serian 100 78 SMK Tebakang 100 79 SMK Taee 100 0 SMK Tarat 100 0 SMK Tebedu 100 0 Total 600 (100%) 237 (39.5%)
Therefore, the total sample size was reduced to 237. This number represents a total return rate of 39.5%.
3.2.2 Permission for Data Collection Conducting a survey in Malaysian government schools is not possible without the consent of the Ministry of Education. A guideline to conduct a survey at government school has been prepared by the Division of Research Design and Educational Policy, Ministry of Education in the BPPDP 1.2 form. Therefore, two permission letters were obtained for this study: one from the Educational Planning and Research Unit at the Ministry of Education (Appendix C) and one from the Sarawak
25
Education Department (Appendix D). After receiving the two permission letters, each school principal agrees to have his or her school involved in the project.
3.3
The Survey Design Questionnaire
As explained by Fowler and Cosenza (2008), when designing effective questions for a survey, “researchers define the constructs that they want to measure. They ask respondents questions, and they want the answers to those questions to be measures of those constructs.” (Fowler & Cosenza, 2008). A construct is defined as “the abstract conception of the reality that a question is designed to measure.” (Fowler & Cosenza, 2008). The constructs to be measured in this research are listed below:
Language usage at home and school
Respondents’ parent’s education
Language usage when surfing the Internet
Difficulties when accessing the Internet
Getting help when having a problem on the Internet
Bad web pages exposure
Internet safety application usage
3.3.1 Overview of the Survey Content The questionnaire is divided into eight sections and the distribution of the number of questions per section is shown in Table 3.5. Each respondent has to answer 30 questions. The majority of the questions are close-ended questions. Respondents’ answers are limited to a fixed set of responses, including multiple choice which has several options to choose.
26
However, 12 responses to open-ended questions which the respondent needs to supply their own answer if applicable. The approach applied in the questionnaire is simple and short to keep the children away from pressure as they need ample time to answer the questions (Dillman et al., 2011).
Table 3.5: Questionnaire content No 1 2 3 4 5 6 7 8
Survey Section
Number of Questions 9 1 1 1 1 2 2 1
Respondent background Internet usage background Difficulties in accessing the Internet The need of assistance when using the Internet ICT usage for collaborative learning Respondent abilities when using the Internet Internet safety precaution among the respondents Mobile or desktop based learning approach Total
18
3.3.2 Respondent’s Background and Internet Access (Section 1) The respondents are asked to indicate their demographic characteristics of gender, age range, ethnicity, language at home, language at school, third known language usage, and parent’s education. Basic Internet background is asked such as the age of first time using the Internet, the frequency of using it, places and devices used to access the Internet.
3.3.3 Internet Usage among the Respondents (Section 2) Respondents are asked to indicate their academic and non-academic use of the Internet including the social networking services they may use. These findings are important to evaluate the Internet usage among the communities.
27
3.3.4 Difficulties in Accessing the Internet (Section 3) Respondents are required to point out ICT difficulties faced by them in accessing the Internet. The finding is useful to understand their limitation which will affect their early Internet education.
3.3.5 The Need of Assistance When Using the Internet (Section 4) To understand the assistance needed by respondents, their capability of using the Internet is analysed. At certain matters, they need to indicate their action when they found a problem on the Internet. The finding will be used to provide some features that can help them to a certain extent.
3.3.6 Facilities Used by the Respondents (Section 5) Some facilities are identified useful for the respondents in learning collaboratively with their friends. Respondents also need to point out their agreement in using ICT for collaborative learning. This is important to identify the facilities or specific features which are useful for the communities.
3.3.7 Abilities When Using the Internet (Section 6) Respondents need to indicate their abilities when using the Internet. Their self-assessment in various skills of using the Internet and smartphones are matters to identify the level of their knowledge in Internet usage.
28
3.3.8 Internet Safety Measurements among the Respondents (Section 7) This section targets to understand the Internet safety measures taken by the respondents. They need to state the sources to sexual images if they have seen any and indicate which Internet safety application is installed on their devices.
3.3.9 Learning Approach Using Mobile and Desktop (Section 8) To understand the learning approach using mobile devices or desktop, respondents need to indicate which statements are related in their daily learning. Both mobile devices and desktop usage for learning have many advantages. Mobile learning has become more popular among the youngster thus, it is important to understand their inclination to learn by using a mobile device.
3.4
Pilot Study
Twelve volunteers took part in the pilot study (Male n= 6, Female n= 6) and it was conducted on 20th July 2015. All of them are 13 years old students from SMK Serian consist of five Bidayuhs, three Ibans, two Malays and two Chinese. They are not part of the final sample. The efficacy data from a pilot study of this size are uninformative because of the aim of the pilot study was to obtain information and to ensure a well-designed questionnaire (Leon et al., 2011). Thus, modifications were made before the main survey was conducted. Some questions were modified to meet the school children criteria without compromising their privacy. Two questions about respondent’s background regarding their name and school name were removed. Two questions in the respondent’s profile were added to acknowledge respondents regarding the Internet and usage. Some questions were modified to get the
29
understanding of the children needs in accessing the Internet at the same time to design a medium of assistance in the proposed prototype.
3.5
The Primary Data Collection
Data collection is the process of gathering the observations about the constructs. Since the source of the data is the survey, the data are qualified as primary data. The primary data collection was carried out between 1st August 2015 and 30th November 2015. Initially, the data collection was planned to be done online. However, due to Internet disruption in the five secondary schools, a paper questionnaire was employed to obtain responses from SMK Tebakang, SMK Tarat, SMK Balai Ringin, SMK Taee, and SMK Tebedu except at the SMK Serian, which has been done by using SurveyMonkey online survey system. The process used in this data collection was first, by giving 100 coupons stating the URL of the questionnaire web page to the ICT teacher in the school. Meanwhile, the teachers in charge at the other five schools have to distribute the paper questionnaire to the students. Two weeks were given to complete the questionnaires so that the students could filled up the survey at their convenience. At the end of the two weeks, the survey answers were collected and the data is manually entered into the SurveyMonkey system. A small token is given as appreciation for their involvement. Self-administered questionnaire (Appendix G) was used as a study instrument, that is, no interviewer assisted the respondents during the survey. Respondents administered alone the questionnaire. The respondents were estimated to spend about 10 to 12 minutes to complete the questionnaire.
30
SurveyMonkey is the world’s largest cloud-based survey company founded in 1999 by Ryan Finley (SurveyMonkey Inc., 2016). Many features are available for users to design an attractive survey interface yet simple for the respondents. Besides that, survey results can be downloaded into in many forms for further analysis such as spreadsheets (.xls), PowerPoint presentations (.ppt), Adobe Acrobat (.pdf) and SPSS format (.sav). After designing the questionnaire based on the research needs, a simple blog (http://popserian.blogspot.my) is created and the URL is printed in coupon form for distribution. The blog clarifies the study objectives and the confidentiality of the findings. Besides that, the blog contains survey instruction and links for respondents to answer the questionnaire in English or Bahasa Malaysia. This is also to help them enter the survey form without having to type the long SurveyMonkey’s URL manually. There is also a web link created specifically to enter the responses manually by the researcher. The daily updated result is reported based on the response received. Survey results can be downloaded in spreadsheets and PowerPoint presentation forms for further analysis at the end of the survey period. Many advantages using an online survey system for the research (Wright, 2005):
Access to unique population, which is difficult to reach by other channels can be done. In this research, the indigenous children are living in rural areas. The online survey system should be very helpful to gain many responses as they might have any electronic device with Internet connection at home to answer the questionnaire. Some schools in a rural area might not have any Internet connection.
The online-based survey research hopes to save time for the researcher. Moving from one site to the others in rural areas required a lot of time. A meeting with the person in charge is enough to disseminate the questionnaire coupon or paper. The researcher
31
does not need to return to the school to collect the responses and waste time to key in the responses manually.
The cost of printing, papers and travelling can be reduced by using online survey system. Besides one-time meeting with the person in charge, the electronic media survey should be able to meet the target with minimal efforts. Although some charge is levied for using the online survey system, still, this is relatively inexpensive compared to the cost of the traditional paper survey.
A unique code number is required for the participants to include in the online questionnaire prior to completing the survey. This is important to address the authentication issue. Requiring the extra step may significantly reduce the response rate, but it is necessary to maintain the validity of data. The reasons why the online survey is adopted for this research are listed below:
Each school student has been provided with an email address by the Ministry of Education to access online resources for the virtual learning program. Therefore, the students should have access to the Internet for online learning regardless of their location.
Based on the census by MCMC in 2015, smartphones and mobile Internet are now popular among the teenagers in Malaysia. Answering the questionnaire using any devices is possible as the online questionnaire is also available in the cross-platform user interface.
3.6
Chapter Summary
This research used a quantitative and descriptive survey design. The questionnaires were administered by the researcher to collect the data from a convenience sample of 237 respondents.
32
The questionnaires had both closed and open-ended questions. The sample characteristics included respondents’ background, Internet usage background and abilities, difficulties in accessing the Internet, ICT usage for learning, and Internet security measures. These variables are vital to understand their problems in accessing the Internet as well as designing the system based on their Internet requirements. Permission was obtained from the Ministry of Education as well as the Sarawak Education Department. Consent was obtained from the school principals before performing the data collection. Anonymity and confidentiality were ensured during the pilot study. Data were collected by using online questionnaire and paper based questionnaire. Overall, this chapter described the sample, questionnaire design, and mixed mode data collection.
33
STATISTICAL DATA ANALYSIS FOR PROTOTYPE DESIGN
4.1
Introduction
The purpose of doing statistical data analysis is to identify the Internet usage trends among the indigenous children, discover useful information in their Internet learning insufficiency, and suggest a solution to provide better Internet education. Table 4.1 shows some of the variables, categories, and types that will be used for this statistical analysis.
Table 4.1: Variables description Variables
Categories
Age
12-year-old or less 13-15-year-old
Parent’s education level
Did not attend school Primary school graduate High school graduate College / university graduate Other Before 6 years’ old 13-15-year-old 7-9-year-old Never use the 10-12-year-old Internet I use Internet daily I use Internet at least once a week I use the Internet occasionally I have use the Internet for two years and more Never use the Internet Desktop computer Tablet computer Laptop computer E-book reader Smart phone Other
Age of first time using the Internet Internet usage extent
Electronic device usage
Types 16-18-year-old Above 18-yearold
Numerical
Number of Choices One single choice
Nominal
One single choice
Numerical
One single choice
Nominal
One single choice
Nominal
Multiple choices
Both descriptive and inferential statistical analyses that will be used in this study. The total number of respondents is n = 237. A few questions did not answered by the respondents and it is reported in each section. IBM SPSS (Predictive Analytics Software) version 21 is used to do the
34
analysis. The software has been developed by IBM Corporation in Java platform and it is widely used for statistical analysis in social science, education researchers and data mining.
4.2
Descriptive Statistics
Descriptive statistics are usually used to describe the characteristics of the collected data. The statistics used are the percentage and frequency to provide simple summaries of respondents’ socio-demographic profile, language usage, medium of assistance needed, ICT difficulties faced, and bad Internet content exposure.
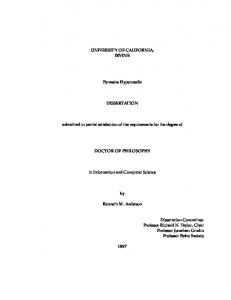
4.2.1 Socio-Demographic Profile The bar graph in Figure 4.1 shows the distribution of the respondents by gender and age.
Figure 4.1: Gender and age distribution
35
Most respondents in the survey are female (70.46%) while male respondents represent 29.54% of the total. However, this figure does not reflect at all the 2010 census, in which Serian district has a near equal number of female and male with even a little bit less female than male: 40,657 and 41,385 respectively. 99.58% of the respondents are between the age of 13 and 15 years old. Only 0.42% of the respondents are between the age of 10 and 12 years old. Out of 237, only 236 respondents gave an answer when asked about their ethnic group. As shown in the pie chart in Figure 4.2, the largest number of respondents (69.9%) is coming from the indigenous communities (Bidayuh, Iban and Kenyah), followed by Malay (19.1%), Chinese (9.3%), and others (1.7%). The last group (Others) contains Javanese, Eurasian and Sri Lankan students.
Others, 1.7% Iban, 20.3%
Chinese, 9.3%
Malays, 19.1%
Kenyah, 0.4%
Bidayuh, 49.2%
Figure 4.2: Ethnic group distribution Not all respondents provided an answer when asked about their parent’s education. Only 231 of 237 respondents gave an answer. It is found that 69.3% respondent’s parent finished
36
secondary school, 10.4% finished primary school, and 17.7% have a college or university degree. The remaining 1.7% has not received any formal education as shown in Figure 4.3.
Others, 0.9%
Not attending to school, 1.7%
University / college graduate, 17.7%
Finished primary school, 10.4%
Finished secondary school, 69.3%
Figure 4.3: Parent’s education level distribution
A summary of the socio-demographic profiles of the respondents is given in Table 4.2.
Table 4.2: Socio-demographic profiles of the respondents (N=237) Characteristics N % Female 167 70.46 Male 70 29.54 Age 13-15 year old 236 99.58 10-12 year old 1 0.42 Ethnic Group1 Bidayuh 116 49.15 Iban 48 20.34 Malay 45 19.07 Chinese 22 9.32 Kenyah 1 0.42 Others 4 1.70 Parent’s Education Level2 Secondary School 160 69.26 College / University 41 17.75 Primary School 24 10.39 Not Attending to School / Others 6 2.60 1 One respondent did not answer the question. The percentage is based on the total of 236 respondents. 2 Six respondents did not answer the question. The percentage is based on the total of 231 respondents. Gender
37
4.2.2 Language Usage Knowing that Malaysia is a multilingual country, it is not a surprise to see that most of the respondents can communicate in three different languages, even though their proficiency has not been tested. Table 4.3 indicates that Malay language, the official language of Malaysia, is highly utilised when learning in school (87.71%). However, English, which is the main Internet language, is only considered by the respondents as their third language (55.46%). This might entail that the respondents are facing a language barrier when accessing the Internet.
Bidayuh Mandarin Iban English Malay Melanau Other Total
Table 4.3: Language usage Language usage Language usage Third language at home at school usage N % N % N % 109 45.99 12 5.09 37 16.16 14 5.92 1 0.42 9 3.93 53 22.36 15 6.36 29 12.66 5 2.11 1 0.42 127 55.46 54 22.78 207 87.71 21 9.17 0 0.00 0 0.00 1 0.44 2 0.84 0 0.00 5 2.18 237
100.00
236
100.00
229
100.00
Instructions are expressed using natural languages in either written or spoken form. Thus, a clear understanding of the instructions is certainly with the user’s most familiar language. For example, a Bidayuh user will certainly have a better understanding of an instruction if it is written in Bidayuh language. This fact yields in considering the inclusion of a multi-language option to support the needs of various user backgrounds.
38
4.2.3 Internet Access Background Most respondents are going online at the age of 10-12 years old (54.5%). Some respondents are already exposed to the Internet since before six years old (2.5%) as illustrated in Figure 4.4. The percentage is based on the total of 237 respondents.
Before 6 year old, 2.5%
Never used the Internet, 4.2%
7-9 year old, 13.9%
13-15 year old, 24.9%
10-12 year old, 54.5%
Figure 4.4: Age of first time using the Internet
On average, respondents use the Internet occasionally (50.4%) as illustrated in Figure 4.5. This indicates accessing the Internet in rural areas is not comprehensive as there are only 32% respondents who can access the Internet daily. Places to get access to the Internet might be one of the reasons of low Internet usage among the respondents as indicated in Figure 4.6.
39
I have use the Internet for two years and more, 2.5%
Not using the Internet, 4.2% I use Internet daily, 32.0%
I use the Internet occasionally, 50.4%
I use Internet at least once a week, 10.9%
Figure 4.5: The extent of Internet use
It is expected that respondents get access to the Internet frequently at school due to the availability of computer labs and Internet learning. However, it is found that less than 20% respondents get access to the Internet at their school as illustrated in Figure 4.6. The majority of respondents get access to the Internet at their home subscribed Internet broadband (65.8%) and personal broadband subscription (51.3%). The percentage is based on the total number of 234 respondents. On the other hand, respondents can get proper Internet education from 1 Malaysia Internet centre as the MCMC provides ICT training programs, human capital development and related activities there. Moreover, there are also consumer awareness campaigns and Internet usage guides for the users. However, it is found that only 12.8% respondents visiting the 1 Malaysia Internet centre. This might be the location of the centre is not near to their house. Although only 4% of the respondents are not using the Internet, it still can be concluded that the Internet learning is very low as the majority of the respondents did not received a proper
40
Internet education at their school and less likely to visit 1 Malaysia Internet centre or Community Broadband Centre and Library.
70.0%
65.8%
60.0%
51.3%
50.0% 40.0% 30.0% 18.8%
20.0% 10.3%
15.0%
14.1%
10.0%
17.1%
12.8%
7.7% 2.6%
0.0%
0.0% Home subscribed Internet broadband
School library
School computer lab
School WiFi
Cyber café
Commercial place with free WiFi
Personal broadband subscription
1 Malaysia Wireless Village
1 Malaysia Internet Centre
Community Broadband Centre and Library
Other
Figure 4.6: Places to access the Internet distribution
Respondents reported that the most used electronic device is a smartphone as illustrated in Figure 4.7. This finding confirms the latest trend as indicated in the Internet user survey report by the MCMC in 2014 that smartphone has the highest percentage of ownership and widely used among the teenagers. This does not mean that the normal desktop and laptop computer usage is “out-of-date”. Computer desktop and laptop might be used during the ICT class at school. Thus, any e-learning system should be accessible from any types of devices.
41
100.0% 90.0% 80.0% 70.0% 60.0% 50.0% 40.0% 30.0% 20.0% 10.0% 0.0%
90.6%
37.9% 21.7% 12.8%
Desktop computer
Laptop Smart phone Tablet computer computer
1.7%
0.0%
E-Book reader
Other
Figure 4.7: Internet access device distribution
4.2.4 Educative and Assistive Mediums Current technologies for e-learning have expanded quickly to serve the learners. However, the Internet usage tutorial videos obtained from the popular video sharing website (e.g. YouTube) are not personalised. Language barrier for searching information can be challenging. It is expected that the learners will look for help when difficulties arise. Apparently, three respondents did not answer the question and the percentage is based on the total number of 234 respondents. 75.6% of respondents will ask somebody who has the knowledge to help them as illustrated in Figure 4.8. Besides that, respondents seek for a tutorial video (8.2%) or type the questions in the search engine box (7.7%) to find an answer for their question. An old fashion way to get help or hint is by using the built-in pop-up message or animated icon with sound which no Internet connection is needed. Some Internet users will do nothing and keep on surfing the Internet when a problem occurs (6.8%), perhaps they did not have any idea where to refer.
42
Type the question in search engine box, 7.7% Get help/ hint from pop-up message or animated icon with sound, 1.7%
See tutorial video on how to get the Information, 8.2%
Do nothing and keep on surfing the Internet, 6.8%
Ask friends/ teacher/ anybody who have knowledge to help me, 75.6%
Figure 4.8: Assistance seeking distribution
Based on this finding, it can be concluded that respondents, who are the school children, look for human help when facing any problem on the Internet. Therefore, similar kind of assistance should be available to the e-learning system. Additionally, when assessing the capability of the respondents using the Internet, more than 50% respondents can find online materials from the Internet, using English when surfing, and using Google search engine to find information. Figure 4.9 illustrates the results.
43
80.0%
72.4%
69.8%
70.0% 60.0%
56.0%
50.0% 38.8%
40.0%
34.9%
30.0% 20.0%
13.4%
12.5% 7.3%
10.0%
9.5%
0.0% Ability to find images, news, video, from many web pages Ability to use English as a medium when surfing the Internet Having trouble when searching information through the Internet because of language Native language usage in social media/chatting Ability to differentiate the Internet Explorer and Google Chrome icon Using google.com each time to find something on the Internet Directly type the URL of a webpage instead using search engine to find the specific web Misdirect information retrieval because of inadequate language Use online language translation webpage
Figure 4.9: Capability distribution
4.2.5 Facilities Used with Friends Respondents were asked to indicate the online facilities or applications (or apps) used when they browse the Internet or when they want to socialise with their friends. The online facility can be a social network service such as Facebook or an online messaging application such as WhatsApp.
44
For this study, respondents were given nine options to choose and they can select as many options as they want. Based on Figure 4.10, most respondents used the smartphone apps such as WeeChat and WhatsApp for communication purposes (75.1%). A total of 151 respondents (67.1%) indicated that they used social networking services such as Facebook to get connected with their friends and 44.4% of respondents use social media services for the entertainment and education purposes.
80.0% 70.0%
75.1% 67.1%
60.0% 50.0%
44.4%
40.0%
36.9%
33.3%
30.0%
20.0%
16.4% 10.2%
10.0%
13.3% 8.0% 0.4%
0.0% Social network service such as Facebook E-mail Online games Social media services e.g. Youtube, Wikipedia Newsgroup/blogs/mircoblogs Scanner / digital camera Videoconferencing (e.g. Skype) Smartphones apps (e.g. WhatsApp, Weechat) Online chatting (e.g. Chatbox) Other Figure 4.10: Used facilities and applications distribution
Therefore, since respondents like using smartphones, then the design of the e-learning should comply with the smartphone requirements, for example, the arrangement of the main page.
45
4.2.6 Self-Assessment on the Abilities When Using the Internet For this question, only 229 respondents answered the question comprising of 15 options. Each respondent can select as many options as he or she wants. The abilities to use the Internet by the respondents is prevailed by listening or downloading music (74.2%) (Table 4.4). However, their second highest choice is to watch entertainment videos as in YouTube (69.4%). This preference can be considered to suggest the relevant educative medium related to the respondents’ current practice.
Table 4.4: Abilities when using the Internet Answer Options
N
%
Listening to/download music Watching Youtube/video/entertainment Internet chatting/ social networking application/ blogging Playing games Downloading software Published photos, videos or music to share with others Checked information to satisfy a curiosity Sending/receiving e-mails Reading online newspapers/ weblog Looked up maps / timetable Online business/purchasing (E-commerce) Used a webcam Read e-book Used file sharing sites Registered my geographical location Total
170 159
74.2 69.4
138
60.3
123 120 108 71 51 37 35 23 17 14 7 4 1077
53.7 52.4 47.2 31.0 22.3 16.2 15.3 10.0 7.4 6.1 3.1 1.7 470.3%
Additionally, when assessing the respondent’s digital security skills, more than half of the respondents know how to change filter preferences (57.3%), delete the record of which website they have visited (51.1%) and block messages from someone they did not want to hear (51.6%). Figure 4.11 illustrates more on the respondents’ skills.
46
70.0%
60.0% 50.0%
57.3% 43.6% 36.9%
40.0% 30.0%
51.6%
51.1%
25.8%
28.9% 19.1%
20.0% 10.0% 0.0% Change filter preferences Bookmark a website Compare different websites to decide if information is true Block unwanted adverts or junk mail spam Delete the record of which website they have visited Change privacy settings on a social networking profile Block messages from someone I do not want to hear from Block pop-ups pages Figure 4.11: Respondent’s Internet safety skills
It is found that some respondents already have some advance skills regarding using the Internet. However, with the limited set of skills regarding the Internet safety, it is important to provide more tutorials in the educative and assistive medium for those children who did not have such skills. The proposed system should be able to eliminate such threats in order to provide a safe and secured Internet access environment.
4.2.7 ICT Difficulties Faced by Respondents For this question, only 220 respondents answered the question comprising of eight options. The last option is labelled as “Other”, which gives an opportunity to the respondents to express other problems. Each respondent can select as many options as he or she wants.
47
Learning how to use the Internet is a good idea if it is accessible. Through this study, it has been found that the most common problem identified by respondents is the limited access to the Internet due to the poor communication infrastructure inland (63.2%) as shown in Figure 4.12. The problem can be due to the respondents’ location, which is hilly with a limited network of roads. As a consequence, the installation of telecommunication infrastructure can become more expensive. Furthermore, ICT knowledge seems to be insufficient from the respondents’ point of view where 26.8% of them admitted that they did not have adequate ICT skills besides some report that their ICT class is overpopulated (15%).
100.0% 63.2%
50.0% 26.8%
23.6%
15.0%
13.6% 2.3%
1.4%
0.5%
0.0% Limited electrical resource Limited access/poor communication infrastructure Inadequate ICT skills by me Inadequate ICT skills by teacher Over population of students in ICT classroom ICT phobia Lack of funds Other Figure 4.12: ICT difficulties faced by the respondents
4.2.8 Security Measures and Bad Internet Content Exposure 224 respondents participated in answering the question related to the online security and safety. The question is made of five options. Based on the findings in Figure 4.13, the most used software
48
is the Antivirus for the spams and virus prevention (39.7%). The parental software for blocking or filtering unwanted websites comes only in the second place (28.3%), which means that more than 70% of the respondents are not protected at all against bad websites. However, 7.6% of the respondents are equipped with parental control software that keeps track of the visited websites.
None, 13.8%
Parental controls or software of blocking or filtering some types of website (Example: Internet Security), 30.0%
Software to prevent spam, junk mail, viruses (Example: Anti-virus), 39.7%
Parental controls or software of keeping track of the websites visited, 8.0%
A service or contract that limits the time child spends on the Internet, 8.5%
Figure 4.13: Distribution of installed security software or service The next section of the survey concerned with the respondent’s exposure to bad web pages as illustrated in Figure 4.14. 222 respondents answered the question made of 11 options. The last answer option as “Other” allows the respondent to provide an open-answer. From the 11 options, the option “By instant messaging” has not been selected at all. It is found that most of the respondents have seen sexual images from pop-ups or side advertisement when surfing the Internet (59%). The second place where respondents saw sexual images is on TV (57.7%). Respondents also reported that such images are posted in the chat rooms
49
or social messaging system (48.2%). It seems that respondents cannot avoid those unsuitable images when browsing the web or watching the TV. Therefore, an Internet web page filtering should be included to minimise the unexpected and undesired intrusion.
Other, 0.5% On a gaming website, 10.4% By e-mail, 3.2%
Posted in a chatroom / Whatsapp/ Telegram, 48.2%
On a social network sites, 21.6%
By pop-ups on the Internet / Side advertisement, 59.0%
On a photo sharing platform, 14.0% On a video sharing platform, 17.1%
On television / film, 57.7% In magazine / book, 29.7%
0.0%
10.0%
20.0%
30.0%
40.0%
50.0%
60.0%
70.0%
Figure 4.14: Seen sexual image and places happen
4.2.9 Learning through Mobile Device and Computer In this section, learning through personal computers and mobile devices is assessed. This is important to understand the differences in a user’s experience of using a mobile device and computer desktop for learning. The questionnaire is adapted from Nedungadi and Raman (2012) and the finding is showed in Table 4.5.
50
Table 4.5: Learning using mobile device and computer desktop Answer Options
N
%
I find it is easy to use the mobile device for learning Learning using the mobile device is fun I will spend more time learning on the mobile device than the computer I would recommend mobile learning as a method of study to my friends It is easy to communicate and get feedback from the teacher with mobile learning Mobile learning is more useful and helpful when it includes learning videos I will be happy to receive my marks through the mobile device I feel comfortable receiving personalised and immediate assessment feedback through text messaging Learning on the mobile is easier than learning on the computer Mobile learning gives me greater control over my learning Mobile learning can improve my collaborative learning with classmates I like to experiment with new ways of learning, like using mobile devices My school supports the use of mobiles for learning My teacher supports the use of mobiles for learning I need support while learning with a mobile device I will use my mobile for learning if my teachers use them I will use my mobile for learning if my friends use them Mobile devices can be used for learning more often than in the classroom, science lab, and computer lab I prefer the bigger screen of the computer to the small screen of the mobile device It was difficult to find the hint button on the mobile device I will use mobile for learning whether my friends are using it or not
160 130
69.9 56.8
84
36.7
69
30.1
84
36.7
80
34.9
67
29.3
87
38.0
99 46
43.2 20.1
63
27.5
70
30.6
27 42 88 44 73
11.8 18.3 38.4 19.2 31.9
45
19.7
55
24.0
20
8.7
110
48.0
1,543
673.8%
Total
It was found that nearly 70% of respondents agree that it is easy to use a mobile device for learning at the same time, more than 50% of them are happy to learn through it. Therefore, mobile device, especially the smartphone, is the closest tool for respondents to use and learn through it regardless the instruction is not given by the teacher.
51
4.3
Inferential Statistics
Inferential statistics are usually used to make inferences and predictions about a population. In this study, the chi-square test of independence and logistic regression analyses are used to perform the inferential statistics. A chi-square test of independence will be used to make judgments of the probability that an observed difference between groups is a dependable one or one that might have happened by chance (MacDonald & Headlam, 2008). While logistic regression is used to test a model to predict categorical outcomes of the dependent variable based on one or more independent variables that can be either continuous or categorical. In the analysis, the correlation of predictor variables (dependent variable) will be strongly related to the dependent variables but not strongly related to each other (Pallant, 2011).
4.3.1 Relation: Ethnicity and Parent’s Education Level In this study, the relationship between ethnicity and parent’s education need to be discovered. Therefore, a chi-square test for independence will be used to discover whether the assumption is true or not. Respondents were classified by ethnicity (indigenous or non-indigenous) and by parent’s education level (College/university graduate or Not college/university graduate). Table 4.6 shows the comparison between two categorical variables.
Table 4.6: Compared variables and their categories Variables Type Categories Ethnicity Categorical Indigenous/ Non-indigenous Parents’ education level College or university graduate / Not Categorical college or university graduate
52
Table 4.7 illustrates the cross-tabulation between ethnicity and parent’s education level. There was only 28 out of 166 indigenous respondents’ parent are highly educated, while the highly educated for non-indigenous parents are only 13 from 71. However, when looking at the fall of low and high education level percentage (58.2% > 11.8% and 24.5% > 5.5%), most of the parents from both ethnics are not highly educated.
Table 4.7: Ethnicity vs. parent’s education level cross-tabulation
Not Indigenous Indigenous Total
Education Level Low High Education Education 58 13 24.5% 5.5% 138 28 58.2% 11.8% 196 41 82.7% 17.3%
Count % of Total Count % of Total Count % of Total
Total
71 30.0% 166 70.0% 237 100.0%
The Yates continuity correction is used to “reduce the magnitude of the calculated chisquare, rendering it less likely to be found significant” (Haviland, 1990). The formula for the chisquare test of independence with Yates continuity correction based on Haviland (Haviland, 1990) is shown below: 𝑋 2 (𝑟 − 1)(𝑐 − 1) =
∑ 𝑎𝑙𝑙 𝑐𝑒𝑙𝑙
(|𝑓0 − 𝑓𝑒 | − 0.5)² 𝑓𝑒
where, r = number of rows in the contingency table c = number of columns in the contingency table 𝑓0 = observed frequency 𝑓𝑒 = expected frequency
53
In this case, the number of rows (r) is 2 and the number of columns (c) is also 2. Based on Table 4.8, the observed frequency fo is the count made from experimental data, while the expected frequency fe is calculated using probability theory for each cell in the contingency table. The formula to calculate expected frequency is shown below: 𝐸𝑖𝑗 =
𝑇𝑖 × 𝑇𝑗 𝑁
where, 𝐸𝑖𝑗 = expected frequency for the ith row / jth columm 𝑇𝑖 = total in the ith row 𝑇𝑗 = total in the jth row N = table grand total The output from IBM SPSS is shown in Table 4.8. The second column shows the corrected value is .007, with an associated significance level (p-value) of .935. This value is presented in the second row with column labelled Value and Asymp. Sig. (2-sided). To be significant, the Sig. value needs to be .05 or smaller. In this case, the value of .935 is larger than the alpha value of .05, so this concludes that the assumption made earlier cannot be accepted.
Table 4.8: Chi-square test Value
df
Asymp. Sig. (2-sided)
Exact Sig. (2-sided)
Exact Sig. (1-sided)
Pearson Chi-Square .072a 1 .788 b Continuity Correction .007 1 .935 Likelihood Ratio .072 1 .789 Fisher's Exact Test .852 .461 Linear-by-Linear Association .072 1 .788 N of Valid Cases 237 a. 0 cells (.0%) have expected count less than 5. The minimum expected count is 12.28. b. Computed only for a 2x2 table.
54
The phi coefficient, which is the correlation coefficient range from 0 to 1 is used to indicate the association level between the two variables where, if the value is near to 1, both variables indicate a strong association. In this study, the phi coefficient value shown in Table 4.9 is –.017, which is considered a very small effect and thus, the value indicates that the association between the two variables is very weak.
Table 4.9: Symmetric measures
Phi
-.017
Approx. Sig. .788
Cramer's V
.017
.788
Value Nominal by Nominal N of Valid Cases
237
Therefore, a chi-square test for independence with Yates continuity correction indicates no significant association between ethnicity and the parent’s education level, X2 (1, n = 237) = .007, p = .935, phi = -.017 where, the “X2” is the chi-square test, “1” is the degree of freedom, “n=237” is the total sample, “.007” is the Yates corrected value, “p= .935” is the significant level, and “phi= -.017” is the correlation coefficient level of the two variables. This concludes that the proportion of non-indigenous parents who received higher education is not significantly different from the proportion of indigenous parents who are also highly educated. Low parents’ education level implies a lack of parental involvement towards children’s education (Fleischmann & de Haas, 2016). Thus, both children communities need assistance to fill up the gap from parents’ education which may hamper their children’s academic success.
55
4.3.2 Relation: Finding True Information, Ethnicity and English Language A logistic regression analysis is a technique to assess the impact of a set of predictors on categorical dependent variables (DV). In this study, it is used to determine the factors of ethnicity and ability to use English are correlated with the ability to find true information from the Internet. The analysis is conducted with dichotomous dependent variables (i.e. with only two categories or values). The variables used in the empirical analysis are described in Table 4.10.
Table 4.10: Set of variables Variables Type Categories Able to find true information Categorical / Yes / No from the Internet Dependent Ethnicity Categorical / Indigenous / Non-indigenous Covariate Able of surfing the Internet using Categorical / Yes / No English Covariate
The analysis will include three types of output: 1. Assumptions tests results 2. Classification table results 3. Variables in equation table results The model contained two independent variables (IV) - able to use English when surfing and ethnicity. Table 4.11 shows the set of predictor variables that are selected for the analysis with the frequency of each category and the parameter coding. The ‘parameter coding’ is used in the SPSS logistic regression to label the output rather than using the value label for reference. In this case, the parameter coding for “No” and “Not-indigenous” are labelled as 0, while “Yes” and “Indigenous” are labelled as 1.
56
Table 4.11: Categorical variables codings Frequency (IV) Able to use English when surfing (IV) Indigenous or not
No Yes Not Indigenous Indigenous
108 129 71 166
Parameter coding (1) 0.000 1.000 0.000 1.000
Table 4.12 shows the results of the analysis without any independent variables used in the model. This model will serve as a baseline and able to classify 70.5% cases correctly. The value is based only on the higher percentage of respondents answering “No” to the ability to find true information. It is assumed that when the set of predictor variables is entered, the accuracy of these predictions will be improved.
Table 4.12: Classification tablea,b
Observed (DV) Able to Find True No Information? Yes Overall Percentage
Predicted (DV) Able to Find Percentag True e Correct Information? No Yes 167 0 100.0 70 0 0.0 70.5
a. Constant is included in the model. b. The cut value is .500
The chi-square test of model coefficients is used to provide an overall indication of how well the model performs. Table 4.13 shows the chi-square result of step, block and model where df means “degree of freedom” and Sig. “statistically significant”, which should be less than .05 for highly significant value.
57
Table 4.13: Chi-square test of model coefficients Step 1
Step Block Model
Chi-square 41.794
df 2
Sig. .000
41.794 41.794
2 2
.000 .000
The result of the test was statistically significant, X2 (2, N = 237) = 41.794, p < .0005, indicating that the model was able to distinguish between respondents who are able or unable to find true information from the Internet. Table 4.14 shows the percentage accuracy in classification when the predictor variables are included in the model. The model correctly classified 72.2% of cases overall, an improvement over the 70.5% compared to the classification result in Table 4.12.
Table 4.14: Classification tablea Predicted (DV) Able to Find True Information? Percentage Step 1
Observed (DV) Able to Find True Information?
No Yes
No 150 49
Overall Percentage a. The cut value is .500
Yes 17 21
Correct 89.8 30.0 72.2
Table 4.15 provides information about the contribution or importance of each predictor variables where,
B = direction of the relationship (negative or positive)
S.E. = standard error
Wald = Wald test, to determine statistical significance for each of the independent variables
58
df = degree of freedom
Sig. = statistical significance, should be less than .05 to contribute significantly to the predictive ability of the model
Exp(B) = odds ratios
Table 4.15: Variables in the equation 95% C.I.for EXP(B) B S.E. Wald df Sig. Ethnicity(1) -.591 .334 3.122 1 .077 Use English when 2.041 .368 30.808 1 .000 surfing(1) Constant -1.797 .375 22.932 1 .000 a. Variable(s) entered on step 1: Ethnicity, use English when surfing. Step 1a
Exp(B) .554
Lower .288
Upper 1.067
7.700
3.745
15.833
.166
Only one of the independent variables made a unique statistically significant contribution (with less Sig. value of 0.05) to the model which is “use English when surfing the Internet”, with an odds ratio of 7.70. This indicated that respondents who had the ability to use English while surfing the Internet were over 7 times more likely to find true information than those who did not use English when surfing the Internet. Based on this finding, it can be concluded that respondents are able to find true information if they can use the English language while surfing the Internet regardless their ethnicity.
4.4
Chapter Summary
Descriptive statistics and inferential statistics have been conducted to provide information on the respondents’ need when accessing the Internet. Some critical findings have been highlighted to propose a solution. Table 4.16 maps the vital findings to the proposed personalised features which later will be discussed to design and implement the system.
59
Table 4.16: Mapping survey findings and personalisation features Survey Findings English, the first language used on the Internet, is only considered as the third language for the respondents Near 70% found it is easy to learn through mobile device Besides smartphone, other devices are also used to access the Internet (laptop 37.9%, desktop 12.8%, etc.) Respondents are highly familiar with the social media and social networking interfaces Limited access/poor communication infrastructure which makes the download time longer Lack of parental assistance due to their education level: respondents need support when accessing the Internet Near 25% did not have anyone to refer to when surfing the Internet 15% of respondents found ICT classroom overpopulated
Personalisation Features Multi-language components
Cross-platform user interface: Adaptive user interface is used to support multi-device usage Minimise irrelevant screen information Clear arrangement of the contents based on the social media’s system interface Compress images
Educative and assistive mediums: Online aiding and support documentation Cover missing Internet lesson which should be obtained from school or from parent Help and information features, e.g. providing the latest information on Internet security tips Sexual images have been seen by Internet content filtering: respondents everywhere on the Internet (e.g. Provide safe content pop-ups 59%, chat rooms 48%, etc.) Recommended reliable web pages Only 28.3% used parental controls software 49.34% like to explore new things different from their friends 46.72% agree that ICT enables them to get ideas from subject specialists all over the world
60
DESIGN AND IMPLEMENTATION OF THE PERSONALISED INTERNET ACCESS PROTOTYPE
5.1
Introduction
This chapter describes the design and implementation of the Personalised Internet Access for Kids, henceforth called PIAK. The design is based on the user requirements from the survey findings and possible solutions in the literature review. The implementation is done by adapting existing source codes and online resources.
5.2
Conceptual Design Enhancement
PIAK conceptual design is based on two information: (1) the enhancement of the initial conceptual design presented in Figure 2.2, and (2) the findings from the statistical survey data analysis presented in Table 4.16. PIAK has two main personalisation components (Component A and Component B) with four sub-components: cross-platform user interface, language selection, educative and assistive mediums, and web content filtering (Figure 5.1). Component A is the entrance to Internet. It includes a cross-platform user interface, a multilingual access, and a set of mediums to assist the children in the use of Internet. Component B is the Web content filtering.
61
COMPONENT A
Educative and Assistive Mediums
Cross-Platform User Interface
World Wide Web
Below 18 years old
Main Page Access: Registration & Login
User Information Collection / Retrieval
Language Selection
COMPONENT B
Age identification
Personalised Internet Search Page
Web Content Filtering
User-Item Matrix
DMOZ Internet Directory
Figure 5.1: Enhanced conceptual design of PIAK
5.3
User Actions
There are a few user actions determined when the user is using the system. Figure 5.2 illustrates the possible activities that can be done by the users at certain pages.
Login Update profile
Look educational video
Register Select parent's education
Logout User
Read information provided Enter keywords
View webpage
Click on desired webpage/link
Click "Search" button
Figure 5.2: UML use case diagram
62
The user can register and login to the system. In the educative and assistive medium, the user can have a look on the educational video and clarify their parent’s education. By doing this, the user who is coming from a lower educated family is required to follow a short course regarding the Internet access before entering the search page. On the search page, users can read the information provided and click on any link or recommended web pages. When the user uses the search engine, a keyword is entered before clicking the search button. The user can view any web pages from the search results listing. Users are able to log out from the system once they have logged in. These activities also can be viewed in user’s perspective. There are two types of users: active users and new users. Table 5.1 lists the actions that these users can do.
5.4
Table 5.1: Possible user actions Active User Actions New User Actions Update user profile Register Fill in the form Click register button Search items / item Play tutorial video Play tutorial video Click on link Click on link Search items / item View web page in o More than 60 seconds’ view, View web page register link to the user-item o More than 60 seconds’ view, database register link to the user-item o Less than 60 seconds, do database nothing o Less than 60 seconds, do nothing
Main Page Access
The new user needs to register once before entering PIAK system while the active user needs to log in by using their username and password. To ensure that PIAK can be accessed by the user from a different background, a multilingual option is provided. The language selection will affect
63
the whole system language. This includes the on-screen text and the subtitle of the educative and assistive medium.
5.4.1 Main Page Access Design A UI mock-up of PIAK main page is shown in Figure 5.3.
Login Form
PIAK Main Page
Registration Form
Language option
Figure 5.3: PIAK main page design
The design requires a new user to fill in the form with their name, username, password, birthdate, and gender. The registered user needs to provide their username and password to log in. Meanwhile, language selection is placed below the screen. The purpose of obtaining user information is shown in Table 5.2.
Table 5.2: Purpose of user information Information Purpose Name (first name) Welcome text Name (last name) System maintenance Username Login, User-item matrix Password Login Birthdate Educative medium Gender System maintenance Training Educative medium Language (English, Bahasa Malaysia, Iban, etc.) Welcome text, Educative medium
64
5.4.2 Main Page Access Implementation This page is adapted from Facebook login UI. A bootstrap template of Facebook is downloaded and modified to reflect the PIAK UI mock-up. Figure 5.4 illustrates the UI for the desktop version, while Figure 5.5 shows the UI for the mobile version of new user registration (left) and active user login (right). The user interface is designed to appear smoothly on any device. This will increase the system usage through any platform.
Login form
Register form
Language selection
Figure 5.4: PIAK main page UI (desktop version)
Pages in the other languages are duplicated and saved in a folder with an abbreviated code for the language. For example - /en/index.php for English, /my/index.php for Malay or /ib/index.php for Iban. Although the language scope is limited to the respondent’s lingua franca, others can be added later. The system is able to redirect the visitors to their preferred language site
65
after logged into the system. For instance, when an Iban user logs into the system through English language interface, the system will redirect the user to Iban preferred language site. Users are allowed to change their preferred system language in the Profile Update page.
Login form Register form
Figure 5.5: PIAK main page UI (mobile version)
5.5
Educative and Assistive Mediums
A new user will be directed to the educative and assistive medium page to receive an early Internet education after registration. This initiative has been made compulsory for the new users below 18 years old and their parents did not graduate from college or university. PIAK system gives extra concern on the parent’s education as it is found that the children are less likely to get Internet education from the school (refer to Figure 4.6). It is found that the parents with higher education
66
can teach their children to use the Internet properly compared to the parents who are not highly educated (Livingstone et al., 2015). Therefore, to ensure that these users have a sufficient understanding of the Internet usage, they must finish the lesson before being able to enter PIAK search page.
5.5.1 Educative and Assistive Main Page Design The UI mock-up for the educative page is illustrated in Figure 5.6. There are four buttons for the user to choose based on their parent’s education.
Figure 5.6: PIAK educative page design
5.5.2 Educative and Assistive Main Page Implementation The educative medium is provided in English but personalised with the subtitle based on the user’s preferred language. The user can also access the tutorial page at any time by clicking on the Tutorial Page link provided. Learning through YouTube can be controlled by repeating playback,
67
rewinding or fast forwarding the video. Figure 5.7 illustrates the UI for desktop and mobile version.
Tutorial video
Parent’s education
Figure 5.7: Educative and assistive UI (desktop and mobile version)
5.5.3 Educative and Assistive Mediums Selection Mediums to educate the children are obtained from many resources such as info graphic, video, text and cartoons. First, the topic selection should be suitable for the children. Secondly, the information must be explained in simple language. Topics should cover the basic usage of Internet, safety precaution when surfing the Internet, the ethics practised when using social media, and also protecting personal information. The selected medium will go through an editing process such as embedding subtitles in videos and text translation for info graphic.
68
5.6
Search Page
An active user who has taken the basic Internet lesson will be directed to the PIAK search page upon login.
5.6.1 Search Page Design Figure 5.8 illustrates the UI design for the search page. A greeting text is placed above and personalised to the user by greeting user’s first name in the user’s preferred language. Furthermore, the greeting text will be considering the local time. It means that if a user X logs in in the morning, the greeting text will be “Welcome X, good morning!”. However, if X logs in in the afternoon, the greeting text will be changed into “Welcome X, good afternoon!”.
Greeting text
Tutorial link
Profile update
Log out
Search bar
Carousel banner List of categories
Recommended webpages Image¹ ___________ Webpage title ----------------Annotation
Image... ___________ Webpage title ----------------Annotation
Imageᶰ ___________ Webpage title ----------------Annotation
Figure 5.8: PIAK search page design
A tutorial link is provided to the user to get back to the educative and assistive medium. A profile update link is available for users to update their personal information as well as the logout link. A search bar located below is useful for users to find specific information or keywords when
69
the user cannot find any interest in the recommended web pages listing. The user is also able to browse many web pages based on the category listing on the left sidebar. Furthermore, a carousel banner is placed below the search bar to attract PIAK user to see some highlighted information. This could be on the Internet security subject or info graphic about the Internet education for the children.
5.6.2 Search Page Implementation A bootstrap theme of YouTube web page is downloaded and modified to provide such UI based on the mock-up. Instead of video (for the YouTube), the system represents web page in a box with an image and annotation of it. Figure 5.9 illustrates the UI for PIAK search page.
Links
Category selection
Search bar Educational banner
Recommended webpages
Figure 5.9: PIAK search page UI (desktop version)
However, when the UI is viewed using a smartphone, the contents are displayed in parallel as illustrated in Figure 5.10. The links above the search bar in mobile version are placed inside the
70
top right button. The carousel banner is resized fit to the mobile screen while each recommended web page is shown in a single box.
Links
Category selection
Search bar
Recommended webpages
Figure 5.10: PIAK search page UI (mobile version)
5.7
Search Engine
Google Custom Search Engine (CSE) is utilised to create a basic search engine to do searches in the DMOZ Kids and Teens Directory. Users are also able to perform searches for everything but the return results are still in a controlled environment. Google CSE provides custom ranking which can be used to personalise the search based on keywords, weighted labels and scores. Besides that, an autocomplete feature is also available to help the user to spell the word correctly. This will help
71
them to obtain results instantly by displaying useful queries as soon as they start typing in the search box.
5.7.1 Search Engine Design The searching feature is designed not to leave the current view of the web page when the user performs a searching. The search result appears in a box on top of the screen once the user performs keyword(s) searching. If the user clicked on any link, a new window will pop up and appear in front of the screen. The PIAK search result box remains open until the user clicked on the X mark on the upper right to close it. Figure 5.11 illustrates the mock-up of possible occurrence to the current window once the user performs a searching.
Greeting text
Tutorial link
Profile update
Log out
Search bar
Search result 1 . List of .categories . Search result n
Carousel banner X Recommended webpages Image¹ ___________ Webpage title ----------------Annotation
Image... ___________ Webpage title ----------------Annotation
Imageᶰ ___________ Webpage title ----------------Annotation
Figure 5.11: PIAK search engine design
5.7.2 Search Engine Implementation A JavaScript code provided by Google CSE is pasted on the above section where search box and search results will be rendered. Figure 5.12 (desktop and mobile version) illustrate the search results for keyword “computer”. There are about 552 results from DMOZ database compared to
72
2,360,000,000 results from the Google search engine itself on 3rd February 2017. The number of search results should be sufficient for the early Internet exposure to the children.
Search result popup
Figure 5.12: PIAK search result UI (desktop and mobile version)
5.8
System Implementation Requirements
There are some components needed to implement the system, namely, the programming language, the source of the web directory, the integrated development environment (IDE), the database, the web server and the platform.
5.8.1 Programming Language and the IDE PIAK website is developed using PHP 5, Python and JavaScript programming languages. The IDE to develop the website is using Adobe Dreamweaver CS4.
73
5.8.2 Human-Edited Directory of the Web The integration of human-edited directory of the web and the Internet content filtering should be able to provide a controlled and safe online environment. DMOZ Open Directory (http://dmoz.org) is an open content distribution which can be referred by anyone. The information from the DMOZ database is more assured to be represented to the children although it has limited listings of web pages compared to the listings available by Google search engine. Table 5.3 shows the comparison between DMOZ and Google listings.
1 2 3 4
Table 5.3: DMOZ Open Directory vs. Google DMOZ Open Directory Google Human verifies web pages Human does not verify web pages Listed web pages are safe for children Requires extra steps to filter out bad web pages Has categories Has no categories Limited listing Huge listing
5.8.3 Database and Connection MySQL is deployed to provide a database solution for PIAK website. Tables and queries are used to store the data. All data can be directly retrieved, updated and stored in the database tables. The MySQL database is connected using mysql_connect() function. This function represents a connection string to a data source. It plays a role as an intermediate object located between the client and server. In other words, it is a link to string the database to the requested site. Three tables in the database are utilised in the system to add, retrieve or update data, namely, the user_information, item_DMOZ and user_item. The database schema for the system is illustrated in Figure 5.13.
74
user_information
item_DMOZ 1
1
PK userName
PK url
user_item
userPassword
url
firstName n lastName
Website_name n
userName
Category
Description
userDOB userGender
userTraining userLanguage
Figure 5.13: Database schema for the system User’s personal information is stored in a user_information table with the Primary Key (PK) assigned to the userName. The userName is also used during the login to the system as well as the userPassword. Users are required to provide their information during registration for the purpose as shown in Table 5.2. DMOZ database contains url, Website_name, Category, and Description. The url is assigned as PK because each website has a unique web address. Furthermore, the user_item table is used to store visited web url and userName which later be used for the hybrid collaborative and content-based filtering to produce a list of recommended web pages.
5.8.4 Apache HTTP Server The execution is done using the Apache HTTP Server, an open-source Web server application developed by the Apache Software Foundation. It is also a component to support the combination
75
of MySQL database and PHP scripting language. Several advantages of using Apache HTTP Server are listed below:
Lower development cost due to no software licensing fee
Open source programming advantages
Apache was developed for a non-Microsoft operating system which malicious programs was written to take advantage of the Microsoft Windows vulnerabilities. Therefore, Apache has a higher reputation in security option than the Microsoft’s IIS (a Microsoft Windows machine to manage Web sites).
5.8.5 Development Platform The Personalised Internet Access website is developed on the Microsoft Windows 7 Ultimate platforms. The .PHP extension can be run on any platform which means, it also can be developed using any type of operating system.
5.9
Chapter Summary
This chapter explains the design and implementation of PIAK starting from the enhancement of the system design until the prototype development by using PHP programming language and MySQL database. The XML file of DMOZ Kids and Teens Directory is utilised to be the main source of web pages. The system is implemented with the specific features to personalise the Internet access for children. The prototype system is developed and tested at local host before it is uploaded to a web hosting. This prototype system can be reached at http://salt-unimas.org/piak. Next chapter describes the system testing and evaluation.
76
PIAK SYSTEM TESTING AND USER ACCEPTANCE TESTING
6.1
Introduction
Two methods are used for testing PIAK as shown in Figure 6.1. The black-box testing is for the assessment of the functions of PIAK. The user acceptance testing is done for the validation of PIAK’s features against end-users’ requirements.
Testing Methods
Black-box Testing
User Acceptance Testing
Figure 6.1: Testing methods
6.2
System Testing using Black-Box Testing
There are many testing techniques to test a system and this work will use the black-box testing. Black-box testing or functional testing is a technique to assess the functions of a system. The test cases can be done as soon as the functional specifications are completed. The test focuses on the output of the system, which is generated in response to a selected input (Figure 6.2). This will put the system developer in the end-user’s perspective of the system. End-users do not need to understand the internal mechanism of the system.
77
Webpage(s)
Figure 6.2: Black-box testing approach
The overall steps for the black-box testing are illustrated in Figure 6.3. The system developer, in this circumstance the researcher, needs to evaluate four test plans: (1) PIAK login page, (2) PIAK educative and assistive page, (3) PIAK search page, and (4) PIAK search engine. The findings are then reported (actual result) along with the expected result.
Testing Methods
Black-box Testing
User Acceptance Testing
4 test plans to be evaluated
Expected Result
Actual Result
system developer
Figure 6.3: Black-box testing steps
The reporting of the four test plans is shown in Table 6.1 for PIAK login page, Table 6.2 for PIAK educative and assistive page, Table 6.3 for PIAK search page, and Table 6.4 for PIAK search engine.
78
Table 6.1: Test plan 1: PIAK login page Test ID 1
2
3
4
Description
Expected Result
Precondition: PIAK login page is loaded using a smartphone. User selects preferred language. Precondition: PIAK login page is loaded using a computer. User selects preferred language. Precondition: User fills in the registration form. User creates new account User age: below 17 years’ old. User age: above 17 years’ old.
Actual Result
PIAK login page is loaded in PIAK login page is loaded in mobile version UI. mobile version UI. User can select a preferred language. PIAK login page is loaded in desktop version UI.
User can select a preferred language. PIAK login page is loaded in desktop version UI.
User can select a preferred language. User ends up on the tutorial page.
User can select a preferred language. User ends up on the tutorial page.
User ends up on PIAK User ends up on PIAK search search page. page. Precondition: Active user logs User is redirected to PIAK User is redirected to PIAK in from login page but with a search page in their search page in their preferred different language. preferred language. language.
Table 6.2: Test plan 2: PIAK educative and assistive page Test ID 1
2
3
Description Precondition: User from login page.
Expected Result comes
User is welcomed by PIAK.
User is shown with a tutorial video. Precondition: User states that User is allowed to enter PIAK their parent’s education is not search page after 5 minutes university or college level. educational video is played.
Actual Result User is welcomed by PIAK.
User is shown with a tutorial video. User is allowed to enter PIAK search page after 5 minutes educational video is played. User sees educational video User ends up on PIAK search User ends up on PIAK User presses Go button page. search page. Precondition: User states that Go button activated. Go button activated. their parent’s education is User is allowed to enter PIAK User is allowed to enter university or college level. search page anytime. PIAK search page anytime. User sees educational video User ends up on PIAK search User ends up on PIAK User presses Go to main page page. search page. button
79
Table 6.3: Test plan 3: PIAK search page Test ID 1
2
3 4
Description
Expected Result
Precondition: User comes User is welcomed by PIAK. from the educative and assistive page. User is recommended with several web pages. Precondition: Active user User is welcomed by PIAK. comes from login page User is recommended with several web pages. User clicks on a The clicked web page is popped recommended web page. up in a new window. User clicks on any link.
Actual Result User is welcomed by PIAK.
User is recommended with several web pages. User is welcomed by PIAK. User is recommended with several web pages. The clicked web page is popped up in a new window.
The clicked link is popped up in The clicked link is popped up a new window. in a new window.
Table 6.4: Test plan 4: PIAK search engine Test ID 1 2
Description
Expected Result
Actual Result
Precondition: User performs keyword(s) searching. Precondition: User is presented with a list of search result. User clicks any search result. User clicks X button.
Search result is presented in a box. The clicked link is popped up in a new window.
Search result is presented in a box. The clicked link is popped up in a new window.
Search result box is closed.
Search result box is closed.
Overall, all expected results are reported as they are in the actual results. It means that there are no incorrect or missing functions in PIAK, and no errors in the user interface.
6.3
User Acceptance Testing and Evaluation
The user acceptance testing steps are illustrated in Figure 6.4. A sample of end-users is asked to rank seven items to measure the usability of PIAK website and to ascertain whether the system features are successful in meeting user’s needs.
80
Testing Methods
Black-box Testing
User Acceptance Testing
end-user 7 items to be evaluated
5 scales to be selected 1
2
3
4
5
Figure 6.4: User acceptance testing steps
6.3.1 Tasks Description The seven items to be measured, summarised in Table 6.5, are (1) overall reaction to PIAK, (2) registration interface design, (3) educative video on basic Internet, (4) recommended web pages, (5) reading characters on the screen, (6) organisation of information, and (7) search engine result. The seven items are presented to the respondents in a form of an online questionnaire. A 5-point Likert-type scale is used in the questionnaire for ranking the items. The scale ranged from point 1 when the respondents disagree with the statement until point 5 when they agree. Thus, point 3 is neutral.
81
Table 6.5: Seven evaluated items for user acceptance testing No 1 2 3 4 5 6 7
Usability of the Website Overall reaction to the system Registration interface Educative video on basic Internet Recommended web pages displayed Reading characters on the screen Organisation of information Search engine result
Disagreement Difficult to operate Confusing Confusing
Likert Scale 1 2 3 4 5
Agreement Easy to operate Straightforward Clear
Terrible
Useful
Hard to read Confusing Unhelpful
Easy to read Clear Helpful
Initially, the researcher obtained permission from the school principal of Sekolah Menengah Kebangsaan Serian to perform the user testing of PIAK. The testing was conducted on 15th November 2016 at the computer lab of the school with the assistance of the ICT teacher. 30 respondents aged 13 years old volunteered to participate in the user acceptance testing. A briefing was given to the respondents before performing the evaluation tasks. After that, a task sheet as illustrated in Figure 6.5 was distributed to each respondent.
User No.: _____ Gender: Male / Female Ethnicity: _______________ Age: _______ Task Scenario: Task One – Choose your preferred language, register your account, and look at the first-time system user video. Task Two Have a look on the recommended web pages at the main system page and explore the content. Task Three Perform a searching using your own query/ keywords and see the results. (e.g.: GAMES)
Figure 6.5: Task sheet
Respondents were allowed to perform the task as many times as they want. Then, the online questionnaire was administered to get all the feedback. The questionnaire administration was done by the researcher by attending the testing session and observed the respondents answering all the
82
questions. Respondents were only guided when they asked for help to ensure that no misunderstanding will happen.
6.3.2 User Acceptance Testing Results Table 6.6 displays the characteristics of the 30 students who participated in this study. The demographic figures show that the respondents’ gender is equally distributed with a majority of indigenous respondents representing 43.4% (Bidayuhs, Ibans and Kadayan). Table 6.7 shows the results of the usability testing.
Table 6.6: Descriptive statistics of respondents’ characteristics (N = 30) Measure Gender Age Ethnic Group
Items Male Female 13-year-old Malay Bidayuh Iban Kadayan Chinese Others
Frequency 15 15 30 13 11 1 1 1 3
% 50 50 100 43.4 36.7 3.3 3.3 3.3 10
Table 6.7: Result of user acceptance testing No 1 2 3 4 5 6 7
Usability of the Website Overall reaction to the system Registration interface Educative video on basic Internet Recommended web pages displayed Reading characters on the screen Organisation of information Search engine result
1 0 1 1 0 0 0 0
83
2 2 0 2 3 3 3 1
Likert Scale 3 4 5 8 12 8 8 10 11 10 12 5 8 13 6 4 15 8 12 12 3 9 14 6 Average Mean
Mean 3.87 4.00 3.60 3.73 3.93 3.50 3.83 3.78
The numbers under each scale column indicate the number of users who rated the scale. The mean of the ratings is stated in the last column while the average mean is stated in the last row which is 3.78. This illustrates that all categories are positively accepted.
6.3.3 Analysis of User Acceptance Testing The second objective of this study is to design and implement a personalised Internet access for the indigenous children in Sarawak. Therefore, it is important to determine whether there is any difference on the acceptance rate between indigenous and non-indigenous respondents. Since the usability testing provides mean values (Table 6.7), the statistical measure that can highlight the differences is the independent-samples T test, which can evaluate the statistical differences between the means of two independent groups. Hence, the two variables used for comparing the two groups of respondents are: (1) indigenous/non-indigenous as an independent and categorical variable, and (2) respondents’ ratings as a dependent and continuous variable. The independent-samples T test requires the assumption of homogeneity of variance, that is both indigenous and non-indigenous groups have the same variance. The computation of the homogeneity of variance can be performed with Levene’s test, which can verify the assumption that the variances are equal across both groups. The calculation of the independent-samples T test is performed by the IBM SPSS software (refer Section 4.1), which outputs two kinds of tables: the group statistics table and the independent sample test table. The second table contains the statistical results of the Levene’s test for equality of variances and the t-test for equality of means. To explain the reading of all those tables, an example of the output from IBM SPSS is given in Figure 6.6.
84
IndigenousOrNot (1) overallReaction (2) regInterface (3) tutorialVideo (4) recWebpages (5) readingCharOnScreen (6) orgInformation (7) searchEngine
Levene's Test for Equality of Variances F Sig.
No
1
2
3
4
5
6
7
indigenous non-indigenous indigenous non-indigenous indigenous non-indigenous indigenous non-indigenous indigenous non-indigenous indigenous non-indigenous indigenous non-indigenous
Equal variances assumed Equal variances not assumed Equal variances assumed Equal variances not assumed Equal variances assumed Equal variances not assumed Equal variances assumed Equal variances not assumed Equal variances assumed Equal variances not assumed Equal variances assumed Equal variances not assumed Equal variances assumed Equal variances not assumed
.470
1.351
2.760
.805
.885
.007
1.612
.499
.255
.108
.377
.355
.936
.215
N
Mean
13 17 13 17 13 17 13 17 13 17 13 17 13 17
4.15 3.65 4.31 3.76 4.00 3.29 4.23 3.35 4.23 3.71 3.92 3.18 4.38 3.41
Std. Deviation .801 .931 .751 1.091 .707 1.047 .725 .862 .725 .985 .760 .728 .506 .712
Std. Error Mean .222 .226 .208 .265 .196 .254 .201 .209 .201 .239 .211 .176 .140 .173
T-test for Equality of Means
t
Df
Sig. (2tailed)
Mean Diff.
Std. Error Diff.
95% Confidence Interval of the Diff. Lower Upper
-1.567
28
.128
-.507
.323
-1.169
.156
-1.600
27.556
.121
-.507
.317
-1.156
.143
-1.534
28
.136
-.543
.354
-1.268
.182
-1.612
27.759
.118
-.543
.337
-1.233
.147
-2.090
28
.046
-.706
.338
-1.398
-.014
-2.200
27.661
.036
-.706
.321
-1.363
-.048
-2.956
28
.006
-.878
.297
-1.486
-.270
-3.027
27.693
.005
-.878
.290
-1.472
-.283
-1.613
28
.118
-.525
.325
-1.191
.142
-1.681
27.978
.104
-.525
.312
-1.165
.115
-2.733
28
.011
-.747
.273
-1.306
-.187
-2.717
25.378
.012
-.747
.275
-1.312
-.181
-4.176
28
.000
-.973
.233
-1.450
-.496
-4.370
27.893
.000
-.973
.223
-1.429
-.517
Figure 6.6: Example of independent-samples T test output (1)
85
The first table generated is the Group Statistics and it contains the following information:
The left-side mentions the name of evaluation type and the ethnicity
N corresponds to the number of respondents from each ethnic
Mean is calculated based on the sum of all values divided by the total number of values
Std. Deviation means standard deviation and it indicates a measure that is used to quantify the amount of variation or dispersion of a set of data values
Std. Error Mean for standard error mean indicates standard deviation of the sample mean
The second table generated called “Independent Samples Test” contains three main parts. The first part (the first column) mentions the name of evaluation type and two choices “Equal variances assumed” and “Equal variances not assumed”. The use of these two choices is explained later. The second part (the column with the title “Levene’s Test for Equality of Variances”) provides the result of the Levene’s test computation. The last and third part (the column with the title “t-Test for Equality of Means”) corresponds to the computation of the t-test. The information under the “Levene's Test for Equality of Variances” columns are as follows:
F stands for test statistic of the two-sample F test and it means a ratio of sample variances.
Sig. stands for significance and it means the p-value corresponding to this test statistic.
The information under the “t-Test for Equality of Means” columns are as follows:
t is the t-score, that is the t-statistics under the two different assumptions: equal variances and unequal variances. Note that the t-statistic is computed from the difference of means and the SE of that difference as difference/ (SE of difference). In
86
general, a variance or standard deviation calculated from n data values and one mean has n - 1 df.
Df is the degrees of freedom. It indicates the number of values in the final calculation of a statistic that are free to vary.
Sig. (2-tailed) is the p-value of the t-test. It indicates that the difference is significantly different from zero if the p-value is less than the pre-specified alpha level, usually 0.05.
Mean difference is the difference between the sample mean and the test value.
The reading of the information in the “Independent Samples Test” table goes through two steps as described in Figure 6.7.
STEP 1: Checking the value of the significance (Sig.) If Sig. value > .05, then use the first line in the table, corresponding to “Equal variances assumed”. If Sig. value < or = .05, then use the second line in the table, corresponding to “Equal variances not assumed”. STEP 2: Checking the value of the p-value (or Sig. (2-tailed)) If p-value > .05, then there is no significant difference between the two groups. If p-value value < or = .05, then there is a significant difference between two groups. Figure 6.7: Two steps reading independent samples test table
These two steps are explained through the example given in Figure 6.6. In that example, for the step 1, the Sig. value is .499 and it is bigger than .05. Therefore, the t-test reading will use the first line as shown in Figure 6.8.
87
Levene's Test
T-test for Equality of Means
for Equality of Variances No
F
Sig.
t
Df
Sig.
Mean
Std.
(2-tailed) Diff. Error
95% Confidence Interval of the
Diff.
Diff. Lower
Upper
Equal variances 1
.470
.499
-1.567
28
.128
-.507
.323
-1.169
.156
-1.600
27.556
.121
-.507
.317
-1.156
.143
assumed Equal variances not assumed
Figure 6.8: Example of independent-samples T test output (2)
For step 2, the p-value is .128 and it is bigger than .05. Therefore, one can conclude that there is no significant difference between indigenous and non-indigenous overall reaction to the system. The independent-samples T test of each of the seven items listed in Table 6.7 was computed using IBM SPSS software and the results are shown in Table 6.8. Since all the values of the significance (Sig.) under Levene’s test column are above .05, the reading of the t-test will select all rows corresponding to “Equal variances assumed”. The values that will be considered for the interpretation of the results are those under the column Sig. (2-tailed), which we recall is the p-value of the t-test.
88
Table 6.8: Independent-samples T test results of the seven evaluated items Levene's Test
T-test for Equality of Means
for Equality of Variances No
F
Equal variances 1
assumed
.470
Sig.
.499
Equal variances not assumed Equal variances
2
assumed
1.351
.255
Equal variances not assumed Equal variances
3
assumed
2.760
.108
Equal variances not assumed Equal variances
4
assumed
.805
.377
Equal variances not assumed Equal variances
5
assumed
.885
.355
Equal variances not assumed Equal variances
6
assumed
.007
.936
Equal variances not assumed Equal variances
7
assumed Equal variances not assumed
1.612
.215
t
Df
Sig.
Mean
Std.
95% Confidence
(2-tailed)
Diff.
Error
Interval of the
Diff.
Diff. Lower
Upper
-1.567
28
.128
-.507
.323
-1.169
.156
-1.600
27.556
.121
-.507
.317
-1.156
.143
-1.534
28
.136
-.543
.354
-1.268
.182
-1.612
27.759
.118
-.543
.337
-1.233
.147
-2.090
28
.046
-.706
.338
-1.398
-.014
-2.200
27.661
.036
-.706
.321
-1.363
-.048
-2.956
28
.006
-.878
.297
-1.486
-.270
-3.027
27.693
.005
-.878
.290
-1.472
-.283
-1.613
28
.118
-.525
.325
-1.191
.142
-1.681
27.978
.104
-.525
.312
-1.165
.115
-2.733
28
.011
-.747
.273
-1.306
-.187
-2.717
25.378
.012
-.747
.275
-1.312
-.181
-4.176
28
.000
-.973
.233
-1.450
-.496
-4.370
27.893
.000
-.973
.223
-1.429
-.517
89
When the p-value is above .05, it indicates that there are no significant difference between the two evaluated groups, indigenous and non-indigenous groups. There are four items (item 1, 2, 3, and 5) that have a p-value above .05 as shown in Table 6.9.
Table 6.9: No significant difference between indigenous and non-indigenous Indigenous No 1 2 3 5
Usability of the Website Overall reaction to the system Registration interface Educative video on basic Internet Reading characters on the screen
Non-indigenous
t-test
Mean
Std
Mean
Std
p-value
4.15
0.801
3.65
0.931
0.128
4.31
0.751
3.76
1.091
0.136
4.00
0.707
3.29
1.047
0.46
4.23
0.725
3.71
0.985
0.118
Interpretation PIAK can be operated easily by both groups. PIAK interface layout is familiar for both groups. The level of acceptance is the same for both groups. Both groups can read the characters on the screen easily.
Three items (item 4, 6, and 7) have a p-value below .05 (Table 6.10) indicating that there is a significant difference between the two evaluated groups.
Table 6.10: Significant difference between indigenous and non-indigenous Indigenous No 4
6
7
Usability of the Website Recommended web pages displayed Organisation information
Search result
Mean
Std
Non-indigenous Mean
Std
t-test p-value
4.23
0.725
3.35
0.862
0.006
3.92
0.760
3.18
0.728
0.011
4.38
0.506
3.41
0.712
0.00
of
engine
90
Interpretation Non-indigenous respondents are not satisfied with the recommended web pages. Non-indigenous respondents found the organisation of the information quite confusing Non-indigenous respondents found the search engine result quite unhelpful
6.4
Chapter Summary
Black-box testing and usability testing have been conducted to evaluate PIAK. All PIAK functions have been tested and worked as expected. The overall mean result of 3.78 indicates that the usability of PIAK website is successful even though some features are not accepted well by the non-indigenous respondents. To overcome the flaws, further adjustment is needed in the information organisation and recommendation. A further enhancement is also needed to the search engine to include a wide source of information retrieval. The next chapter will discuss more on the implication of the study.
91
DISCUSSION
7.1
Introduction
Accessibility to the Internet provides benefits and opportunities to the children in many ways. With the Internet at finger tips, children are able to access more information than ever before. The social interaction with the online communities can be valuable for self-learning and social skills development. However, it is important to understand the consequences of this attractive technology to the children if it is not supervised by the adults. Furthermore, the outcome of encouraging the children to use this technology must be assessed whether it plays a vital role in their lives, especially in delivering the educational contents, shaping identity, encourage a sense of belonging, and improve self-esteem.
7.2
Integrating Personalisation in E-Learning
In the context of e-learning as a supporting tool towards the learning person, it has been proved that learning can be enhanced if the contents are adapted to the student’s preferences, requirements and learning progress (Shi & Cristea, 2016). Personalisation has shown that students have better learning effectiveness when using e-learning after taking into consideration what they need (Lin & Wang, 2017). Thus, when the students are allowed to select the contents they need to learn based on their own level of understanding, this will help them to coordinate and clarify the concepts while simultaneously increase their learning interest. Furthermore, the Web content filtering techniques are applied to provide automatic recommendations to the students without requiring their explicit response. Recommended learning
92
resources are computed based on the current user’s recent navigation history, as well as exploiting similarities among users’ preferences. PIAK builds automatic recommendations actively in the elearning platform and it is composed of a hybrid filtering module: a combination of content-based filtering and collaborative filtering approaches to recommend learning items (which in this case the web pages), and a bad Web content filtering module by using a blacklisted URL and naïve Bayes algorithm to filter out bad web page URL from entering the search results. These techniques are reliable for discriminating good and bad Web documents for the children as they have become useful to recommend items (Alphy & Sharma, 2016) and remove the bad one (Sheu, 2017). Moreover, it has been proved that the combination of a systematised method of filtering bad websites using the updated blacklisted URL and naïve Bayes filtering algorithm, the identification of bad Internet contents can be done effectively (Kazemian & Ahmed, 2015). Thus, since the original recommendation technique has been tweaked to help people find web pages to read (refer to Section 2.2.3.2 and Table 6.10), and adapted to improve the selection of learning resources, the item-based collaborative filtering and naïve Bayes remains one of the most reliable recommended algorithms today.
7.3
Indigenous Children and Personalised Learning Technology
It should be noted that in the study, the personalised learning system has been tested by a group of indigenous and non-indigenous children. With respect to the first user evaluation result, it was found that the overall system is positively accepted by the respondents (refer to Table 6.7). The user acceptance analysis study was performed to compare the level of acceptance between the indigenous and non-indigenous children. Thus, as the second objective of the research is to
93
develop a personalised Internet access system for the indigenous children, it is compulsory to verify whether the indigenous children are accepting or rejecting the system. In the second analysis of the system evaluation, Table 6.8 indicates that there are some statistically significant differences in the system acceptance between the indigenous and nonindigenous users. The differences relate to the recommended web pages displayed, the organisation of the information and the search engine results which are found less likely accepted by the non-indigenous respondents (refer to Table 6.10). The web page recommendation did not satisfy their desires and they need to perform extra searching on their interests. Although the system interface looks like a YouTube interface, the contents offered are web pages and not videos. Thus, the system might not up to their prior expectation. Comparing to the indigenous respondents, they see the recommended web pages are truly something new to them. The information provided is worth to look and explore. Their appreciation for the system is very high as they are not widely exposed to the Internet contents. As for the organisation of information, the non-indigenous respondents tend to rate lower than the indigenous respondents’ due to the information arrangement can be quite confusing to them. As the indigenous respondents are not exposed to the varieties of the online system, they have to depend on the system to find useful information in a secured and controlled environment. At the moment, they feel very comfortable with the proposed system. Furthermore, with many restrictions applied to the search engine feature, the personalised search result is not satisfying the non-indigenous respondents. The other search engine includes varieties of results with a wide range of topics. They are more focused in the information retrieval as there is much information available in the official national language. Although some retrieved information is not related to what they need, they are able to find it with the help of their parents. Unfortunately, the indigenous respondents did not understand the national official language as a
94
whole. They found difficulties in filtering the retrieved information. So, they merely depend on the personalised search engine to find what they need. Therefore, the process of verifying that the solution (PIAK) works for the target users, which is the indigenous communities is successful. The differences in user acceptance can be perceived in socio-demographic perspective. The non-indigenous respondents live in a semi-urban area where the Internet connectivity is available through a wireless or fixed line. They also own smartphones that are equipped with Internet subscription. They are able to use many applications which contribute to their learning and productivity. They often seek information from the Internet to finish their school works and this improves their skills in finding true and reliable information. Meanwhile, the indigenous respondents mostly live in a rural area. They face restricted access to the outside world, whether through the transportation or the telecommunication facilities. Due to the meagre economic situation, subscribing to the Internet is rarely done and accessing it, requires additional cost for transportation to get to the nearest town. This unfavourable situation creates an obstacle for them to participate actively in any organisation where most organisations are now using the Internet to promote their activities (Resta & Laferrière, 2015). Their personal skills cannot be highlighted successfully in a community and participate in peer groups. Besides that, they cannot demonstrate their abilities in many domains such as music, film, photography or writing, although they may have many ideas on that. Some skills are developed when exploring the Internet and it cannot be built in isolation. However, the Internet users need to recognise and manage risk, to learn to judge and evaluate information, and to deal effectively with a virtual world that can sometimes be dangerous or hostile. Thus, PIAK is important for the deprived indigenous children to obtain such knowledge and stay safe in this new environment.
95
7.4
Challenges in Collecting Data from Indigenous School Children
Conducting a survey is the best approach in identifying a specific group or a category of people and collecting information from some of them in order to gain insight into the entire group practices, thinks, hopes and needs (Dillman et al., 2011). A survey can be done through face-toface and telephone interviews with their computer-assisted equivalents, self-administered mail questionnaires, and Internet surveys. Each method has its advantages and challenges. Both web and e-mail surveys are less costly than the mail surveys, but they require some ICT skill, which mail surveys do not. Telephone surveys are also less expensive than the face-to-face mode. Besides unavailability of Internet connection in rural areas, there are several challenges in collecting data from the indigenous communities listed below:
Obtaining consent letter over confidentiality of data collection from the Ministry of Education level until the school principal
Have to make a personal visit to do the survey to gain trust that the survey is legitimate for the study instead of using mail survey
Ask the school principal to appoint a teacher to represent the researcher in collecting data. It is not advised to leave the forms to the management personnel, hoping that they will do the assignment.
When possible, provide funding to entertain the representative such as a meal or a token of appreciation
School managements will be very busy when many critical exams and urgent matters need to be held during the survey administration. Thus, plan a schedule carefully.
96
The listed challenges need to be solved completely if one considers doing the same data collection towards the indigenous communities especially for the children. The challenges might not be similar if the survey is conducted towards the adults. It can be more challenging if:
Concern over the confidentiality of collected data can be used to change the ownership of properties
Personal visit is not accepted if not culturally appropriate
Local enumerators must be hired to avoid the language problem which includes training and extra costs
Extra funding to the communities to localise promotional efforts
Community leaders are very busy with many critical and urgent matters Very little was found in the literature towards the indigenous communities’ Internet usage.
At certain perspective, research from other countries might give some ideas on the challenges faced by those communities in accessing the Internet, but a system cannot be designed based on other’s Internet requirements as it might not totally reflect the challenges faced by the local indigenous communities. This can be done by using the survey method to collect data from the indigenous communities. The same assessment from previous literature with some modification to understand the Internet access background can push this research to a certain extent. Currently, there are many indigenous groups formed on the Facebook (Carlson, 2013). An alternative way to obtain responses from the indigenous communities is by conducting the online survey through the social media. However, the returned results may not totally reflect the actual situation of the indigenous communities especially for those who lived in the rural area. In the beginning of the study, the survey was planned to be conducted through an online questionnaire as it has been known that all government schools are equipped with a computer lab and Internet connection. This will help in: (1) data collection and data analysis accuracy, and (2)
97
saving time, energy and money for both researcher and respondents. However, upon entering the school to conduct the survey, five of six school principals informed that their computer lab did not have the Internet connection for many reasons (refer to Section 3.5). Thus, data collection has to be done manually. There are also many benefits when the survey is conducted in a manual way. The researcher can experience the real situations when arriving at the target location. This includes the limited communication lines, incomplete road infrastructure, difficult accessibility to the nearest town and the socio-economy of the locals. Therefore, survey trend towards mixed-mode is now encouraged when the Internet is not available and no response by mail surveys. Despite the rising costs for conducting face-to-face data collection is expected, the web survey still can be conducted at certain schools which have a good Internet connection. Thus, the researcher is now required to learn the procedures associated with multiple modes of collecting sample survey and apply the method or combination of methods that fit their specific situation. Nevertheless, when data collection was done manually, some respondents did not answer compulsory answers such as ethnicity and parent’s education. This kind of issue brings a challenge in collecting accurate data for the statistical analysis. Some respondents are also confused when they answer all questions with some questions do not need to be answered as it might be related to the previous one. Thus, conducting a survey is compulsory for the study in order to understand the problems deeply.
7.5
Knowledge Transfer to the Society
The study undertaken by Soh, Yan, Ong, and Teh (2012) provides evidence that there is a digital divide between ethnic groups in urban areas. This is due to the huge discrepancies on the home
98
computer ownership and Internet connections as well as the nature of access and usage. However, the similar findings have been recorded in this study among the rural youths and this indicates that the digital divide is clearly happening in the rural area. Malaysia is considered as a developing country. It is reported by the MCMC that the telecommunication infrastructure has been upgraded from time to time and the Internet coverage has been widened across the country, regardless through fixed line or wireless (Salman et al., 2013). Therefore, people who lived in the urban and rural area should be able to access the Internet and contribute towards the country development. However, as the population gets further inland, the Internet connectivity becomes limited (refer to Figure 4.12). Thus, the indigenous communities who mainly lived in the rural area, will not receive the same opportunities as the urban communities. This also will inhibit the learning development of the children. At certain extent, the potential of the rural communities is somehow stuck. They might have talents and products which can be shared with the world. But, due to the absence of telecommunication infrastructure, they do not have the opportunity to get many things. As the capacity to acquire Internet knowledge and skills to teach the students cannot be done, the knowledge transfer regarding the Internet education will stop at the certain boundary which is called “the rural area”. This barrier has made them leave behind from the current technology and knowledge advancement compared to the urban communities. Thus, the development of the country is not yet supported by the entire citizen and the potential of the country is restricted. This research found that gap and it urgently needs to be filled with an automated system to educate the user once they have access to the Internet. This leads to the adaptation of several features to the system framework to support the learning process. The scope of the knowledge transfer in the study is very much related to the problem of knowledge use in “the real world” and the “virtual world”. This is not given in depth by the parents
99
and teachers. Thus, the proposed system is playing an important role to replace the tasks of the adults and teachers by those in need. The digital divide between the indigenous and nonindigenous, rural and urban in transferring the knowledge should be minimised or even eradicated. In order to do that, the system will support prior knowledge to learning by providing an early exposure on the Internet. It then empowers the understanding of the learner by exposing a series of new knowledge and the applications of the knowledge. Internet users who are updated with this kind of knowledge are less likely to face any online threats. They know where to get accurate information, they know how to avoid fraud web pages and they know how to handle a bad situation once they are trapped in the worst-case scenario. To cover these, the researcher needs to focus on capturing knowledge about the indigenous children’s needs and preferences. With this knowledge, a solution can be directed at improving information retrieval, including the critical security information needed, and recommending information effectively. Then, the result can be allowed as best practices to the knowledge transfer to such children. Furthermore, when referring to the national education policy, this research is an added value to the implementation strategy to achieve the policy’s goal. As written in the Malaysia Education Blueprint for 2013-2025, ICT usage will enhance the teaching and learning where the students are able to access a wider range of knowledge contents. They will be able to learn at their own pace through distance-learning programmes (Ministry of Education Malaysia, 2013). The outcome of the study can improve the quality of integrated education by giving special attention to bridge the digital divide especially to the rural area communities by producing the individuals who are balanced in term of knowledge and skills with strong ethics and values. PIAK is equipped with an educative and assistive section which provides the users with many information regarding the ICT. Besides focusing on how to use the Internet to find
100
information, PIAK also exposes the users to a variety of online situations where the ethical values lesson is illustrated in info graphic and comic strip. This kind of attractive messages can improve their understanding of ethical value in their actions. This is also in line with the expansion technology of the Internet to cater the increase in childhood in rural areas. The target system users, who are the children of the indigenous communities can have free personalised Internet access, provided with basic Internet education, presented at their cognitive level and in their own preferred language. Furthermore, the National Broadband Initiatives have been launched in March 2010 to drive the national broadband penetration rate with one of the products is the Community Broadband Library in the rural areas. This initiative is followed by the 1Malaysia Internet Centre project (PI1M) in 2013 to provide collective broadband Internet access in 100 areas. With these initiatives, PIAK can be integrated at all public libraries and Internet centres in rural areas which are often visit by the indigenous children in rural areas. As a hub of Internet access and knowledge centre, the library is an excellent location to implement the system due to their convenient accessibility. PIAK will not only enable the indigenous communities to build confidence in finding information from the Internet but also contribute to Malaysia’s growth in knowledge sharing, this is in line with the national aspirations to emerge as a developed economy. With the growth of Internet literacy among the citizens, it will boost the knowledge transfer, enhance their quality of life and make their contributions more significant. Since there is a digital divide between the rural youths and the urban youths, the idea of personalising their Internet access through PIAK is now a possible solution. This is because the youngsters face an overwhelming number of choices every time they go online. For example, with one search of “free online game” at Google, it can present some 364,000,000 options. A system which can help cut through the clutter and deliver the youth a clear, targeted result stands to benefit
101
greatly. This is not just true for online games. More importantly, the rural youths need assistance and guidance to get what they need from the Internet (refer to Figure 4.8). They put a higher degree of expectation that the Internet should be tailored individually which a personalised Internet access system is needed to organise their Internet experience and that’s what makes PIAK is differ from other personalised e-learning systems. Although the youngsters are not encouraged to share their personal information to gain personalised messages, offers, and services, personalisation still can be done by tracking their inclination in any subjects for relevant recommendations and offers, without collecting their sensitive personal information. Moreover, a personalised system like PIAK can be more engaging, educational, time-saving, and memorable than standard, nonpersonalised information retrieval.
7.6
Chapter Summary
The aim of this chapter is to discuss the personalisation in the context of e-learning where the Web contents filtering techniques are found reliable in discriminating the good and bad Web documents for the children. Some challenges in collecting data from the indigenous communities are also highlighted in this chapter. Mixed method in survey implementation is proven the most appropriate one to collect data from the indigenous communities. Although it is found that both ethnicities did not have any significant differences in parent’s education level and finding true information from the Internet (refer to section 4.3), their different acceptance rate in some parts of PIAK has been discussed. PIAK is a product that can be integrated into the learning process such as accessing the information from the Web and ethical values. Thus, the idea of personalisation in Internet learning is the best solution to bridge the digital divide among the rural youth.
102
CONCLUSION AND FUTURE WORK
8.1
Introduction
The main goal of the current study is to personalise the Internet access for the indigenous community in Sarawak, especially the indigenous children. This chapter presents the conclusion of the study. An overview of the actual contributions of the study is presented first. The contributions are derived from the objectives of the study. The chapter closes with a presentation of the limitations of the study and the proposed recommendations for future works.
8.2
Contributions
This study has achieved all three objectives as set at the beginning of this thesis. Table 8.1 highlights the expected and actual contributions of the study.
Table 8.1: Contributions of the study derive from the objectives No 1
2
3
Objective To identify the problems faced by the indigenous children of Sarawak in accessing the Internet through the literature and a survey study. To design and implement a personalised Internet access to the indigenous children in Sarawak based on the identified problems. System evaluation and usability assessment.
Expected Contribution A better understanding of the problems and needs of the indigenous children of Sarawak in regard to Internet access. A prototype that can assist the indigenous children in accessing safely the Internet.
Actual Contribution Statistical analysis of the problems faced by school children in Serian district.
Design, implementation, and evaluation of PIAK.
Black-box testing and usability A working prototype. testing system reports.
103
The main contribution of the study are the statistical data analysis of the problems faced by the children in Serian district. It is followed by the design, implementation and the evaluation of a personalised Internet access system which should be able to assist the children in accessing the Internet. At the end of the study, a working prototype namely PIAK can be used by the children to personalise their Internet access.
8.3
Limitations of the Study
Based on several issues after the implementation of the prototype, a few limitations are recognised as described in the following sections.
8.3.1 Lack of Respondents A larger sample with more diversity of indigenous communities would have benefited the results. This may lead to extensive and comprehensive problem identification to the study. However, more than 70% of respondents are indigenous children, which is enough to reflect the needs of the indigenous community in accessing the Internet. Furthermore, the system is tested by 30 respondents from a school. Although users’ satisfaction is achieved, it does not reflect all indigenous children to accept such system. NonInternet users should be encouraged to test the system for their first time connecting to the Internet.
8.3.2 Lack of Available Indigenous Languages Resource Initially, only one indigenous language is available for the system interface which is Iban. Although the majority of respondents were Bidayuhs, there was no official Bidayuh thesaurus
104
available as it has five different Bidayuh dialects compared to Iban which only has one (Rensch et al., 2012). Moreover, the educational video is delivered in the English language with only two subtitles which are the English and Malay.
8.4
Future Work
In the future study, a wider group of indigenous participants involving the non-Internet experienced users should be considered. This is to find unexpected details of their needs in accessing and finding information from the Internet. Besides that, the system should be tested by other ethnic groups and feedbacks must be recorded for system’s improvement. Additional indigenous languages will be included in the system. This will benefit all systems users from different backgrounds. The tutorial video provided will be dubbed in native languages as well as the subtitle. It also needs to be done in several short courses. Subsequently, PIAK can be promoted worldwide as a platform to assist and provide a safe Internet environment for the indigenous communities.
105
REFERENCES
Alphy, M., & Sharma, A. (2016). Study on Online Community User Motif Using Web Usage Mining. In Journal of Physics: Conference Series (Vol. 710, No. 1, p. 012015). IOP Publishing. Amrutkar, C., Kim, Y. S., & Traynor, P. (2016). Detecting Mobile Malicious Webpages in Real Time. IEEE Transactions on Mobile Computing, 16(8), 2184-2197. Antos, K., Headrick, T. R., & Richardson, C. S. (2007). U.S. Patent Application No. 11/784,880. Area-Moreira, M., Hernández-Rivero, V., & Sosa-Alonso, J. J. (2016). Models of Educational Integration of ICTs in the Classroom. Comunicar, 47(24), 79–87. Bhatnagar, V. (2016). Collaborative Filtering Using Data Mining and Analysis. IGI Global. Carlson, B. (2013). The “New Frontier”: Emergent Indigenous Identities and Social Media. The Politics of Identity: Emerging Indigeneity, 147–168. Sydney: University of Technology Sydney E-Press. Clothey, R. A. (2015). ICT and Indigenous Education: Emerging Challenges and Potential Solutions. In Indigenous Education (pp. 63-75). Springer Netherlands. Deer, K., & Håkansson, A.-K. (2006). Millennium Development Goal 8 and the Information Society. Retrieved from http://unpan1.un.org/intradoc/groups/public/documents/gaid/unpan033376.pdf. Dumitrache, I.-C., & Dumitraşcu, V. (2014). The Principle of Personalization – The Basis for an Efficient Educational Process. Procedia - Social and Behavioral Sciences, 128, 463–468. Dyson, L. E. (2004). Cultural Issues in the Adoption of Information and Communication Technologies by Indigenous Australians. In Proceedings Cultural Attitudes Towards Communication and Technology (pp. 58-71). Perth: Murdoch University. Fleischmann, F., & de Haas, A. (2016). Explaining Parents' School Involvement: The Role of Ethnicity and Gender in the Netherlands. The Journal of Educational Research, 109(5), 554-565. Fowler, F. J., & Cosenza, C. (2008). Writing Effective Questions. In Leeuw, E. D., Hox, J. J., Dillman, D. A. (Eds). International Handbook of Survey Methodology. London: Psychological Press. Giannoulis, N., Kagia, A., Kakoulidis, P., Rikkou, C., & Skourlas, C. (2013). Personalized Adaptive
106
Networked Learning for Disabled Students & Social Networking for the Inclusion of Students – The Multimedu tool. Procedia - Social and Behavioral Sciences, 73, 451–455. Goy, A., Ardissono, L., & Petrone, G. (2007). Personalization in E-Commerce Applications. In The Adaptive Web (pp. 485–520). Springer Berlin Heidelberg. Grant, S., Dyson, L. E., & Robertson, T. (2010). A Participatory Approach to the Inclusion of Indigenous Australians in Information Technology. In Proceedings of the 11th Biennial Participatory Design Conference (pp. 207-210). ACM. Hashim, R., Idris, K. S., Ustadi, Y. A., & Baharud-din, Z. (2011). Digital Inclusion Among the Indigenous People (Orang Asli Semai) of Perak, Malaysia. In Computer Applications and Industrial Electronics (ICCAIE), 2011 IEEE International Conference on (pp. 224-228). IEEE. Hassenzahl, M. (2004). The Interplay of Beauty, Goodness, and Usability in Interactive Products. Human Computer Interaction, 19(4), 319–349. Haviland, M. G. (1990). Yates’s Correction for Continuity and the Analysis of 2 × 2 Contingency Tables. Statistics in Medicine, 9(4), 363–367. Hearst, M. A. (2009). Search User Interfaces (1st ed.). Cambridge University Press, New York, NY, USA. Hoe, K. S. (2009). Malaysia’s Drive for High Speed Broadband (Vol. 3). Cyberjaya. Retrieved from http://www.skmm.gov.my/skmmgovmy/media/General/pdf/MYC04_all_lowres.pdf Kamarudin, A. N. A., & Ranaivo-Malançon, B. (2015). Simple Internet Filtering Access for Kids using Naive Bayes and Blacklisted URLs. In International Knowledge Conference. Kuching: Pustaka Sarawak. Kay, J. (2008). Lifelong Learner Modeling for Lifelong Personalized Pervasive Learning. IEEE Transactions on Learning Technologies, 1(4), 215–228. Kazemian, H. B., & Ahmed, S. (2015). Comparisons of Machine Learning Techniques for Detecting Malicious Webpages. Expert Systems with Applications, 42(3), 1166–1177. Koutrika, G., & Ioannidis, Y. (2004). Rule-Based Query Personalization in Digital Libraries. International Journal on Digital Libraries, 4(1), 60–63.
107
Krejcie, R. V, & Morgan, D. W. (1970). Determining Sample Size for Research Activities. Educational and Psychological Measurement, 30, 607–610. Lee, N., & Cribbin, J. (2011). Lifelong Learning in Hong Kong : Marketisation and Personalisation of Lifelong Education. International Journal of Continuing Education and Lifelong Learning, 4(1), 49– 71. Leeuw, E. D., Hox, J. J., Dillman, D. A., & European Association of Methodology. (2008). International Handbook Of Survey Methodology. New York: Lawrence Erlbaum Associates. Leon, A. C., Davis, L. L., & Kraemer, H. C. (2011). The Role and Interpretation of Pilot Studies in Clinical Research. Journal of Psychiatric Research, 45(5), 626–629. Lin, C., & Wang, T. (2017). Implementation of Personalized E-Assessment for Remedial Teaching in an E-Learning
Environment.
EURASIA
Journal
of
Mathematics,
Science
&
Technology
Education, 13(4), 1045-1058. Livingstone, S., Haddon, L., Görzig, A., & Ólafsson, K. (2011). Risks and safety on the internet: the perspective of European children: full findings and policy implications from the EU Kids Online survey of 9-16 year olds and their parents in 25 countries. EU Kids Online, Deliverable D4. EU Kids Online Network, London, UK. Livingstone, S., Mascheroni, G., Dreier, M., Chaudron, S., & Lagae, K. (2015). How parents of young children manage digital devices at home: The role of income, education and parental style. London: EU Kids Online, LSE. MacDonald, S., & Headlam, N. (2008). Research Methods Handbook: Introductory Guide to Research Methods for Social Research. Manchester: Centre for Local Economic Strategies. Ministry of Education Malaysia. (2013). Malaysia Education Blueprint 2013-2025 (Preschool to PostSecondary Education) Executive Summary. Ministry of Education Malaysia. Retrieved from http://www.moe.gov.my/cms/upload_files/articlefile/2013/articlefile_file_003108.pdf Miniwatts Marketing Group. (2016). World Internet Users Statistics and 2016 World Population Stats. Retrieve from http://www.internetworldstats.com/stats.htm
108
Mohd Nor, R., Chapun, T. E., & Wah, C. R. J. (2013). Malaysian Rural Community as Consumer of Health Information and Their Use of ICT. Malaysian Journal of Communication, 29(1), 161-178. Mulvenna, M. D., Anand, S. S., & Büchner, A. G. (2000). Personalization on the Net Using Web Mining: Introduction. Communications of the ACM, 43(8), 122–125. Murdoch, S. J., & Anderson, R. (2008). Tools and Technology of Internet Filtering. Access Denied: The Practice and Policy of Global Internet Filtering, 1(1), 58. Nedungadi, P., & Raman, R. (2012). A New Approach to Personalization: Integrating E-Learning and MLearning. Educational Technology Research and Development, 60(4), 659–678. Neuhold, E., Niederée, C., & Stewart, A. (2003). Personalization in Digital Libraries – An Extended view. Digital Libraries: Technology and Management of Indigenous Knowledge for Global Access, 1-16. Okon, U. (2015). ICT for Rural Community Development: Implementing the Communicative Ecology Framework in the Niger Delta Region of Nigeria. Information Technology for Development, 21(2), 297-321. Pallant, J. (2011). SPSS Survival Manual. McGraw-Hill Education (UK). Paul, S. (2015). Tuning the Library Performance. In 2015 International Conference on Developments of E-Systems Engineering (DeSE) (pp. 137–140). IEEE. Rasta, P. (2011). ICTs and Indigenous People. UNESCO Institute for Information Technologies in Education
Policy
Brief,
(June).
Retrieved
from
http://iite.unesco.org/files/policy_briefs/pdf/en/indigenous_people.pdf Rennie, E., Crouch, A., Wright, A., & Thomas, J. (2013). At Home on the Outstation: Barriers to Home Internet in Remote Indigenous Communities. Telecommunications Policy, 37(6), 583–593. Rensch, C. R., Rensch, C. M., Noeb, J., & Ridu, R. S. (2012). The Bidayuh language: Yesterday, today and tomorrow. Kuching: Dayak Bidayuh National Association. Resta, P., & Laferrière, T. (2015). Digital Equity and Intercultural Education. Education and Information Technologies, 20(4), 743–756.
109
Riecken, D. (2000). Personalized Views of Personalization. Communications of the ACM, 43(8), 27–28. Salman, A., Choy, E. A., Amizah, W., Mahmud, W., & Latif, R. A. (2013). Tracing the Diffusion of Internet in Malaysia: Then and Now. Asian Social Science, 9(6), 9. Saul, C. (2013). An Adaptation Model for Personalized E-Assessment. International Journal of Emerging Technologies in Learning, 8(2), 5–13. Segaran, T. (2007). Programming Collective Intelligence: Building Smart Web 2.0 Applications. Beijing: O'Reilly. Sheu, J. (2017). Distinguishing Medical Web Pages from Pornographic Ones : An Efficient Pornography Websites Filtering Method. International Journal of Network Security, 19(5), 839–850. Shi, L., & Cristea, A. I. (2016). Learners Thrive Using Multifaceted Open Social Learner Modeling. IEEE MultiMedia, 23(1), 36–47. Shi, Y. U., Larson, M., & Hanjalic, A. (2014). Collaborative Filtering beyond the User-Item Matrix : A Survey of the State of the Art and Future Challenges. ACM Computing Surveys (CSUR), 47(1), 3. Smith, B., & Linden, G. (2017). Two Decades of Recommender Systems at Amazon.com. IEEE Internet Computing, 21(3), 12–18. Soh, P. C.-H., Yan, Y. L., Ong, T. S., & Teh, B. H. (2012). Digital Divide amongst Urban Youths in Malaysia – Myth or Reality? Asian Social Science, 8(15), 75–85. SurveyMonkey
Inc.
(2016).
San
Mateo,
California,
USA.
Retrieved
from
https://www.surveymonkey.com/mp/aboutus/directors/ Tengtrakul, P., & Peha, J. M. (2013). Does ICT in Schools Affect Residential Adoption and Adult Utilization Outside Schools? Telecommunications Policy, 37(6–7), 540–562. Torres, R., McNee, S. M., Abel, M., Konstan, J. A., & Riedl, J. (2004). Enhancing Digital Libraries with TechLens. In Digital Libraries, 2004. Proceedings of the 2004 Joint ACM/IEEE Conference on (pp. 228-236). IEEE. Van der Heijden, H. (2003). Factors Influencing the Usage of Websites: The Case of a Generic Portal in the Netherlands. Information and Management, 40(6), 541–549.
110
Wright, K. B. (2005). Researching Internet-Based Populations : Advantages and Authoring Software Packages, and Web Survey Services Advantages of Online Survey Research. Journal of ComputerMediated Communication, 10(3), 201-210. Wu, D., Tremaine, M., Instone, K., & Turoff, M. (2002). A Framework for Classifying Personalization Scheme Used on e-Commerce Websites. In System Sciences, 2003. Proceedings of the 36th Annual Hawaii International Conference on (pp. 12-pp). IEEE.
111
APPENDICES
112