World Academy of Science, Engineering and Technology International Journal of Computer, Electrical, Automation, Control and Information Engineering Vol:10, No:1, 2016
Fake Account Detection in Twitter Based on Minimum Weighted Feature set Ahmed El Azab, Amira M. Idrees, Mahmoud A. Mahmoud, Hesham Hefny
International Science Index, Computer and Information Engineering Vol:10, No:1, 2016 waset.org/Publication/10003176
Abstract—Social networking sites such as Twitter and Facebook attracts over 500 million users across the world, for those users, their social life, even their practical life, has become interrelated. Their interaction with social networking has affected their life forever. Accordingly, social networking sites have become among the main channels that are responsible for vast dissemination of different kinds of information during real time events. This popularity in Social networking has led to different problems including the possibility of exposing incorrect information to their users through fake accounts which results to the spread of malicious content during life events. This situation can result to a huge damage in the real world to the society in general including citizens, business entities, and others. In this paper, we present a classification method for detecting the fake accounts on Twitter. The study determines the minimized set of the main factors that influence the detection of the fake accounts on Twitter, and then the determined factors are applied using different classification techniques. A comparison of the results of these techniques has been performed and the most accurate algorithm is selected according to the accuracy of the results. The study has been compared with different recent researches in the same area; this comparison has proved the accuracy of the proposed study. We claim that this study can be continuously applied on Twitter social network to automatically detect the fake accounts; moreover, the study can be applied on different social network sites such as Facebook with minor changes according to the nature of the social network which are discussed in this paper.
Keywords—Fake accounts detection, classification algorithms, twitter accounts analysis, features based techniques.
S
I. INTRODUCTION
OCIAL networking phenomenon has grown tremendously through the last twenty years. During this rise, the different types of social networking have created many online activities which instantly attracted the interests of large number of users where users increasingly depend on the credibility of the information exposed on Online Social Networks (OSNs) [1] . On the other hand, OSNs suffer from expanding the number of fake accounts that has been created, fake accounts means that the accounts do not match to real humans. Fakes can present fake news, web rating, and spam. OSN operators currently expend different and determined resources to detect, physically confirm, and close fake accounts. Twitter is used by a wide variety of clients, a large Ahmed El Azab, Mahmoud A. Mahmoud (associate professor), and Hesham Hefny (Professor) are with the Institute of Statistical Studies and Research, Cairo University, Egypt, (e-mail:
[email protected],
[email protected],
[email protected]). Amira M. Idrees (associate professor) is with the Faculty of Computers and Information - Fayoum University, Egypt (corresponding author, phone: 00201113900394; e-mail:
[email protected]).
International Scholarly and Scientific Research & Innovation 10(1) 2016
part of these active clients are mobile users (almost 46%) [2]. Tweets can be published by sending e-mails, or sending SMS text messages Twitter allows users to publish and exchange 140 character messages capacity (known as tweets), directly from smart phones using a wide array of Web-based services. Twitter spreads information to a large group of users who are active in real time. Reference [3] classified incredible events on Twitter in two main types: they are “clearly incredible, and seemingly incredible”. The first type expresses the events that are discovered to be fake, some examples of these events are the false news announced by politicians, or rumors that are spread among the public for different reasons. The second type expresses the events that seem to be fake, some examples of these events are the tweets that provide conflicting contents, or tweets that do not have any evidence of correctness. One of the main problems in social media is the scammers as they can use their accounts for different targets. One of these targets is spreading rumors which may affect a determined business [4] or even the society as a larger segment [5]. One of the examples in 2013, in the event of the Boston Marathon Bombing, a fake account on twitter has taken the advantage of the kindness of the people by twitting an announcement for a donation of $1 for each retweet [5]. According to the importance of the effect of social media to the society, in this research, we aim to detect the fake profile accounts from twitter online social network as a step towards the detection of fake news. Section II of this research paper, presents the previous work related to the discussed subject. Section III presents a description of the proposed method in details with presenting the results’ analysis, Section IV provides a discussion of the results with demonstrating the findings of applying the proposed method, and finally Section V concludes the research subject and presents our future work plan. II.PREVIOUS WORK Different researches have been presented to detect fake accounts with different approaches. In this research, we will follow the feature based detection approach [6]. This approach is based on monitoring the behavior of the user such as his number of tweets, retweets, friends, etc. this concept is based on the confidence that humans usually behave differently than the fakes, therefore, detecting this behavior will lead to the revealing of the fake accounts [7]. In this section, we will demonstrate some of the works that have been presented in this area. Reference [8] has reached an accuracy of 84.5% to detect spammers by identifying 23 attributes, most of these attributes
13
scholar.waset.org/1999.4/10003176
International Science Index, Computer and Information Engineering Vol:10, No:1, 2016 waset.org/Publication/10003176
World Academy of Science, Engineering and Technology International Journal of Computer, Electrical, Automation, Control and Information Engineering Vol:10, No:1, 2016
(17 attributes) are demonstrated in Table I which was mentioned in his research. However, in our research, we have reached more accuracy with smaller set of attributes as will be discussed in Section III. In [9], the set of attributes has been minimized by identifying ten attributes for detection, the attributes are presented in Table I. However, as mentioned in this research, the result was not promising for identifying fake accounts with more optimistic perspective that it is able to identify fake tweets with higher accuracy by the support of graph techniques. Although [10] has presented a minimized set of attributes which contained six attributes, however, it is mentioned that it could only detects determined types of spammers, they are bagger, and poster spammers [10]. In our approach, we propose minimized set of attributes for detecting all types of spammers. In addition, one of these attributes requires text analysis procedure for finding the similarities among messages which is not required for our proposed approach. Moreover, it is mentioned in [10] that Random Forest algorithm [11] is the best results for detection for Twitter. Although there are other researches such as [12] that claims the success of other algorithms including SVM [13], and Baysien network [14], however, the conclusion of [10] matches with our results and we were able to prove this claim by demonstrating all the results for six of the most popular classification algorithms including Random Forest. Detecting fake profiles has been presented by online tools, one of these tools is “FakeFollowerCheck” [15], which based its check on eight attributes, they are mentioned in Table I; however, there are not any details that describe how these attributes are used or what is the technique used for classification. Moreover, other researchers have defined another set of criteria to detect the fake twitter account. Reference [16] has presented a study to detect fake followers to the account of Obama, Romney, and other politicians during the elections for the President of US. He used twentytwo criteria for the fake followers’ detection, his algorithm based on calculating scoring points for each follower account according to the criteria set and the account is categorized as human, or fake according to the earned points in each category. We have contacted the authors in [16] and [17], as and they provided us with their dataset. Then, we have used this dataset to prove the novelty of our work as will be discussed later in details. III. PROPOSED METHODOLOGY In this paper, we aim to effectively detect the fake accounts on Twitter social network with the possible minimum set of attributes. The proposed method consists of two main steps, the first step is determine the main factors that influence a correct detection of fake accounts, and the second step is to apply a classification algorithm that uses the determined factors in step one on twitter accounts for discovering the fake accounts. This research paper aims to propose the minimum set of attributes that is able to detect the fake users with highest accuracy. Although the previous researches [8]-[10]
International Scholarly and Scientific Research & Innovation 10(1) 2016
presented a large number of attributes; however, by performing an extensive analysis of these attributes, it is revealed that most of these attributes are not used by most of the users and have been left in default mode which may provide false results in the detection task. In our system, we have reached a twenty two attributes to start with, these attributes have been agreed by the researchers in the field. We have applied many experiments to find the best minimum set of features that is able to detect the fake accounts on twitter. Our target of finding the minimum best set of features is based on the requirement of the extensive task for extracting, preparing and analyzing these features, therefore finding the minimum set which produces the maximum accuracy is considered one of the effective directions for detecting fake accounts. We define the best set of features as the set that contains the minimum number of features which provide the maximum percentage of accuracy. The accuracy of the result is measured by defined measurements such as the precision and recall which will be discussed in the Section IV. The working plan that has been performed to detect the required features’ set are described in steps, steps from 1 to 19 present the working plan in details 1. A dataset has been prepared for our experiment. Section III discusses the source and the steps of preparing of the used dataset 2. We have performed a survey that defined different sets of features. We have collected all the features that is proposed by these researchers 3. Twenty two attributes have been collected as a result of our extensive research. Section III discusses how these attributes have been collected 4. We have performed experiments based on different perspectives, in the first set of experiments, five of the most successful classification algorithms have been applied on the dataset using these 22 attributes. Section III discusses these five algorithms in brief 5. A 5-fold cross validation experiments for the five classification algorithms using the 22 attributes, and the results have been compared 6. We have selected 19 of these attributes according to our point of view and applied the classification algorithms in the second set of experiment 7. A 5-fold cross validation experiments for the five classification algorithms using the 19 attributes, and the results have been compared 8. For the target to get the minimized set of attributes with best classification results, we have applied the GAIN Measure [18] to find a weight for all the 22 attributes. Section III discusses how the GAIN measure has been applied to the 22 attributes and the weights for the attributes. 9. Using the calculated weighting for the attributes, in the third set of experiments, the five classification algorithms have been applied again on the dataset using the 22 attributes.
14
scholar.waset.org/1999.4/10003176
International Science Index, Computer and Information Engineering Vol:10, No:1, 2016 waset.org/Publication/10003176
World Academy of Science, Engineering and Technology International Journal of Computer, Electrical, Automation, Control and Information Engineering Vol:10, No:1, 2016
10. A 5-fold cross validation experiments for the five classification algorithms, and the results have been compared 11. We have applied the GAIN Measure [18] to find a weight for all the 19 attributes that we have selected. Section III.B discusses how the GAIN measure has been applied to the 19 attributes and the weights for the attributes. 12. Using the calculated weighting for the attributes, in the fourth set of experiments, the five classification algorithms have been applied again on the dataset using the 19 attributes that we have selected. 13. A 5-fold cross validation experiments for the five classification algorithms, and the results have been compared 14. According to [19], in the fifth set of experiments, the set of attributes has been minimized to seven attributes based on using the attributes that had weight of equal or above 50%. The five classification algorithms have been applied again on the dataset. 15. A 5-fold cross validation experiments for the five classification algorithms, and the results have been compared
[8]
16. Using the calculated weighting for the 19 attributes, in the sixth set of experiments, the five classification algorithms have been applied again on the dataset using the attributes that had weight of equal or above 50% [19]. The set of attributes has been minimized to six attributes. 17. A 5-fold cross validation experiments for the five classification algorithms, and the results have been compared 18. According to the previously applied experiments, we have reached the minimum set of attributes with maximum classification results, with selecting the best classification algorithm for the twitter account. All the experiments data and results are discussed in Section III. 19. This final result and the final set of attributes that we have reached according to the performed experiments is discussed in Section III. This set of results is the minimum set of attributes that is able to discover the fake accounts from Twitter with maximum accuracy which reaches more than 99%.
TABLE I SET OF ATTRIBUTES PROPOSED BY DIFFERENT RESEARCHERS [9] [10] FF ratio (R): following / followers ((where
Number Of Followers Number Of Followees Fraction Of Followers Per Followees Number Of Tweets Age Of The User Account Number Of Times The User Was Mentioned Number Of Times The User Was Replied To Number Of Times The User Replied Someone Number Of Followees Of The User’s Followers Number Tweets Received From Followees Existence Of Spam Words On The User’s Screen Name The Minimum Of TheTime Between Tweets The Maximum Of TheTime Between Tweets The Average Of TheTime Between Tweets The Median Of TheTime Between Tweets Number Of Tweets Posted Per Day Number Of Tweets Posted Per Week
Followers_Cou
nt
Id,Friends_Cou
nt Verified Created_At Description Location Updated Profile_Image_ Url Screen_Name
following, in the Twitter jargon, is the number of friend requests sent, and followers is the number of users who accepted the request) Large for spammers URL ration = U = messages containing urls / total messages. Message Similarity: Similarity among the messages sent by a user. Friend Choice (F) = F = Tn /Dn > 1 for spammers, where Tn is the total number of names among the profiles’ friend, and Dn is the number of distinct first names. Messages Sent (M): We use the number of messages sent by a profile as a feature Spammers M < 20 message Friend Number: number of friends a profile has = thousands for humans and few for spammers
A. Dataset We applied our experiment on a dataset of Twitter accounts that is collected by “the Fake project” [17]. We have contacted the authors of [20], [2] who have started the “the Fake project” in December 12, 2012. In their technical report [21], the authors have mentioned that the dataset is collected from different sources, the first source if the #elezioni2013 dataset which consisted of 1481 verified accounts that belongs to humans, more 469 verified human accounts have been collected by the “Fake Project” team. The fake accounts are collected from three sources, [3] has mentioned that they bought 1000 fakes accounts from http://fastfollowerz.com, 1000 from http://intertwitter.com, and 1000 fake accounts
International Scholarly and Scientific Research & Innovation 10(1) 2016
[15] The Ratio Friends Followers Of The
Account Under Investigation Is 50:1, Or More; More Than 30% Of All The Tweets Of The Account Use Spam Phrases, Such As “Diet”, “Make Money” And “Work From Home”; The Same Tweets Are Repeated More Than Three Times, Even When Posted To Different Accounts; More Than 90% Of The Account Tweets Are Retweets; More Than 90% Of The Account Tweets Are Links; The Account Has Never Tweeted; The Account Is More Than Two Months Old And Still Has A Default Profile Image; The User Did Not Fill In Neither Bio Nor Location And, At The Same Time, She Is Following More Than 100 Accounts.
from http://twittertechnology.com, at a price of $19, $14 and $13 respectively. In summary, the dataset that is used in this paper consists of 1481 human accounts and 3000 fake accounts. This dataset is used to compare our work with the proposed work in [17], [20], and [21] as will be discussed in the Section III B, and C. B. GAIN Measure and the Weighted Features Selection Step As mentioned in Section II, many researches have proposed different sets of features that are used to detect fake accounts. In [21], a set of 22 features has been proposed. In [15], the set has been minimized to eight features, while in [22], the set has considered only seven features. We have collected all proposed features in these researches, and applied the GAIN measure [18] on the training dataset to produce weighting for
15
scholar.waset.org/1999.4/10003176
World Academy of Science, Engineering and Technology International Journal of Computer, Electrical, Automation, Control and Information Engineering Vol:10, No:1, 2016
all attributes based on the concept that the attributes’ weighting determines the effectiveness of the attribute in the classification task. Table II presents all the attributes and their GAIN measure.
International Science Index, Computer and Information Engineering Vol:10, No:1, 2016 waset.org/Publication/10003176
TABLE II PROPOSED ATTRIBUTES AND DETERMINED WEIGHT Attributes
Weight
the account has at least 30 followers the account has been geo-localized it has been included in another user’s favorites it has used a hashtag in at least one tweet it has logged into Twitter using an iPhone a mention by twitter user it has written at least 50 tweets it has been included in another user’s list (2*number followers) _ (number of friends) User have at least one Favorite list the profile contains a name the profile contains an image the profile contains a biography the profile contains a URL it writes tweets that have punctuation it has logged into Twitter using an iPhone it has logged into Twitter using an Android device the profile contains a physical address it has logged into twitter.com website it is connected with Foursquare; it is connected with Instagram it has logged into Twitter through different clients
0.53 0.85 0.85 0.96 0.917 1 0.01 0.45 0.5 0.17 0.0 0.0 0.0 0.0 0.0 0.0 0.0 0.0 0.0 NA NA NA
attributes which provide the maximum accuracy and minimum number of attributes. All presented experiments are measured using the standard metrics and all measures are presented for each experiment. We have applied a 5-fold cross validation on all experiments and calculated the required metrics in each fold; the average has been calculated and compared with the results of other experiments to determine the accuracy of all algorithms and to reach the best set of attributes. A. First Experiment: Applying the Classification Algorithms on the Dataset Using All Determined Attributes Table III presents the accuracy metrics results for 5-fold cross validation by applying five of the classification algorithms on the dataset with using all the attributes in the classification task. TABLE III ACCURACY METRICS RESULTS FOR 5-FOLD CROSS VALIDATION FOR ALL ATTRIBUTES Machine Precision Recall F-Measure Learning TN % TP % FN % FP % % % % Algorithm Random 94.69 94.20 17.45 3.76 96.16 71.04 81.71 forest Decision 82.57 88.90 33.64 5.71 93.96 67.04 78.25 Tree Naïve Bayes 79.24 81.01 57.95 7.19 91.85 61.09 73.38 Neural 78.17 89.33 32.57 7.54 92.21 67.36 77.85 Network SVM 55.64 96.58 10.45 14.92 86.62 72.83 79.13 TABLE IV CLASSIFYING ATTRIBUTES WITH THEIR CORRESPONDING WEIGHTS Attributes Weight the account has at least 30 followers 0.53 the account has been geo-localized 0.85 it has been included in another user’s favorites 0.85 it has used a hashtag in at least one tweet 0.96 it has logged into Twitter using an iPhone 0.917 a mention by twitter user 1 it has written at least 50 tweets 0.01 it has been included in another user’s list 0.45 (2*number followers) _ (number of friends) 0.5 User have at least one Favorite list 0.17
C. Classification Algorithm Selection Step In this step, we have applied five of the best classification algorithms using the weighted attributes that are determined in the first step. These algorithms are: Random Forest [11], [23], Decision Tree [24], Naïve Bayes [14], Neural Network [25], and Support Vector Machine [13]. The outcome for each algorithm have been summarized by introducing four standard indicators, they are; True Negative (TN), True Positive (TP), False Negative (FN), False Positive (FP). Then three standard evaluation metrics have been measured, they are Precision, Recall, and F-Score [26]. IV. EXPERIMENTAL RESULTS In this section, we discuss all the applied experiments on the Fake project dataset. The experiments have been conducted in three steps. Subsection A discusses the first step in which the five algorithms are applied on all the collected attributes, the results of these experiments and discussion is also presented. Subsection B presents the second step by applying the five algorithms on the collected attributes after providing a weighting for each attribute using the GAIN measure [18], and the results of these experiments and discussion is provided. Subsection C presents the third step which is applying the five algorithms on a subset of the attributes which weight is above or equal 50%., with a discussion of the results. A final discussion for the results is performed with providing the final proposed the set of
International Scholarly and Scientific Research & Innovation 10(1) 2016
B. Second Experiment: Applying Classification Algorithms on the Dataset Using All Weighted Determined Attributes In this experiment, we have applied the GAIN measure on all attributes using the Fake project dataset. Each attribute had a weight according to its importance in the dataset. Applying GAIN measures has revealed to the result that only 10 attributes have positive weighting while the remaining attributes have zero weight. Therefore, the experiment used the attributes that have weight above zero%. The ten attributes with their corresponding weight is demonstrated in Table IV. Table V presents the results of the 5-fold cross validation when applying the five of the classification techniques using the classifying attributes with respect to their weight.
16
scholar.waset.org/1999.4/10003176
World Academy of Science, Engineering and Technology International Journal of Computer, Electrical, Automation, Control and Information Engineering Vol:10, No:1, 2016
TABLE V 5 FOLD CROSS VALIDATION RESULTS FOR FIVE CLASSIFICATION TECHNIQUES USING WEIGHTED ATTRIBUTES Precision Recall F-Measure TN % TP % FN % FP % % % % Random 95.93 95.77 12.67 1.33 98.63 72.22 83.38 forest Decision 95.74 95.99 12.00 1.40 98.57 72.39 83.47 Tree Naïve Bayes 98.74 99.70 0.93 0.80 99.20 75.18 85.54 Neural 99.83 98.23 5.40 0.44 99.55 74.08 84.94 Network SVM 99.90 99.13 2.64 0.42 99.58 74.76 85.40
International Science Index, Computer and Information Engineering Vol:10, No:1, 2016 waset.org/Publication/10003176
TABLE VI CLASSIFYING ATTRIBUTES HAVING WEIGHT ABOVE OR EQUAL 50% WITH THEIR CORRESPONDING WEIGHTS Attributes
Weight
the account has at least 30 followers the account has been geo-localized it has been included in another user’s favorites it has used a hashtag in at least one tweet it has logged into Twitter using an iPhone a mention by twitter user (2*number followers) _ (number of friends)
0.53 0.85 0.85 0.96 0.917 1 0.5
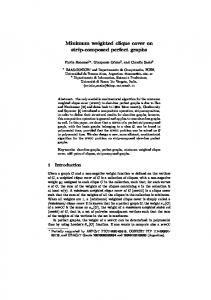
attributes has revealed to an increase in the accuracy measures in the classification task for detecting fake users. In addition to our satisfying conclusion, we have maintained the highest accuracy in detecting fake accounts by different classification algorithms. The results shows the increase of the accuracy results of five of the classification algorithms after using the suggested attributes with their corresponding weight. To clarify our findings, Fig. 1 proposes a comparison between the results when applying the five classification algorithms before minimizing the attribute set, after minimization, and after applying the weighting approach. The figure has five groups, each group is corresponding to one of the five classification algorithms, with three components, A for all applying all attributes for the classification task, B is for applying all the weighted attributes for the classification task, and C is for applying the minimized weighted set of for the classification task. Fig. 1 reveals that the proposed model has reached the best accuracy measures with the minimized analysis effort according to the minimized applied set of attributes which proves the applicability of the proposed approach.
TABLE VII 5 FOLD CROSS VALIDATION RESULTS FOR FIVE CLASSIFICATION TECHNIQUES USING WEIGHTED ATTRIBUTES ABOVE OR EQUAL 50% Precision Recall F-Measure TN % TP % FN % FP % % % % Random forest 98.48 93.95 18.21 0.50 99.47 70.85 82.76 Decision Tree 98.43 98.46 4.45 0.51 99.48 74.25 85.03 Naïve Bayes 98.74 99.34 2.00 0.80 99.20 74.92 85.36 Neural 99.83 98.09 5.83 0.44 99.55 73.97 84.87 Network SVM 99.90 98.45 4.74 0.42 99.57 74.24 85.06
C. Third Experiment: Applying Classification Algorithms on the Dataset Using Minimized Set of Weighted Determined Attributes (7 Attributes) We have used the same weighting measurements of the attributes that is produced by applying the GAIN measure on all attributes using the Fake project dataset. In this experiment, the attributes that only have a weight that is above or equal 50% is used in the classification task. This has revealed to the result that only 7 attributes are used which are presented with their corresponding weight is demonstrated in Table VI. Table VII presents the results of the 5-fold cross validation when applying the five of the classification techniques using the classifying attributes with weight which is above or equal 50%. V.FINDINGS ANALYSIS AND DISCUSSION The previous discussed experiments in subsections IV.a, IV.b, and IV.c have revealed that we were able to minimize the set of attributes that are applied for the classification task of fake accounts. As these data is not usually available in addition to the extensive task for preprocessing the attributes data, therefore, minimizing these set of attributes was our focus in this research. Also weighting the proposed set of
International Scholarly and Scientific Research & Innovation 10(1) 2016
120 100 80 60 40 20 0 A
B
C
Random forest
A
B
C
Decision Tree
Precision %
A
B
C
Naïve Bayes Recall %
A
B
C
A
Neural Network
B
C
SVM
F‐MEASURE %
Fig. 1 Comparison of all the experiments results
VI.CONCLUSION In this research, we proposed an approach for detecting fake accounts on Twitter social network, the proposed approach was based on determining the effective features for the detection process. The attributes have been collected from different research, they have been filtered by extensive analysis as a first stage, and then the features have been weighted. Different experiments have been conducted to reach the minimum set of attributes with perceiving the best accuracy results. From more than 22 attributes, the proposed approach has reached only seven effective attributes for fake accounts detection. Although we claim that these attributes can succeed in discovering the fake accounts in other social networks such as Facebook with minor changes according to the unique nature of each social network, however, we need to prepare a dataset to prove our claim. Moreover, providing an
17
scholar.waset.org/1999.4/10003176
World Academy of Science, Engineering and Technology International Journal of Computer, Electrical, Automation, Control and Information Engineering Vol:10, No:1, 2016
analysis to the tweets content of the user can provide more accurate results in the detection process. REFERENCES [1]
[2] [3] [4]
International Science Index, Computer and Information Engineering Vol:10, No:1, 2016 waset.org/Publication/10003176
[5]
[6] [7] [8] [9]
[10] [11] [12]
[13] [14] [15] [16] [17] [18]
[19]
[20] [21] [22] [23]
Qiang Cao, Michael Sirivianos, Xiaowei Yang, and Tiago Pregueiro, "Aiding the detection of fake accounts in large scale social online services," in Proceedings of the 9th USENIX conference on Networked Systems Design and Implementation, 2012. Carlos Castillo, Marcelo Mendoza, and Barbara Poblete, "Information credibility on twitter," in Proceedings of the 20th international conference on Worldwide web, 2011. Manish Gupta, Peixiang Zhao, and Jiawei Han, "Evaluating Event Credibility on Twitter," Siam, 2012. P. Heymann, G. Koutrika, and H. Garcia-Molina, "Fighting spam on social web sites: A survey of approaches and future challenges," IEEE Internet Computing, 11, 2007. Aditi Gupta, Hemank Lamba, and Ponnurangam Kumaraguru, "$1.00 per RT #BostonMarathon #PrayForBoston: Analyzing Fake Content on Twitter," Eigth IEEE APWG eCrime Research Summit (eCRS), 12, 2013. Yazan Boshmaf et al., "Íntegro: Leveraging Victim Prediction for Robust Fake Account Detection in OSNs," in NDSS ’15, 8-11 , San Diego, CA, USA, February 2015. Vladislav Kontsevoi, Naim Lujan, and Adrian Orozco, "Detecting Subversion of Twitter," May 14, 2014. Fabr´ıcio Benevenuto, Gabriel Magno, Tiago Rodrigues, and Virg´ılio Almeida, "Detecting spammers on twitter," Collaboration, electronic messaging, anti-abuse and spam conference (CEAS). Vol. 6, 2010. Supraja Gurajala, Joshua S. White, Brian Hudson, and Jeanna N. Matthews, "Fake Twitter accounts: Profile characteristics obtained using an activity-based pattern detection approach," in SMSociety '15, July 27 - 29, Toronto, ON, Canada, 2015 G. Stringhini, C. Kruegel, and G. Vigna, "Detecting spammers on social networks," in Proceedings of the 26th Annual Computer Security Applications Conference, 2010, pp. 1–9. L. Breiman, "Random forests," Machine Learning, 2001. Zhi Yang et al., "Uncovering Social Network Sybils in the Wild," in Proceedings of the 2011 ACM SIGCOMM conference on Internet measurement conference, November 02-04, 2011, Berlin, Germany, 2011. T. Joachims, Learning to Classify Text Using Support Vector Machines: Methods, Theory, and Algorithms. Boston: Kluwer Academic Publishers, 2002. Christopher D. Manning, Prabhakar Raghavan, and Hinrich Schütze, Introduction to Information Retrieval. New York: Cambridge University, 2008. SocialBakers. (Online) http://www.socialbakers.com/products/ analytics?ref=fakefollowers-top-bar, last retrieved on 30-10-2015 M. Camisani-Calzolari. (2012, August ) Analysis of Twitter followers of the US Presidential Election candidates: Barack Obama and Mitt Romney. (Online). http://digitalevaluations.com/ The Fake project. (Online). http://wafi.iit.cnr.it/theFakeProject/ (last retrieved on 30-10-2015). Asha Gowda Karegowda, A. S. Manjunath, and M.A. Jayaram, "Comparative Study of Attribute Selection Using Gain Ratio," International Journal of Information Technology and Knowledge Management, vol. 2, no. 2, pp. 271-277, July-December 2010. Tatsunori Mori, Miwa Kikuchi, and Kazufumi Yoshida, "ermWeighting Method based on Information Gain Ratio for Summarizing Documents retrieved by IR systems," Journal of Natural Language Processing, vol. 9, no. 4, pp. 3--32, 2002. S. Cresci, M. Petrocchi, and R. Di Pietro, "A criticism to Society (As seen by Twitter analystics)," in IEEE 34th international conference on distributes computing systems workshops, 2014. S. Cresci, R. Di Pietro, M. Petrocchi, A. Spognardi, and M. Tesconi, "A Fake Follower Story: improving fake accounts detection on Twitter," 2014. Bas Van Den Beld. (2012, September) Stateofsearch.com. (Online). http://goo.gl/YZbVf Manuel Fern_andez Delgado, Eva Cernadas, Sen_en Barro, and Dinani Amorim, "Do we Need Hundreds of Classifiers to Solve Real World Classification Problems?," Journal of Machine Learning Research, vol. 15, pp. 3133-3181, 2014.
International Scholarly and Scientific Research & Innovation 10(1) 2016
[24] Lior Rokach and Oded Maimon, Data Mining and Knowledge Discovery Handbook - Chapter 9 (Decision Trees), Oded Maimon and Lior Rokach, Eds., 2005. [25] David Kriesel, A Brief Introduction to Neural Networks.: dkriesel.com, 2005. (Online) http://www.dkriesel.com/en/science/neural_networks (last retrieved 30-10-2015). [26] Jesse Davis and Mark Goadrich, "The Relationship between PrecisionRecall and ROC Curves," in Proceedings of the 23rd International Conference on Machine Learning, Pittsburgh, 2006.
18
scholar.waset.org/1999.4/10003176