Falcon system is composed of an application-speci c on-line monitoring system, an interactive ..... As a result, the primary task of each steering server is to read.
Technical Report GIT-CC-94-21
Falcon: On-line Monitoring and Steering of Large-Scale Parallel Programs1 Weiming Gu, Greg Eisenhauer, Eileen Kraemer, Karsten Schwan John Stasko, and Je�rey Vetter College of Computing Georgia Institute of Technology Atlanta, GA 30332
Abstract { Falcon is a system for on-line monitoring and steering of large-scale parallel programs. The purpose of such interactive steering is to improve its performance or to a�ect its execution behavior. The Falcon system is composed of an application-speci c on-line monitoring system, an interactive steering mechanism, and a graphical display system. In this paper, we present a framework of the Falcon system, its implementation, and evaluation of the system performance. A complex sample application { a molecular dynamics simulation program (MD) { is used to motivate the research as well as to evaluate the performance of the Falcon system.
1 Introduction The high performance of current parallel supercomputers is permitting users to interact with their applications during program execution. Such interactive executions of large-scale parallel codes typically make use of multiple networked machines working in concert on behalf of a single user, as computational engines, display engines, input/output engines, etc. Our research explores the potential increases in performance and functionality gained by the on-line interaction of end users with their supercomputer applications. Speci cally, we are investigating the interactive steering of parallel programs, which is de ned as `the on-line con guration of a program by algorithms or by human users, with the purpose of a�ecting the program's performance or execution behavior'. Interactive program steering does not involve simply the on-line or postmortem exploration of program trace or output data, as being investigated by researchers in program debugging[28, 18] or in computer graphics[6]. Instead, program steering targets the parallel code itself, and it can range from rapid changes made by on-line algorithms to the implementation of single program abstractions (e.g., a mutex lock [35]) to the user-directed improvement of or experimentation with high-level attributes of parallel codes (e.g., load balancing in a large-scale scienti c code { see Section 2.2). In either case, program steering is based on the on-line capture of information about current program and con guration state [7, 31, 46, 40], and it assumes that human users and/or algorithms inspect, analyze, and manipulate such information when making and enacting steering decisions. 1 This research was supported in part by NASA grant No. NAGW-3886 and with funding from Kendall Square Research Corporation.
1
Falcon is a system for the on-line monitoring and steering of threads-based parallel programs. This paper focusses on Falcon's contributions to program monitoring: �
�
�
�
Application-speci c monitoring { in addition to providing default program information, Falcon permits
users to capture and analyze application-speci c program information, ranging from information about single program variables to program states de ned by complex expressions involving several program components distributed across di�erent processors of a single underlying parallel machine. These capabilities are especially useful for non-Computer Science end users, who wish to view, analyze, and steer their programs in terms of program attributes with which they are familiar (e.g., `time step size', `current energy', etc.). Scalable, dynamically controlled monitoring performance { by using concurrency and multiple mechanisms for capturing and analyzing monitoring information, the performance of the monitoring system itself can be scaled to di�erent application needs, ranging from high-bandwidth and low-latency eventbased monitoring to lower bandwidth sampling of accumulated values. Moreover, the resulting tradeo�s between monitoring latency, throughput, overhead, and accuracy may be varied dynamically, so that monitoring performance may be controlled and adjusted to suit the needs of individual applications and target machines. In addition, simple mechanisms are provided so that users can evaluate program perturbation due to monitoring. On-line analysis, steering, and graphical display { monitoring information captured with Falcon may be attached to arbitrary user-provided analysis code and subsequent (if desired) steering algorithms and/or graphical views. Analyses may employ statistical methods, boolean operators like those described in [40], or simply reorder the events being received, as described in Section 5.4. Graphical views may be displayed with multiple media or systems, currently including X windows, Motif, and the SGI Explorer environment. In addition, Falcon o�ers default on-line graphical animations of the performance of threads-based parallel programs. For such Motif-based displays, the Polka system for program animation provides users with easy-to-use tools for creating application-speci c 2D animations of arbitrary program attributes[49]. Extension to multiple heterogeneous computing platforms { an extension of Falcon addresses both single parallel computing platforms running threads programs as well as distributed computational engines using PVM as a software basis.
Falcon runs on several hardware platforms, including the Kendall Square Research KSR-1 and KSR-2 supercomputers, the GP1000 BBN Butter y multiprocessor, the Sequent multiprocessor, SGI workstations, and SUN SPARCstations. Falcon is now in routine use at Georgia Tech by non-Computer Science end users, and it is available for public release for the KSR-1, KSR-2, SGI, and SUN SPARCstation platforms. In the remainder of this paper, Section 2 presents the motivation for this research by examining the monitoring and steering needs of a sample parallel application, a molecular dynamics simulation (MD) used by physicists for exploring the statistical mechanics of complex liquids. Section 3 presents details of the implementation and performance of the Falcon system itself. The overall performance of the Falcon system as well as its performance with the MD code is evaluated in Section 4. Section 5 examines the nature and requirements of Falcon's graphical displays. Related research is described in Section 6. The nal section presents conclusions and future research.
2 Monitoring and Steering a Parallel Code Program monitoring and steering derive their value from their utilization in understanding and improving program behavior, and in permitting users to experiment with program characteristics that are not easily understood. Clearly, it will be hard to prove that promises of enhanced utility or performance of parallel applications can be ful lled more easily by steered programs than by non-steered ones. However, it is 2
inevitable that program steering will be performed in the future, in part because scientists now have available to them the computational and network power for interactive execution of interesting physical simulations and the means for interactive data visualization or even for virtual reality interfaces to their programs. To further motivate our work, this section brie y describes a particular parallel code, its potential for utilizing program steering, and the required support for on-line monitoring.
2.1 The MD Application MD is an interactive molecular dynamics simulation developed at Georgia Tech in cooperation with a group of physicists exploring the statistical mechanics of complex liquids [51, 8]. In this paper, the physical MD
system being simulated contains 4800 particles representing an alkane lm and 2700 particles in a crystalline base on which the lm is layered. For each particle in the MD system, the basic simulation process takes the following steps: (1) obtain location information from its neighboring particles, (2) calculate forces asserted by particles in the same molecule (intra-molecular forces ), (3) compute forces due to particles in other molecules (inter-molecular forces ), (4) apply the calculated forces to yield new particle position, and (5) publish the particle's new position. The dominant computational requirement is calculating the inter-molecular forces between particles, and other important computations include nding the bond forces within the hydrocarbon chains, determining system-wide characteristics such as atomic temperature, and performing on-line data analysis and visualization. The implementation of the MD application attains parallelism by domain decomposition. That is, the simulation system is divided into regions and the responsibility for computing forces on the particles in each region is assigned to a speci c processor. In the case of MD, we can assume that the decomposition changes only slowly over time and that computations in di�erent sub-domains are independent outside some cuto� radius. Inside this radius information must be exchanged between neighboring particles, so that di�erent processes must communicate and synchronize between simulation steps. The resulting overheads are moderate for fairly coarse decompositions (e.g., 100-1000 particles per process), but unacceptable for ner grain decompositions (e.g., 10 particles per process).
2.2 Steering MD { Experimentation and Results The on-line manipulation of parallel and distributed programs has been shown to result in performance improvement in many domains. Examples include the automatic con guration of small program fragments for maintaining real-time response in uniprocessor systems[32], the on-line adaptation of functional program components for realizing reliability versus performance tradeo�s in parallel and real-time applications [5, 14, 12], and the load balancing or program con guration for enhanced reliability in distributed systems[26, 43, 31]. The MD simulation o�ers opportunities for performance improvement through on-line interactions with end users and with algorithms, including: �
� � �
Decomposition geometries can be changed to respond to changes in physical systems. For example, a slab-based decomposition is useful for an initial system, but a pyramidal decomposition may be a better choice if a probe is lowered into the simulated physical system. The interactive modi cation of cuto� radius can improve solution speed by computing uninteresting time steps with some loss of delity, which typically requires the involvement of end users. The boundaries of spatial decompositions can be shifted for dynamic load balancing among multiple processes operating on di�erent sub-domains, performed by end users or by a con guration algorithm. Global temperature calculations, which are expensive operations requiring a globally consistent state, can be replaced by less accurate local temperature control. On-line analysis can determine how often global computations must be performed based on the temperature stability of the system. 3
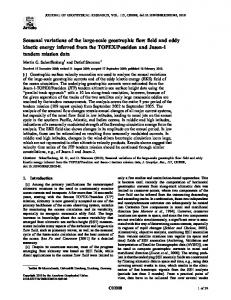
To demonstrate the utility of program steering, we next review some results of interactive MD steering applied to the problem of improving system load balance. In particular, we examine the behavior of the MD simulation when spatial domain of the physical system is decomposed vertically. In this situation, it is quite di�cult to arrive at a suitable load balance when decomposing based on static information (such as counting the number of particles assigned to each process, etc.). This is because the complexity of MD computation depends not only on the number of particles assigned to each process, but also on particle distances (due to cuto� radius). Furthermore, the portions of the alkane lm close to the substrate are denser than those on the top and therefore require more computation. In fact, fairly detailed modeling of the code's computation is required to determine a good vertical domain decomposition without experimentation, and there is no guarantee that an initial `good' decomposition will not degrade over time due to particle movement or other changes in the physical system. As a result, it appears easier to simply monitor load balance over time and then steer the application code to adjust load balance (by adjusting domain boundaries) throughout the application's execution. In this paper, such steering is performed interactively by end users. Necessary algorithmic support will be developed in the future; it will enable users to interact with the application only when automated steering is not successful. For interactive steering of MD, the Falcon system is used to monitor process loads on-line, the resulting trace information is analyzed, and workloads are displayed in bar graph form (see Figure 1). In addition, the MD code performs on-line visualization of particles and of current domain boundaries. The load balance view of Falcon and the MD system's data displays are depicted in Figures 1 and 2, respectively, for a sample simulation run with four domains on four processors. Associated with these displays is a textual user interface (also part of Falcon) that permits the user to change selected program attributes (in this case, shift individual domain boundaries) while the application is running. The e�ects of dynamic steering when used to correct load imbalances can be quite dramatic, as shown in Figure 3. In this gure, several steering actions signi cantly improve program performance by successive adjustment of domain boundaries. These results are important for several reasons. First, they demonstrate that it is possible to improve program performance by use of on-line steering, rather than degrade performance due to steering and monitoring costs. Second, it should be apparent that user interactions with the code can be replaced or assisted by on-line steering algorithms, in e�ect giving users the ability to migrate their experiences and experimental knowledge into their application codes, without requiring extensive program changes. Third, and more broadly, these results indicate the potential of on-line steering for helping end users experiment with and understand the behavior of complex scienti c codes.
2.3 The Requirements of Steering While the steering of MD code by adjustment of domain boundaries as presented in Section 2.2 is straightforward, important to our work are the future opportunities presented by on-line steering and monitoring. Toward this end, our group is now experimenting with interactive parallel programs in several domains, including (1) the interactive simulation of complex systems used in conjunction with some physical system, for on-line diagnosis of problems or for trying out certain fault containment strategies[13] (e.g., telecommunication systems), and (2) the on-line experimentation with scienti c or engineering applications. For example, we are developing an interactive global atmospheric modeling code, where scientists can easily experiment with alternative values for atmospheric quantities to adjust model runs in accordance with actual measured atmospheric data obtained from satellite observations (e.g., concentrations of certain pollutants or strengths and directions of wind elds). Similarly, we are using on-line steering to give users the ability to interact with their large-scale optimization codes, to direct program searches out of local minima, to detect and correct searches possibly leading to infeasible solutions, etc. To realize on-line program steering, several assumptions must be made, some of which may be removed or ameliorated by our future work. First, program steering requires that application builders must write their code such that steering is possible. Second, users must provide the program and performance information necessary for making steering decisions. Third, it is imperative that such information can be obtained with the latency required by the desired rate of steering. Concerning the rst requirement, in the MD code, 4
Figure 1: The load balance view of MD.
(a) Initial Decomposition
(b) Balanced Decomposition
Figure 2: Initial and balanced decompositions of the steered system. The horizontal frames mark the boundaries between processor domains. The dark particles are the xed substrate while the lighter particles are the alkane chains.
5
Speedup with 4 Processors 4
3.5
Speedup
fourth steering event third steering event
Speedup
3 second steering event 2.5
2
first steering event
1.5
1 0
5
10
15 20 25 Time (in iterations)
30
35
Figure 3: The e�ect of steering on performance over time with 4 processors. domains are represented such that their boundaries are easily shifted to make steering for improved workload balance possible. In general, however, programs can be made steerable only by requiring end users to write them accordingly, by requiring substantial compiler support[46], or by requiring that the programming language o�er stronger mechanisms of abstraction than those existing in parallel Fortran or in the Cthreads library used in our work (e.g., the object model [5, 11, 26, 14]). We are currently designing higher level language primitives for de nition of steering actions and for inclusion of such actions with application code. At this time, however, Falcon relies on user-directed inclusion of actuators with the application code. These actuators are then stored into a runtime library which serves as a catalogue of names as well as an interface to the Falcon's on-line monitoring mechanism (see Section 3.4 for a description and brief evaluation of the steering library). One of the primary concerns of this paper is the second requirement for on-line steering: the on-line provision, analysis, and display of information to users about current program behavior and performance, at rates suitable for program steering. Examples of such information used in graphical displays include the on-line data visualizations depicting molecular distributions in MD, the associated current values of domain boundaries (see Figure 2), and performance information about threads depicted in graphical views like the thread life-time view shown in Figure 13. Examples of such information used by on-line steering algorithms include lock contention values, which are used by on-line con guration algorithms to adjust individual mutex locks (see [35]) based on changes in a program's locking pattern. A third requirement of on-line steering is that steering is e�ective only if it can be performed at a rate higher than the rate of program change. In the case of load balancing by dynamic domain shifting in MD, human users can detect load imbalances and shift domain boundaries faster than the rate of occurrence of signi cant particle movements (which require several minutes for moderate size physical simulations on our KSR-2 machine). However, when steering is used to dynamically adjust lock waiting strategies, changes in locking patterns must be detected and reacted upon in every few milliseconds[35]. As a result, any on-line monitoring support for program steering must permit users to realize suitable tradeo�s in the bandwidth versus latency of monitoring. 6
In response to the requirements listed above, Falcon gives users the ability to control instrumentation by permitting them to explicitly include program-speci c sensors of di�erent types into their application codes. A sensor de nition language generates sensor implementations for target C and Fortran programs, and runtime-con gurable monitoring libraries capture, analyze, and store/forward or display sensor outputs as desired by users. In addition, Falcon o�ers e�cient system I/O (for data visualizations) and underlying communications across computer networks (for all remote mechanisms). The description and evaluation of on-line monitoring in Falcon is the primary focus of this paper. However, to demonstrate the usability of Falcon, we also brie y describe and evaluate Falcon's interfaces to program animation and graphical data rendering tools.
3 The Design and Implementation of Falcon 3.1 Design Goals Past work in program monitoring has focussed on helping programmers understand the correctness or performance of their parallel codes[33, 41], on minimizing or correcting for program perturbation due to monitoring[30], on reducing the amounts of monitoring or trace information captured for parallel or distributed program debugging[40], and on the e�ective replay[28] or long-term storage[47] of monitoring information. Falcon has three important attributes. First, Falcon supports the application-speci c monitoring/steering, analysis, and display of program information, so that users can capture, process, and understand and steer exactly the program attributes relevant to steering or to the speci c performance problems being diagnosed or investigated. That steering requires application-speci c program information is clearly demonstrated by the MD application steered in Section 2.2, where program variables capturing domain boundaries are adjusted based on monitoring output describing workload in terms of durations of molecular computations across di�erent domains. Section 4 will also demonstrate that such specialization of monitoring to capture only speci c program attributes can also signi cantly improve monitoring system performance and scalability compared to standard tools like GProf or compared to the default monitoring performed by Falcon. Second, the primary focus of Falcon is to reduce or at least control monitoring latency throughout the execution of a parallel program, while maintainingacceptable monitoring workload imposed on the underlying parallel machine. Dynamic control of monitoring overhead is important because the e�ectiveness of program steering can depend on the delay between the time at which a program event happens and the time at which the event is noted and acted upon. In addition, excessive monitoring overheads not only o�set performance gains achieved by steering, but also alter the order of occurances of program events. Finally, for scalability to large-scale parallel machines and programs, the Falcon system is con gurable in its o�ered total performance and associated resource usage. A third attribute of Falcon is its support for scalable monitoring , by varying the resources consumed by its runtime system in accordance with machine size and program needs. In Section 4, we show that Falcon can be used to monitor programs of any size running on our 64-node KSR multiprocessor, such that monitoring overheads and latencies can be adjusted in conjunction with program and machine size.
3.2 System Design Falcon is constructed as a toolkit that collectively supports the on-line program monitoring and steering of parallel and distributed programs. There are four major conceptual components, as shown in Figure 4: (1) monitoring speci cation and instrumentation, which consists of a low-level sensor speci cation language , higher level view speci cation constructs , and an instrumentation tool, (2) runtime libraries for information capture, collection, ltering, and analysis, (3) mechanisms for program steering, and (4) a graphical user interface and several graphical displays of program behavior and performance information. 7
User
Sensor/View Specification
Graphical User Interface
Probes & Instructions
Original Source Code
Instrumentation Tool
Graphical Displays
Program & Performance Information
Filter & Analyzer
Trace Database
Application Code Trace Data
Instrumented Running Application
Monitoring & User Interaction Controller Trace Data Collector Trace Data Analyzer
Trace Data Steering Commands
Program Steering Controller
Figure 4: Overall architecture of Falcon. The following steps are taken when using Falcon. First, the application code is instrumented with the sensors and probes generated from sensor and view speci cations. Toward this end, monitoring speci cations allow users to expose speci c program attributes to be monitored and based on which steering may be performed. User programs and/or Falcon's user interface or analysis/steering algorithms directly interact with the runtime system in order to gain access to information about runtime-created sensor and actuator instances. When the application is running, program and performance information of interest to the user and to steering algorithms is captured by the inserted sensors and probes, and is collected and partially analyzed by Falcon's runtime monitoring facilities. These facilities essentially consist of monitoring data output queues attaching the user program being monitored to a variable number of additional components performing steering and low-level processing of monitoring output (discussed in detail in Section 3.3 below). Partially processed monitoring information is then fed to steering mechanisms for e�ecting on-line changes to the program or to its execution environment; or it is fed to the central monitor and graphical displays for further analysis and for display to end users. Trace information can also be stored in a trace data base for postmortem analyses. The monitoring, steering, and user interaction `controllers', as part of the Falcon runtime system, activate and deactivate sensors, execute probes or collect information generated by sampling sensors, maintain a directory of program steering attributes, and also react to commands received from the monitor's user interface. For performance, these controllers are physically divided into several local monitoring controllers and a steering controller residing on the monitored program's machine so that they are able to rapidly interact with the program. In contrast, the central monitoring and steering controller is typically located on 8
a front end workstation or on a processor providing user interface functionality. Falcon uses the Polka system for the construction and use of graphical displays of program information[49]. Several performance or functional views (e.g., the aforementioned bargraphs and thread visualizations) have been built with this tool. However, in order to attain the speeds required for on-line data visualization and to take advantage of other performance display tools, Falcon also interfaces to custom displays and to systems for the creation of high-quality 3D visualizations of program output data, like the SGI Explorer tools.
3.3 System Implementation Falcon's implementation relies on a Mach-compatible Cthreads library[36] available on several hardware platforms, including the Kendall Square Research KSR-1 and KSR-2 supercomputer, the GP1000 BBN Butter y multiprocessor, the Sequent multiprocessor, and uni- and multi-processor SGI and SUN SPARC workstations. Figure 5 depicts the system's implementation. It is discussed next in the context of the To User Interface & Graphical Displays
Shared Memory
User Thread
TCP/IP sockets
Monitoring Controller
Central Monitor
User Thread Local Monitor Thread
User Thread
Local Monitor Thread
User Thread
Steering Controller
Trace Database Trace Filter & Analyzer High Performance I/O Channel
Shared Memory Multiprocessor
Figure 5: Implementation of the monitoring mechanism with Cthreads. basic contributions of Falcon to the monitoring literature: (1) low monitoring latency and varied monitoring performance, also resulting in system scalability, (2) the ability to control monitoring overheads, and (3) the ability to perform application-speci c monitoring and on-line analyses useful for steering algorithms and graphical displays. Application-speci c monitoring { sensors and sensor types. Using a simple speci cation language, programmers may de ne application-speci c sensors for capturing (a) the program and performance behaviors to be monitored and (b) the program attributes based on which steering may be performed. The speci cation of a tracing sensor is shown in Figure 6. It simply describes the structure of the application data to be contained in the trace record generated by this sensor. From this declaration is generated the sensor subroutine shown in Figure 7. The body of this subroutine generates entries for an event data structure, then writes that structure into a bu�er. A local monitoring thread later retrieves this structure from the bu�er. Each sensor's code body is also surrounded by an if statement, so that the sensor can be turned on or o� during program execution (ie., the monitoring system itself may be dynamically steered). 9
sensor work_load { attributes { int double } };
domain_num; work_load;
Figure 6: Speci cation of sensor work load. int user_sensor_work_load(int process_num, double work_load) { if (sensor_switch_flag(SENSOR_NUMBER_WORK_LOAD) == ON) { sensor_type_work_load data; data.type = SENSOR_NUMBER_WORK_LOAD; data.perturbation = 0; data.timestamp = cthread_timestamp(); data.thread = cthread_self(); data.process_num = process_num; data.work_load = work_load; while (write_buffer(get_buffer(cthread_self()), &data, sizeof(sensor_type_work_load)) == FAILED) { data.perturbation = cthread_timestamp() - data.timestamp; } } }
Figure 7: Generated code of sensor work load. Figure 6 shows the speci cation of the tracing sensor that monitors the workload of each domain partition in MD, and Figure 7 depicts the generated sensor code. There are four implicit elds for any event record that describe the event's sensor type, timestamp, thread id, and perturbation. The purpose of the perturbation eld is to record the additional time spent by the sensor waiting on a full monitoring bu�er, if any. This `bu�er full' information is important for generating comprehensible execution time displays. A more detailed explanation of this problem appears with the discussion of Figure 13 in Section 5.3. It is important to realize that each single sensor speci cation generates an event type; but its corresponding sensor code may be inerted to many di�erent places within a single parallel program. Moreover, since new threads can be forked during an application's execution time, sensor instances are dynamic. The monitoring system identi es such dynamically created sensors using a combination of thread identi er and sensor type. In addition, users may explicitly register individual instrumentation objects, which correspond to speci c calls to sensor code made by the target program. Such registration gives the monitoring system the ability to control (e.g., turn on or o�) single invocations of sensor code instead of controlling all instances of a certain type of sensor as a whole. Controlling monitoring overheads { sensor types and sensor control. The monitoring overheads experienced with sensor invocations may be controlled by use of di�erent sensor types: sampling sensors, tracing sensors, or extended sensors. A sampling sensor simply writes its output into a structure located in shared memory periodically accessed by the monitor's runtime components also resident on the parallel machine, called local monitoring threads. A tracing sensor generates timestamped event records that may be used immediately for program steering or stored for postmortem analysis. In either case, trace records are stored in trace queues from which they are removed by local monitoring threads. Last, an extended sensor performs simple analyses before producing output data, so that some data ltering or processing required 10
for steering may be performed prior to output data generation. It is evident that sampling sensors in ict less overhead on the target application's execution than tracing and extended sensors. However, as shown in Section 4, the more detailed information collected by tracing sensors may be required for diagnosis of certain performance problems in parallel codes. Furthermore, the combined use of all three sensor types may enable users to balance low monitoring latency against accuracy requirements concerning the program information required for program steering. Monitoring overheads may be controlled during each program run by direct interaction of user programs and/or Falcon's user interface and/or analysis/steering algorithms with the monitor's runtime system. First, sensors can be turned on or o� during the application's execution[47]. Second, sensors can dynamically adjust their own behavior to continously control overall monitoring overhead and latency. For example, a tracing sensor that monitors a constantly accessed mutex lock can reduce its tracing rate to every ve mutex lock accesses, thereby improving monitoring perturbation at the cost of reducing trace accuracy. In this paper, we use such dynamic sensor con guration for selective monitoring of a parallel program, where during a single program run, di�erent monitoring methods are employed at di�erent points in time. This is attained by enabling or disabling speci c sensors, by switching from sampling to tracing sensors, and by changing the behavior of individual sensors (e.g., sensor sampling rates). Experimentation described in Section 4 will demonstrate the utility of selective monitoring with the MD code. Controlling monitoring overheads { concurrent monitoring and steering. As depicted in Figure 5, local monitoring and steering threads perform trace data collection, processing, and steering concurrently and asynchronoulsy with the target application's execution. Local monitors and steering controllers typically execute on the target program's machine; but they may run concurrently on di�erent processors, using a bu�er-based mechanism for communication between application and monitoring threads. An alternative approach performs all monitoring activities, including trace data capture, collection, and analyses, in the user's code. One problem with this approach is that the target application's execution is interrupted whenever a monitoring event is generated and processed, and the lengths of such interruptions are arbitrary and unpredictable if complicated on-line trace analyses are used. In contrast, the only direct program perturbation caused by Falcon is the execution of embedded sensors and the insertion of trace records into monitoring bu�ers. Such perturbation is generally predictable (results on the KSR-2 are presented in Section 4), and its e�ects on the correctness of timing information can be eliminated using straightforward techniques for perturbation analysis [30]. Falcon's runtime system itself may be con gured (steered) in several ways, including disabling or enabling sets of sensors, varying activation rates, etc. One such on-line variation explored in detail in this paper is changing the number of local monitoring threads and communication bu�ers to con gure the system for parallel programs and machines of di�erent sizes. Such changes permit selection of suitable monitoring performance for speci c monitoring and steering tasks, and they may be used to adapt the monitoring system to dynamic changes in workload imposed by the target application. For example, when heavy monitoring is detected by a simple monitor-monitor mechanism, new local monitors may be forked. Similarly, when bursty monitoring tra�c is expected with moderate requirements on monitoring latency, then bu�er sizes may be increased to accommodate the expected heavy monitoring load. Such parallelization and con guration of monitoring activities is achieved by partitioning user threads into groups, each of which is assigned to one local monitor. When a new application thread is forked, it is added to the local monitor with the least amount of work. On-line analysis and display. Monitoring information partially processed by local monitors can be fed to Falcon's steering mechanism to e�ect on-line changes to the program and its execution environment. It can be sent to Falcon's central monitor for further analysis and for display of program behavior and application performance to end users. It can be stored in a trace data base for postmortem analysis. The central monitor, user interface, graphical displays, and trace database may reside on a di�erent machine to reduce interference from monitoring activities to the target application's execution, and to capitalize on e�cient graphics hardware and libraries existing on modern workstations. Section 5 describes some on-line analysis typically required for the on-line display of monitoring information: the need to reorder information produced by Falcon prior to its presentation to users. Falcon's interfaces to systems for the creation of high-quality 11
3D visualizations of program output data are out of scope of this paper. For the MD application, custom visualizations were constructed in order to gain the speeds required for on-line data viewing and steering.
3.4 On-line Steering Mechanisms As described in Sections 1 and 2, program steering requires functionality in addition to that being o�ered by Falcon's monitoring components. Falcon's on-line steering component is a natural extension of its monitoring facilities. Similar to local and central monitors, steering is performed by a steering server on the target machine and a steering client providing user interface and control facilities. The steering server is typically created as a separate execution thread to which local monitors forward only those monitoring events that are of interest to steering activities. Such events tend to be a small proportion of the total number of monitoring events, in part because simple event analysis and ltering is done by local monitors rather than by the steering server. Steering decisions, then, are made based on speci c attributes of those events, by human users (interactively) or by steering algorithms. Falcon's steering system permits users to implement on-line control systems that operate on and in conjunction with the programs being steered. As a result, the primary task of each steering server is to read incoming monitoring events and then `decide' what actions to take, based on previously encoded decision routines and actions, both of which are stored on a steering event database which is part of the server. This database contains entries for each type of steering event, where each event may either perform some actual steering action on the parallel program or simply note the occurrence of some monitoring event for future use in steering or for inspection by users from the client's user interface. Accordingly, the secondary task of each steering server is to interact with the remote steering client. The steering client is used to enable/disable particular steering actions, display and update the contents of the steering event database, and input direct steering commands from end users to the server. The steering client is not addressed by the target (on the parallel machine) performance measurements shown below. Its functionality and performance are discussed in more detail elsewhere. At the lowest level of abstraction, a steering action that modi es an application is either a probe or an actuator. A probe updates a speci c program attribute asynchronously to the program's execution. These attributes are de ned by application programmers in an object-oriented fashion, where each speci c program abstraction can de ne one or multiple attributes and then export methods for operating on these attributes. The steering event database lists all steerable objects and their program attributes. Also, actions are stored in the database with each event type. Actions are de ned methods able to operate on the attributes of these objects. A complete object-oriented framework for de ning and operating on program attributes is de ned in [38]. The de nition and dynamic adjustment of operating system level attributes is described in [35]. For purposes of this paper, the reader should assume that such attributes correspond to speci c program variables (ie., to speci c locations in the program's data). The steering server uses probes to update such variables at any time it chooses, and it uses actuators to have the program's execution threads enact certain steering actions on its behalf. Such actuators may also execute additional functions to ensure that modi cations of program state do not violate program correctness criteria[5]. The performance of steering is assessed in Section 4.5 below.
4 System Evaluation To understand the performance of the Falcon monitoring system, we evaluate its implementation on a Kendall Square Research KSR-2 parallel machine2. This machine has 64 processors interconnected by two rings. The KSR-2 supercomputer is a NUMA (non-uniform memory access) shared memory, cache-only 2 The 64 node KSR-2 machine at Georgia Institute of Technology was upgraded from a 64 node KSR-1 during our experimentations. Therefore, some of the results presented in this paper are obtained on the KSR-1 machine, while others are obtained on the KSR-2. Programs running on the KSR-2 are roughly twice as fast as those running on a KSR-1 due to di�erences in machine clock speeds.
12
architecture with an interconnection network that consists of hierarchically interconnected rings, each of which can support up to 32 nodes. Each node consists of a 64-bit processor, 32 MBytes of main memory used as a local cache, a higher performance 0.5 Mbyte sub-cache, and a ring interface. CPU clock speed is 20 MHz on the KSR-1 and 40 MHz on the KSR-2, with a peak performance of 20 and 40 M ops per node for KSR-1 and KSR-2, respectively. Access to non-local memory results in the corresponding cache line being migrated to the local cache, so that future accesses to that memory element are relatively cheaper. The parallel programming model implemented by KSR's OSF Unix operating system is one of kernel-level threads which o�er constructs for thread fork, thread synchronization and shared memory between threads. This kernel-level thread facility is called Pthreads. Falcon itself employs Cthreads, a user-level threads facility that is built on top of Pthreads. In the remainder of this section, we rst evaluate the basic performance of Falcon's monitoring mechanisms, including measurements of the average costs of tracing sensors and of minimal and expected monitoring latencies. Next, using the MD code, we evaluate Falcon's ability to control monitoring overheads and to scale to di�erent performance requirements. The overheads incurred by individual elements of the runtime steering library are evaluated last.
4.1 Sensor Performance The perturbation, latency, and throughput of sensors depend on three factors: (1) the size of the event data structure, (2) the cost of event transmission and bu�ering from sensors to local monitors, and (3) sensor type. A tracing sensor generating a `large' event containing many user-de ned and implicit attributes will execute longer than one generating a `small' event. Event transmission and bu�ering costs are a�ected by a variety of factors, including the number of event queues and local monitor threads, and the actual event processing demands placed on local monitors. Factor (1) is evaluated in Table 1, which depicts the basic costs of executing a sensor modulo its size, where basic costs include: (a) accessing the sensor switch ag, (b) computing the values of sensor attributes, and (c) writing the generated sensor record into an event queue. The table displays measured execution times on a KSR-2 machine. Event record length 32 bytes 64 bytes 128 bytes Cost (microseconds) 6.8 7.9 9.6 Table 1: Average cost of generating a sensor record on the KSR-2. The results in Table 1 indicate that the direct program perturbation caused by inserted sensors should be acceptable for many applications for moderate amounts and rates of monitoring. Speci cally, if an application can tolerate from 5% to 10% perturbation, then Falcon's monitoring mechanism can produce monitoring events at a rate from 7,500 to 15,000 events per second on the application's critical execution path. Given these costs, total perturbation of a parallel program can be derived as the cumulative cost of generating all of the sensor records in the program's critical path. A more complex perturbation model is required when considering side e�ects of such direct program perturbation[30]. The dominant factor in sensor execution is the cost of accessing the bu�er shared between application and monitoring threads. The use of multiple monitoring bu�ers (one per user thread) in Falcon reduces the contention of bu�er access by user and monitoring threads, so that the e�ective cost of bu�er access is the cost of copying a sensor record to the bu�er. This latter cost depends on the size of the sensor record, as clearly evident from the measurements in Table 1. It should be noted that these costs do not include perturbation that might be caused by bottlenecks in the processing and transmission of the events (which would result in delays in obtaining bu�er space). However, such worst case perturbation may be avoided by making dynamic monitoring adjustments provided by Falcon's runtime monitoring mechanisms, such as turning o� non-critical sensors, reducing a sensor's tracing rate, forking new local monitoring threads, etc. 13
4.2 Monitoring Latency and Perturbation Monitoring latency is de ned as the elapsed time between the time of sensor record generation and the time
of sensor record receipt and (minimal) processing by a local monitoring thread. Low latency implies that steering algorithms can rapidly react to changes in a user program's current state[37]. Monitoring latency includes the cost of writing a sensor record to a monitoring bu�er, the waiting time in the bu�er, and the cost of reading the sensor record from the monitoring bu�er. While the reading and writing times can be predicted based only on sensor size, the event waiting time in the monitoring bu�er depends on the rate at which monitoring events can be processed by local monitors. Bu�er size Record length (bytes) 32 bytes 64 bytes 128 bytes 256 69 73 87 1,024 68 71 84 4,096 68 70 83 16,384 69 73 85 Table 2: Minimum monitoring latency (in microseconds) on the KSR-2. Bu�er size Record length (bytes) 32 bytes 64 bytes 128 bytes 256 164 181 242 1,024 201 264 294 4,096 211 277 498 16,384 256 347 556 Table 3: Latency at moderate monitoring rates (in microseconds) on the KSR-2.
Tables 2 and 3 depict the results of two experiments with a synthetic workload generator instrumented to generate sensor records of size 32 bytes at varying rates, using a single local monitoring thread. In Table 2, monitoring latency is evaluated under low loads, resulting in an approximate lower bound on latency. Results vary with event record sizes, but demonstrate the independence of monitoring latency on the size of the monitoring bu�er at low loads. Table 3 uses higher monitoring loads3 and experimentally demonstrates the expected result that larger monitoring bu�ers reduce program perturbation, but also increase monitoring latency for bu�ered events. Speci cally, latency is not a�ected by bu�er size at low rates, but increases with increasing bu�er sizes even at moderate monitoring rates. This would indicate the use of smaller bu�ers. However, program perturbation can be larger with small bu�ers since programs must wait until bu�er space is available when attempting to produce an event. Figure 8 demonstrates that the maximum event processing rate of a single local monitoring thread is about 40,000 to 45,000 events per second on the KSR-2 (assuming no signi cant processing of events in the local monitoring thread). However, monitoring latency remains acceptable when the monitoring rate is less than this saturation point. The bottleneck due to limitations on the processing ability of single local monitors can be remedied by use of parallelism. Figure 9 shows that monitoring delay is reduced when multiple local monitors are used 3
The measurements in Table 3 use a monitoring rate of approximately 40,000 events per second, which almost saturates the
14
800
Monitor Latency (micro-seconds)
700
Latency vs Event Rate
600 500 400 300 200 100 0 0
10000
20000 30000 Event Rate (events/second)
40000
50000
Figure 8: Monitoring latency versus event rate on the KSR-2. to monitor the MD application. In this experiment, all procedure calls to the Cthreads library are traced. As MD runs on more processors, the frequency of calls to the Cthreads library increases, resulting in higher event rates. It is evident from the results shown in Figure 9 that additional local monitors are e�ective in reducing monitoring delay when this delay exceeds some threshold (around 200 microseconds for the MD code on the KSR-2). Below this threshold, the additional overheads associated with multiple vs. single local monitoring threads prevents their e�ectiveness. In general, the measurements shown in Tables 2 and 3 and in Figures 8 and 9 demonstrate that there exists no general means of attaining both low monitoring latency and perturbation at arbitrary rates of monitoring (other than using additional hardware support). The approach taken by Falcon toward addressing this problem is simply to permit the con guration of the monitoring system itself (bu�er sizes, number of trace bu�ers, number of local monitoring threads, and attachment of monitoring threads to bu�ers { monitoring load distribution) to o�er the performance characteristics desired by the application program. Such con guration can be performed dynamically in a fashion similar to on-line program steering, where the saturation points for local monitors may be used as triggers for con guring the monitoring system itself.
4.3 Monitoring the MD Code This section demonstrates the overall performance and utility of Falcon's monitoring mechanisms, again using the MD application. Measurements in this section are taken on a 64-node Kendall Square Research KSR-1 machine. The speci c MD simulation used in these measurements uses a cylindrical domain decomposition; MD performance and speedups with di�erent decompositions are evaluated in detail elsewhere[9]. Table 4 depicts the results of four di�erent sets of MD runs, normed against a run of MD without monitoring. These experiments compare the performance and perturbation when using Falcon for ve di�erent cases: (1) when no monitoring performed (Original MD), (2) when tracing only MD calls to the underlying Cthreads package (Dft Mon Only), (3) when tracing Cthreads events as well as sampling (using sampling sensors) the 10 most frequently called procedures in MD (Dft Mon & Sampling), (4) when using the Unix GProf pro ler existing on the KSR-1 machine (MD with Gprof), and (5) when tracing Cthreads events as well as the 10 most frequently called procedures in MD (Tracing All Mon Events). The table and gures list computation times and speedups with di�erent numbers of processors. These measurements do not consider single local monitoring thread used in the experiment.
15
1000
Average Delay (microseconds)
900
with 1 local monitor with 2 local monitors with 3 local monitors with 4 local monitors
800 700 600 500 400 300 200 100 0 0
4
8
12 16 Number of domains
20
24
Figure 9: Monitoring latency with multiple local monitors on the KSR-2. (Each domain of particles is assigned to one processor.) Number of Processors 1 4 9 16 25 36
Execution Time of Each Iteration (seconds) & Monitoring Overhead Original MD Dft Mon Dft Mon Tracing All MD with Only & Sampling Mon Events Gprof 8.19 8:19(< 1%) 9.61(17%) 114.60(1299%) 22.53(175%) 2.65 2:65(< 1%) 3.21(21%) 59.30(2140%) 7.29(175%) 1.45 1:45(< 0%) 1.72(19%) 65.33(4406%) 4.28(195%) 0.62 0.63(1%) 0.73(17%) 54.29(8628%) 1.71(175%) 0.30 0.31(2%) 0.35(16%) 41.56(13776%) 0.82(173%) 0.19 0.20(4%) 0.23(16%) 33.65(17245%) 0.54(195%)
Table 4: Average execution time and perturbation of each iteration of MD with di�erent amounts of monitoring or pro ling on KSR-1. the costs of either forwarding trace events to a some front end workstation or storing them in a trace data base, since those costs are not dependent on Falcon's design decisions but rather on the performance of the networking code and/or le system implementation of the KSR-1 machine. Speci cally, measurements with trace events essentially `throw away' events at the level of local monitors, whereas the measurements with sampling sensors actually use local monitors to retrieve and evaluate sampling sensor values stored in shared memory on the KSR-1 machine. The MD application's performance with di�erent amounts of monitoring or pro ling is depicted in Figure 10, and the resulting program perturbation due to monitoring is shown in terms of speedup degradation in Figure 11. Evaluations of each experiment are presented next. The rst experiment (Dft Mon Only { default monitoring) measures the overhead of monitoring when Falcon traces all calls to the underlying Cthreads package. Speci cally, this is the amount of monitoring required for the thread life-time view 4 Super-linear speedups are due to the KSR-1's ALLCACHE memory architecture. When MD runs on a large number of processors, it can load all of its code and data into the fast sub-caches or local caches associated with these processors, while
16
10.0 Original MD Dft Mon Only Dft Mon & Sampling MD with Gprof
Execution time / iteration
8.0
6.0
4.0
2.0
0.0 0
5
10
15 20 Number of processors
25
30
35
Figure 10: Comparing average execution time of each iteration of MD on the KSR-1.
45.0 Original MD Dft Mon Only Dft Mon & Sampling MD with Gprof Linear Speedup
40.0 35.0
Speedups
30.0 25.0 20.0 15.0 10.0 5.0 0.0 0
5
10
15 20 Number of processors
25
30
Figure 11: Comparing speedups of MD on the KSR-14.
17
35
shown in Figure 13 in Section 5.2. The monitoring information being collected includes the runtime activities associated with each thread (such as thread fork, thread join and thread detach events), synchronization calls, and all other information displayed in the thread life-time view. It is apparent from Figures 10 and 11 that default monitoring does not noticably perturb the execution of MD. However, monitoring overheads increase slightly with an increasing number of processors, which is caused by an increasing number of events (more user threads imply more cthreads calls, and hence more monitoring events) generated during a shorter execution time and beginning to saturate the available local monitoring threads. The creation of additional local monitors can remedy this problem. The second experiment compares the overhead of Falcon monitoring with that of commonly used program pro ling tools, namely, with Gprof. The KSR implementation of Gprof used in these measurements has been optimized to take advantage of the machine's memory architecture in several ways, including replicating counters on each processor to avoid remote accesses. To compare fairly, we exclude the time spent on writing the results to le from the presented Gprof execution times. Using Falcon, we monitor the 10 most frequently called procedures in MD. These calls constitute about 90% of all procedure calls made in the program. Each procedure is monitored by a sampling sensor, which increments a counter for each procedure call being monitored. Counter values are sampled each millisecond by local monitoring threads. The result of this experiment is the addition of 20% to MD's total execution time. In comparison, with Gprof, the execution time of MD is increased by approximately 180%. Similar advantages of Falcon to other pro ling tools are demonstrated when using Prof. Experimental results not reported in detail here show that Prof's overhead is approximately 130% [15]. The results described above are not surprising, since pro ling tools typically maintain large amounts of compiler-derived information about a parallel program's attributes. In comparison, Falcon only maintains the speci c information required for taking certain program measurements. While the rst two experiments clearly demonstrate the importance of monitoring only the program attributes of interest to the user, the third experiment shows that it is also important to adjust or select the techniques being used for information capture. In this experiment, tracing sensors are used in place of sampling sensors for monitoring the 10 most frequently called procedures in MD, which results in a very signi cant increment of monitoring overheads. The excessive performance penalties arising from this `misuse' of tracing sensors are primarily due to the direct perturbation caused by monitoring tens of millions of procedures calls and are exacerbated by the saturation of the single local monitoring thread being used in the experiment. The resulting (lack of) performance clearly demonstrates two points. First, since tracing sensors are too expensive for procedure pro ling, any monitoring system must o�er a variety of mechanisms for information capture and analysis, including both sampling and tracing sensors. Second, since tracing can help users gain an in-depth understanding of code functionality and performance (see Sections 4.4 and 5), users should be able to both control the rates at which tracing is performed and the speci c attributes of the application that are captured via tracing. We call the user's ability to focus monitoring on speci c system attributes selective monitoring. It is explained in more detail in the next section. In general, the experiments with MD presented in this section demonstrate that the multiple monitoring mechanisms (e.g., tracing vs. sampling sensors) supported by Falcon can be employed such that monitoring overheads remain moderate for realistic parallel application programs.
4.4 An Example of Selective Monitoring Using Falcon In this experiment, the MD code's most computationally intensive component is monitored using Falcon's sampling and tracing sensors. Both types of sensors are needed since programmers require both summary (e.g., total number of invocations) and sequencing or dependency information (e.g., `b' was done after `a' occurred) to understand and evaluate code performance. Such dynamically selective monitoring is useful since programmers can focus on di�erent phenomena at di�erent times during the performance evaluation process. The speci c purpose of the selective monitoring demonstrated in this section is to understand the it cannot do so when running on a single processor.
18
e�ectiveness of certain, commonly used `short cuts' which are intended to eliminate or reduce unnecessary computations in codes like MD. The dominant computation of each domain thread in the MD code is the calculation of the pair forces between particles, subject to distance constraints expressed with a cut-o� radius. This calculation is implemented with a four-level, nested loop organized as follows (pseudocode is shown below): for (each molecule mol_1 in my domain) do for (each molecule mol_2 in domains within cut_off_radius) do if (within_cutoff_radius(mol_1, mol_2)) then continue; for (each particle part_1 in molecule mol_1) do if (within_cutoff_radius(part_1, mol_2)) then continue; for (each particle part_2 in molecule mol_2) do if (within_cutoff_radius(part_1, part_2)) then continue; calculate_pair_forces(part_1, part_2); end for end for end for end for
The inner three levels of this loop check the distances between molecules and particles to eliminate all particles outside the cut-o�-radius. When the distance between two molecules is checked, three dimensional bounding boxes are used for each molecule. Each molecule's bounding box includes all of its particles. The minimum distance between two molecules is de ned as the distance between their bounding boxes' closest points, whereas the minimum distance between a particle and a molecule is the distance from the particle to the molecule's bounding box' closest point. The question to be answered with selective monitoring is whether the additional costs arising from the use of bounding boxes is justi ed by the saved costs in terms of the resulting reduction in the total number of pair force calculations. More speci cally, does the reduction is total number of pair force calculations justify the additional computation time consumed by bounding box calculations? A simple selective monitoring mechanism is used to answer this question, by dynamically monitoring the performance of this four-level loop. Speci cally, a sampling sensor is rst used to monitor the hit ratios of the distance checks at all levels. When a hit ratio at some loop level falls below some threshold, say 10%, a tracing sensor monitoring this loop level is activated to obtain more detailed information. The intent is to correlate the low hit ratio with speci c properties of domains or even of particular molecules. Speci cally, for each `hit' distance check at the 2nd level loop, we trace the distances between particles and molecules at the 3rd level loop. The motivation is to understand the relationships of distances between molecules' bounding boxes and with distances between speci c particles of a molecule with the bounding boxes of other molecules. In other words, what is the e�ectiveness of the second level distance check? The performance of such dynamically selective monitoring is presented in Table 5. In these measurements, we use a MD data set that contains 300 molecules with 16 particles each. This relatively small system is then monitored by insertion of sampling and tracing sensors at one, two, three, or all levels of the nested loop (the outermost level is numbered zero, while the innermost three). Tracing at all levels results in overheads that are somewhat unacceptable, especially when the same tracing is performed for larger systems. This is apparent from the increases in monitoring overheads experienced when tracing at all levels for increasing system sizes (e.g., 9 vs. 16 domains). On the other hand, when tracing only at lower levels (e.g., levels 1 or 2), overheads are less than 1% for smaller systems and no more than 5% for larger systems, and sampling overheads remain small for all system sizes. These results indicate that selective monitoring is quite e�ective, even when applied to this highest frequency set of loops in the MD program's execution. Furthermore, the strategy of sampling execution and only initiating tracing when some problem (e.g., a low hit ratio) is experienced should result in composite monitoring overheads that approximate the sampling overheads experienced with Falcon for long system 19
Execution Time of each MD time step (seconds) & Monitoring Overhead No. of No Sampling Tracing at Tracing at Tracing at Tracing at domains Monitoring Hit-Ratio Level 1 Level 2 Level 3 All levels 4 1.28 1 28( 1%) 1 28( 1%) 1.34(5%) 1.38(8%) 1.46(14%) 9 0.703 0 706( 1%) 0 708( 1%) 0.734(4%) 0.742(5%) 0.794(13%) 16 0.301 0 301( 1%) 0.304(1%) 0.316(5%) 0.323(7%) 0.356(18%) 25 0.147 0 147( 1%) 0.149(1%) 0.155(5%) 0.158(7%) 0.188(28%) :