Far-field fluorescence microscopy beyond the diffraction limit. A. M. van Oijen, J. Köhler, and J. Schmidt. Centre for the Study of Excited States of Molecules, ...
van Oijen et al.
Vol. 16, No. 4 / April 1999 / J. Opt. Soc. Am. A
909
Far-field fluorescence microscopy beyond the diffraction limit A. M. van Oijen, J. Ko¨hler, and J. Schmidt Centre for the Study of Excited States of Molecules, Huygens Laboratory, University of Leiden, P.O. Box 9504, 2300 RA Leiden, The Netherlands
M. Mu¨ller and G. J. Brakenhoff Institute of Molecular Cell Biology, University of Amsterdam, Kruislaan 316, 1098 SM Amsterdam, The Netherlands Received August 12, 1998; revised manuscript received November 16, 1998; accepted November 20, 1998 A technique has been developed to obtain three-dimensional structural information on a length scale well below the Rayleigh length with conventional far-field optics. By spectrally selecting a single molecule with highresolution laser spectroscopy and using a CCD camera to register the spatial distribution of the emitted photons in three dimensions, one can determine the position of a molecule with unprecedented accuracy. One can resolve details in the specimen with sub-diffraction-limited resolution in three dimensions by applying this procedure to as many molecules as are present in the same diffraction-limited volume and obtaining their mutual positions. The feasibility of this technique is demonstrated for the system of pentacene in p-terphenyl at cryogenic temperatures for which molecules were localized with an accuracy of better than 40 nm in the lateral and 100 nm in the axial directions. © 1999 Optical Society of America [S0740-3232(99)00304-X] OCIS codes: 100.6640, 180.1790, 180.2520.
1. INTRODUCTION Since the development of the earliest optical microscopes in the seventeenth century, far-field microscopy has found applications in many disciplines of science. From the research of Abbe1 it became clear that the resolving power of microscopes based on focusing optics is, because of the wavelike nature of light, restricted to certain limits. The Rayleigh criterion2–5 states that two point sources can be separately observed only if their mutual distance in image space is equal to or larger than the radius of the first dark ring around the central disk of the Airy diffraction pattern. This distance represents the diffraction-limited resolution of the microscope. For the lateral dimension the Rayleigh length is given by d r 5 0.61l/N.A., where l denotes the wavelength and N.A. is the numerical aperture of the objective, defined by N.A. 5 n sin a, where n is the refractive index of the propagation medium and a is the half-aperture of the imaging optics–objective. According to a similar criterion, the axial resolution is given by d z 5 2nl/(N.A.) 2 . In modern confocal microscopy using oil-immersion objectives with a N.A. of 1.4 and at a wavelength of ;500 nm, diffraction-limited resolution of 150–180 nm laterally and 550–580 nm axially can be obtained. For the two-dimensional imaging of surfaces the limitation of the Rayleigh criterion can be surpassed by the use of near-field optical microscopy6,7 with resolutions as fine as 20–100 nm, determined by the size of the scanning near-field probe. In this paper we present a technique, spectrally selective imaging (SSI), through which superresolution imaging in three-dimensional structures can be realized, based on the combination of spectrally selective single-molecule detection and confocal fluorescence microscopy. 0740-3232/99/040909-07$15.00
In fluorescence microscopy, thousands of molecules within a diffraction-limited volume are excited simultaneously, and the final signal level corresponds to the total amount of detected fluorescence. According to the Rayleigh criterion it is impossible to identify single molecules and determine their precise mutual spatial location with better than the diffraction-limited resolution. With SSI, however, a single molecule residing in this focal volume is selectively excited by means of high-resolution laser spectroscopy. The luminescence photons that originate from the molecule are collected by the microscope and form a diffraction-limited image of a point source because the dimensions of the molecule are negligible compared with that of the wavelength used. By determining the center of the three-dimensional photon distribution in the image space one can determine the exact location of the single molecule with an accuracy limited only by the signal-tonoise ratio rather than by the diffraction limit. Knowing the total magnification of the microscope, one can calculate the relative position of the molecule in the specimen. By tuning the excitation laser into resonance with another molecule one can determine the mutual position of the molecules with sub-diffraction-limited accuracy despite the fact that both molecules reside within the same diffraction-limited volume. This procedure can be repeated for numerous molecules that are present in the selected volume. In this way structural information on a length scale below the Rayleigh length can be obtained. It is interesting to mention that the method discussed in this paper was suggested in the mid-1980’s, before the development of single-molecule spectroscopy, as a way to separate two point objects that are within the Rayleigh distance of each other and possess different spectral © 1999 Optical Society of America
910
J. Opt. Soc. Am. A / Vol. 16, No. 4 / April 1999
characteristics.8 A decade later, Betzig9 proposed a combination of this method and the technique of scanning near-field microscopy to achieve ‘‘true molecular imaging,’’ although it was restricted to two dimensions.
2. EXPERIMENT The principle described above is demonstrated on pentacene molecules in a crystalline p-terphenyl host. Very thin crystals were grown by cosublimating zone-refined p-terphenyl with pentacene in a home-built oven. Crystal flakes with a thickness of a few micrometers and at a concentration of approximately 1028 mol/mol were so obtained. All experiments were performed at 1.2 K. To achieve this temperature, the crystal flake is mounted inside a liquid-helium bath cryostat together with an aspheric singlet lens (Thorlabs; f 5 1.45 mm; N.A. 5 0.55) for excitation and for collection of the fluorescence originating from the pentacene molecules. The sample can be laterally displaced with respect to the objective lens over a range of 2 mm to probe different regions of the crystal and the axial position of the objective lens can be changed in a range of 1 mm to optimize the position of the focal volume in the sample.10 The experimental setup is shown schematically in Fig. 1. The light used to excite the S 1 ← S 0 transition of the pentacene molecules has a wavelength near 600 nm and is provided by a single-mode dye laser (Coherent 599-21, Rhodamine 6G) with a bandwidth of approximately 2 MHz. A small fraction of the light is used to monitor the functioning of the laser. To verify single-mode operation, a scanning Fabry–Perot interferometer (FP I; SpectraPhysics, free spectral range 2.0 GHz) is used. An iodine cell is used to calibrate laser scans to an absolute accuracy of 150 MHz. For short laser scans, for which iodine spectra cannot be identified, a home-built 75-cm Fabry– Perot interferometer (FP II; free spectral range 100 MHz) was used to calibrate the laser frequency in relative units,
van Oijen et al.
with an accuracy of ;1 MHz. The excitation light is amplitude stabilized by means of an electro-optic modulator (EOM; Conoptics) and coupled into a polarizationpreserving single-mode fiber to clean up the laser beam profile and to decouple the alignment of the optics on either end. Via this fiber, the single-mode excitation light enters the home-built confocal arrangement, where it is focused onto a 50-mm pinhole. The excitation light is reflected by a dichroic mirror (Omega 615 DRLP) onto a telecentrically placed scan mirror that can tilt the excitation beam. This provides a way to displace the focus generated by the objective lens laterally in a precise and wellcontrolled manner. The Stokes-shifted fluorescence light is collected by the objective and is transmitted via the intermediate optics by the dichroic mirror. To suppress residual laser light, a cutoff filter is used (Omega 620 EFLP). Approximately 25% of the fluorescence light is split off by a beam splitter and focused onto an avalanche photodiode (EG&G SPCM-200) with an aperture of 100 mm, which acts as the detection pinhole. This avalanche photodiode is used to record fluorescence-excitation spectra and to monitor single-molecule fluorescence. To achieve high time resolution, a multichannel scaling card (EG&G MCS plus) is used to collect the voltage pulses generated by the avalanche photodiode that correspond to single detected photons. The other 75% of the fluorescence light is detected by an image-intensified CCD camera (Princeton Instruments Pentamax GenIV) that can be axially translated to record the full three-dimensional distribution of the fluorescence photons. During the experiment the different components are controlled and monitored by using a PC with software operated from within a LabVIEW environment (National Instruments).
3. RESULTS AND DISCUSSION A. Spectral Selection of Single Molecules The system used in this research to demonstrate the feasibility of SSI is a molecular crystal of p-terphenyl with a
Fig. 1. Schematic of the experimental setup: ADC, analog-to-digital converter; DAC, digital-to-analog converter; PCI, peripheral component interconnect bus; MCS, multichannel scaling card; other abbreviations defined in text.
van Oijen et al.
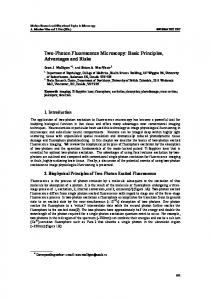
Fig. 2. Part of the fluorescence-excitation spectrum of pentacene in p-terphenyl taken at a wavelength of 592.20 nm. The laser frequency has been detuned by 20 GHz to the red with respect to the center of the O2 ensemble line. The features marked with asterisks result from two or more molecules and are not considered in the evaluation.
low concentration of pentacene molecules, a system often used for single-molecule spectroscopy.11 In the p-terphenyl crystal the pentacene guest molecules can occupy one of four inequivalent lattice sites.12 The S 1 ← S 0 transitions of the pentacene molecules in these sites give rise to four spectrally well-separated ensemble lines in the absorption spectrum, O1 –O4. 13 Only molecules present in the lattice sites that correspond to O1 and O2 have photophysical parameters suitable for singlemolecule detection. All experiments described in this paper are performed on pentacene molecules residing in the O2 site. Cooling the system to a temperature of ;1.2 K causes an extreme narrowing of the zero-phonon optical transitions of the single molecules, which leads to high peak absorption cross sections. The spectral selection of a single molecule is realized by taking advantage of the fact that the homogeneous linewidth (the linewidth of a zero-phonon optical transition of a single molecule) becomes much narrower than the inhomogeneous linewidth, representing the statistical distribution of the absorption frequencies of the whole ensemble of molecules. This distribution arises as a result of the different environments that each molecule experiences, which are caused by variations in local strain and by imperfections in the crystal. When an excitation source is used with a linewidth much narrower than the inhomogeneous linewidth, spectral selection of a single molecule can be achieved by tuning the excitation frequency into the wing of the inhomogeneously broadened ensemble line where the density of absorbing molecules per unit frequency is very low. Figure 2 shows part of the fluorescence-excitation spectrum of pentacene in p-terphenyl that we obtained by monitoring the signal from the avalanche photodiode as a function of the relative laser frequency. The peaks labeled 1–7 correspond to single pentacene molecules and are situated approximately 20 GHz to the red of the ensemble line of O2, which had a linewidth of 1.5 GHz. The homogeneous linewidths of the molecules lie between 20 and 10 MHz. The variations in linewidth and fluorescence count rates among the molecules are caused by the different excitation intensities experienced by the mol-
Vol. 16, No. 4 / April 1999 / J. Opt. Soc. Am. A
911
ecules throughout the excitation profile. Knowing all the necessary photophysical parameters of pentacene in this particular host at low temperatures,14 the intensity of the applied excitation light, and its polarization orientation compared with the orientation of the transition-dipole moment of the molecule in the crystal, we determine the total fluorescence-emission rate of one pentacene molecule to be 1.5 3 106 photons/s. Comparing the observed count rates in Fig. 2 with this number determines the total collection efficiency of the microscope to be a mere 0.1%. There are several factors that contribute to this low collection efficiency. The detrimental effect of liquid helium on optical cements in high-N.A. multicomponent objectives forces us to use a single lens for the collection optics. With the requirement that spherical aberration be minimized, the N.A. of these singlets will never exceed 0.6 and, as a consequence of this, the collection efficiency will never be more than a few percent. Also, chromatic aberrations are prominently present in single-lens systems and prevent the fluorescence of the molecules, which is dispersed in frequency space over more than 50 nm, from being focused into a diffraction-limited spot on the detection pinhole. Despite these drawbacks, the signalto-noise ratio is sufficient enough for imaging the single molecules on a CCD camera and obtaining their exact locations with sub-diffraction-limited accuracy, as presented in the following sections. B. Lateral Position Determination of Single Molecules When the laser is tuned in resonance with a particular single molecule, all the light collected by the microscope will originate exclusively from this molecule and, when it is imaged onto the CCD camera, will form a diffractionlimited image of a point source (the physical dimensions of the molecule are approximately 1 nm, a size that is negligible compared with the wavelength of the light). In the inset of Fig. 3 the image of a fluorescing pentacene molecule is shown. The distribution of the signal clearly shows an Airy-function-like shape. The actual lateral
Fig. 3. Inset, fluorescence image of a single pentacene molecule. From the width of the Airy-function-like shape, the lateral resolution of the microscope is determined to be d r exp 5 880 nm. The circles represent the accuracies of the position determination of a single molecule as a function of acquisition time. These data points are fitted (solid curve) by the sum of the accuracy given by Poisson statistics (dotted curve) and the mechanical drift in the setup (described by a random walk; dashed curve).
912
J. Opt. Soc. Am. A / Vol. 16, No. 4 / April 1999
resolution of the microscope is given by the FWHM of the photon distribution and is found to be d r exp 5 880 nm, which is slightly larger than the calculated value of d r 5 670 nm. This discrepancy is caused primarily by spherical aberrations introduced by the deviation of the index of refraction of liquid helium (n 5 1.03) from that of air, for which the objective lens is designed. From this image we obtain the relative x and y positions of the molecule by calculating the exact center of the photon distribution with subpixel accuracy. We do this by applying a threshold to the image and determining in both lateral dimensions the position of the line that divides the image into two halves that contain an equal amount of counts. The intersection of the horizontal and vertical lines then represents the center of the photon distribution and thus the lateral position of the molecule. The computational simplicity of this algorithm ensures effective use of available computing power while preserving the desired accuracy. The precision with which the centroid can be obtained is determined by Poisson statistics of the detected photons and the noise of the detector (readout noise and dark-current noise). Since the imageintensified camera amplifies the signal of the detected photons by almost a factor of 100 before the signal is detected by the CCD chip itself, the noise contributions of the CCD chip and its analog-to-digital converters can be neglected. When the shape of the photon distribution is assumed to be Gaussian, the accuracy of the centroid determination can be derived, after some simple calculus, as Dx, y 5 (ln 2)21/2( p /4 N) 1/2d r exp , where the total amount of detected photons is denoted N. For an average molecule the CCD camera acquires a signal corresponding to 2500 detected photons/s. The discrepancy between this number and the count rates shown in the fluorescenceexcitation spectrum is caused by the chromatic aberration that is present in the collection optics, as explained in Section 2. In the confocally detected fluorescenceexcitation spectra this aberration prevents the fluorescence from being focused onto the detection pinhole and causes a decrease in collection efficiency. When the fluorescence is imaged on a CCD camera in a nonconfocal manner this effect is absent, and the amount of collected photons per unit of time increases. For the observed count rates the calculated accuracy determined by Poisson statistics is then represented by the dotted curve in Fig. 3 as a function of acquisition time. The experimentally obtained accuracies, however, show a completely different behavior (circles in Fig. 3), which is caused by the presence of a small mechanical drift of our sample with respect to the objective. This can be quantified by repeatedly imaging a molecule at one acquisition time and following the position in time. The drift can be fitted fairly well (dashed curve in Fig. 3) when it is described, in a first approximation, as a random walk D(x, y) drift 5 D At, where D is a free fitting parameter and t denotes the acquisition time. It is evident that in the absence of drift the lateral accuracy, purely based on the photon statistics, would be better than 5 nm for an averaging time of 15 s, as used for the image in Fig. 3. Despite the presence of this drift, typical accuracies of 40 nm are achieved. When the laser is tuned in resonance with another molecule that resides in the same diffraction-limited volume,
van Oijen et al.
Fig. 4. (a) Diffraction-limited image of molecule 3. Its lateral position is determined as x 3 5 (1.357 6 0.040) m m and y 3 5 (1.420 6 0.040) m m. (b) Diffraction-limited image of molecule 5. Here x 5 5 (1.741 6 0.040) m m and y 5 5 (1.410 6 0.040) m m. Both images were obtained with an accumulation time of 15 s on the CCD camera. The total image covers 4.7 mm 3 4.7 mm in object space. (c) Sum of the images shown in (a) and (b).
a similar procedure can be applied to obtain the lateral position of this molecule, as depicted in Fig. 4(a) for molecule 3 and in Fig. 4(b) for molecule 5. Figure 4(c) shows the sum of the emission patterns of the two molecules as it would be observed in a conventional experiment, without the method of spectral selection. It is obvious that in this case the determination of the location of the molecules would be impossible as a consequence of the overlap of their diffraction patterns. C. Axial Position Determination of Single Molecules To obtain the axial positions of the single molecules, we probe the distribution of the emission photons in the image space in all three spatial dimensions by moving the CCD camera along the optical axis and acquiring fluorescence images of the molecule. At the top of Fig. 5 we present the images of molecule 3 for six different positions along the optical axis. When the CCD is situated exactly in the focal plane of the emission, the diameter of the photon distribution will be at its smallest and the intensity at its highest. In positions in front of or behind this focal plane, the distribution will be broadened in the lateral direction. In addition, as a consequence of the constant signal level integrated over the molecular image, the peak intensity will decrease. We define the radial size of the photon distribution as the radius w of the disk that contains 50% of the total amount of photons detected by the CCD camera; Fig. 5 shows the dependence of w on the axial position of the CCD camera for molecules 2 and 3. Again the horizontal and the vertical scales have been converted into object space dimensions. When the data are fitted with the radial size of a Gaussian beam according to
F
w ~z! 5 w0 1 1 2
2
~ z i 2 z !2l 2
p 2w 04
G
,
(1)
where w 0 denotes the minimum beam waist and z i is the relative axial position of molecule i, the mutual positions of the molecules can be determined with a precision that is much greater than the axial size of the diffractionlimited volume. Since the molecule is effectively a point source compared with the wavelength of the light, the distribution of the emission photons in the image space is equivalent to the point-spread function (PSF) of the microscope. From this fit several characteristics of the PSF
van Oijen et al.
Vol. 16, No. 4 / April 1999 / J. Opt. Soc. Am. A
913
can be extracted and compared with the theoretical values. Assuming that the energy distribution of the focus can be represented by the energy distribution of a focused Gaussian beam, the axial size of the diffraction-limited focal volume is given by the parameter 2 p w 0 2 /l. We determined the axial size of the PSF, averaged over the seven molecules depicted in Fig. 2, to be d z exp 5 6.5 6 0.3 m m. The discrepancy with the calculated value for the applied N.A. and wavelength, d z 5 4.0 m m, can be explained by the presence of spherical and chromatic aberration. The lateral size of the PSF, which corresponds to the lateral resolution of the microscope and is given by 2w 0 , is also extracted from the fits of the same set of seven molecules and is d r exp 5 0.95 6 0.08 m m, in reasonable agreement with d r exp 5 880 nm, the value found previously.
Fig. 6. Relative positions of molecules 1–7 (bright dots) together with the experimentally obtained total three-dimensional photon distribution summed in computer memory and projected into object space. Each molecule contributes one cigar-shaped photon distribution, whose intensity distribution is given by the gray scale. The size of each single distribution corresponds to the diffraction-limited resolution of the microscope, and the intensity is determined by the orientation of the transition-dipole moment of the molecule, the saturation characteristics of the optical transition, and the laser intensity at the location of the molecule. In a conventional experiment in which all seven molecules are excited simultaneously, the total cloud is observed without information on the mutual position of the contributing molecules.
Fig. 5. Dependence of radial spot size on the axial position of the CCD camera for molecule 2 (filled circles) and molecule 3 (open circles). Horizontal and vertical scales are given in object space dimensions. We obtained spot size w(z) by taking the radial average of the photon distribution on the CCD camera with respect to the lateral position of the molecule and determining the radius of the area that contains 50% of the total intensity. The solid curve corresponds to a fit of a focused Gaussian beam waist according to Eq. (1). The axial positions of molecule 2 and molecule 3 are, respectively, z 2 5 (1.82 6 0.12) m m and z 3 5 (0.49 6 0.05) m m. For illustration, six photon distribution patterns are shown for molecule 2 at the indicated focal positions.
The relative positions of the molecules in the axial dimension are given by the parameter z i with typical errors that vary from 200 nm for molecules with extremely low numbers of detected photons (e.g., molecule 5 of Fig. 2) to a mere 50 nm. For most of the molecules investigated this error typically amounts to 100 nm, almost 2 orders of magnitude smaller than the dimension of the axial size of the diffraction-limited volume. In Fig. 6 the information about the lateral and axial positions of the seven molecules from the fluorescenceexcitation spectrum in Fig. 2 is combined and graphically presented as white dots. The experimentally obtained cigar-shaped fluorescence distributions that correspond to these molecules are summed and represented by the gray cloud surrounding the white dots. In a conventional microscope the spatial resolution is restricted to the dimensions of this (diffraction-limited) distribution of the emission, whereas this study shows that three-dimensional information well below this resolution can be obtained. To obtain more statistical information about the distribution of molecules within the crystal we probed two more areas on the sample. The distribution in the lateral direction of these single molecules is depicted in Fig. 7(a), where the gray area denotes the diffraction-limited exci-
914
J. Opt. Soc. Am. A / Vol. 16, No. 4 / April 1999
tation spot. The relative positions of molecules from different data sets obtained from different sample positions are all given relative to the statistical center of the distribution within each data set, since in our experimental arrangement we could not determine the distance of a single molecule with respect to the center of the focal volume. It is clear from this figure that the distribution in the lateral direction is random, as one would expect from the random nature of the doping process of the p-terphenyl crystal with pentacene molecules. The observation that the lateral spread of the molecules is somewhat larger than the lateral size of the excitation volume is explained by optical saturation effects, which cause an increase in effective excitation area. A similar picture can be drawn for the distribution of the molecules in the axial direction [Fig. 7(b)]. The zero is again set to be the statistical center of the axial distribution within each data set. Since the axial depth of the excitation focus is at least 6 mm, one would expect an axial distribution on a similar length scale. It is clear from Fig. 7(b) that the molecules are confined to a region with a thickness of only 1 mm. This observation cannot be explained by the thickness of the sample. We could check this by scanning the focus in the axial direction
van Oijen et al.
while using the microscope in reflection mode. From backreflections from the front and end faces of the crystal, a sample thickness of 10 mm could be established. An explanation for this phenomenon might be that, during the experiment, measurements were performed only on molecules that had a stable transition frequency during several hours. It is known that pentacene molecules in p-terphenyl crystals can show spectral diffusion, caused by changes in the local environment.14,15 This process can occur even at cryogenic temperatures, and it is thought to be caused by the reorientation of the central phenyl rings of the p-terphenyl molecules in proximity to so-called domain walls.16,17 When we probed different areas of the crystal, the changes in position and shape of the ensemble line (not shown) already gave an indication that the crystal studied consists of several domains because molecules that were very stable in frequency could be found only in a limited region of the crystal. Because in our experiment only these stable molecules are considered it might be that the distribution found in Fig. 7(b) reflects the presence of a very thin layer in the crystal with a relatively low amount of strain and no domain walls nearby. This structural property of the host crystal on a microscopic level, on this scale undetectable by other optical techniques, is intriguing and deserves further attention.
4. CONCLUSIONS
Fig. 7. (a) Relative lateral positions of molecules from three different areas in the sample studied (each data set is indicated by a different symbol). The gray area denotes the size of the diffraction-limited spot. The positions of molecules from different data sets obtained from different sample positions are all given relative to the statistical center of the distribution within each data set. (b) Relative axial positions of the molecules studied.
This study demonstrates that one can circumvent the diffraction limit, which dictates the resolution in far-field confocal microscopy, by combining position-sensitive imaging with spectral selection of single molecules (SSI). This technique makes it possible to obtain information with unprecedented accuracy about the positions of several single chromophores that reside within one diffraction-limited volume. Using SSI, we obtained structural information on a length scale of a few tens of nanometers in all three dimensions. The applicability of this technique was demonstrated in the model system of pentacene molecules in p-terphenyl, where spatial information about the distribution of the pentacene molecules was obtained on a length scale far below the diffraction limit. We have shown that in certain areas of this p-terphenyl crystal the pentacene molecules are not distributed isotropically throughout the excitation volume, as one would expect based on the random nature of the doping process of the crystal, but that they are confined to a region in the axial direction with a thickness of 1 mm. This thickness is almost 1 order of magnitude smaller than the axial resolution of our microscope, and it is clear that this characteristic feature of the crystal would remain unnoticed if conventional far-field optics were used. It would be a challenge to extend the technique developed and described in this paper to more-amorphous, biological systems. When one is labeling a biological specimen with fluorophores, a focal volume with dimensions comparable with the ones used in this paper would contain approximately 100–1000 emitters. By combining the SSI technique described in this study with modern sample-preparation techniques, which allow one to cool down watery biological systems to cryogenic tempera-
van Oijen et al.
tures while preserving the structural information, one could address all these fluorophores individually. In this way biological structures could be imaged with unprecedented resolution in light microscopy. An important problem, however, will result from the presence of spectral diffusion of the labeling chromophores, an effect that will be much more severe than in the crystalline system described in this paper.18 This diffusion behavior will impose an upper limit on the total amount of photons that a molecule will emit while it is in resonance with the excitation frequency. Also, photobleaching of the fluorophores can decrease this number of emitted photons, although cooling the system down to cryogenic temperatures will generally extend their lifetime dramatically. Fortunately, the results described in Fig. 3 indicate that for strongly fluorescing marker molecules, an acquisition time of a few hundreds of milliseconds will be enough to yield a high degree of accuracy in position determination. It is to be expected that there is a limit on the minimum distance between two molecules at which they still can be resolved by the method of SSI. When two molecules are so close that the interaction energy between the transition-dipole moments becomes comparable with the energy difference between their transition frequencies, the excitation energy will no longer be localized on one molecule, and both molecules will emit light simultaneously. This effect will be more pronounced in crystalline systems, in which the molecules are distributed over a small frequency range. In biological systems, however, the inhomogeneous spread of the transition frequencies of the fluorophores, because of the amorphous surrounding, will be much larger, and delocalization of excitation will probably occur only at intermolecular distances smaller than 1 nm. In conclusion, the technique of spectrally selective imaging holds promise for application to problems for which it is important to obtain spatial precision in the location of individual fluorophores below the diffraction limit. It would be a challenge to apply the technique to biologically relevant systems and to determine, for instance, the spatial positions of different segments of a protein or of individual genes along a DNA strand.
Vol. 16, No. 4 / April 1999 / J. Opt. Soc. Am. A
J. Ko¨hler is fellow of the Heisenberg program of the Deutsche Forschungsgemeinschaft.
REFERENCES 1. 2. 3. 4. 5.
6. 7. 8. 9. 10.
11.
12.
13.
14.
15.
ACKNOWLEDGMENTS We thank W. van Dieren of Princeton Instruments B.V. for making the PentaMax Gen IV CCD camera available for this experiment and W. Schul of the University of Amsterdam for his assistance in visualizing the data. This research is supported by the Stichting voor Fundamenteel Onderzoek der Materie, with financial aid from the Nederlandse Organisatie voor Wetenschapelijk Onderzoek.
915
16.
17. 18.
E. Abbe, ‘‘Beitra¨ge zur Theorie des Mikroskops und der mikroskopischen Wahrnehmung,’’ Arch. Mikrosc. Anat. Entwicklungsmech. 9, 413–468 (1873). Lord Rayleigh, ‘‘On the manufacture and theory of diffraction-gratings,’’ Philos. Mag. 47, 81–93, 193–205 (1874). Lord Rayleigh, ‘‘Investigations in optics, with special reference to the spectroscope,’’ Philos. Mag. 8, 261–274, 403– 411, 477–486 (1879). Lord Rayleigh, ‘‘Investigations in optics, with special reference to the spectroscope,’’ Philos. Mag. 9, 40–55 (1880) (continued from Vol. 8, p. 486). J. W. Strutt (Baron Rayleigh), ‘‘Investigations in optics, with special reference to the spectroscope,’’ in Scientific Papers by John William Strutt, Baron Rayleigh (Cambridge U. Press, Cambridge, 1899), Vol. 1, 1869–1881, pp. 416–459 [originally published in Philos. Mag.3,4] D. W. Pohl, ‘‘Scanning near-field optical microscopy (SNOM),’’ Adv. Opt. Electron. Microsc. 12, 243–312 (1991). H. Heinzelmann and D. W. Pohl, ‘‘Scanning near-field optical microscopy (SNOM),’’ Appl. Phys. A: Solids Surf. 59, 89– 101 (1994). D. H. Burns, J. B. Callis, G. D. Christian, and E. R. Davidson, ‘‘Strategies for attaining superresolution using spectroscopic data as constraints,’’ Appl. Opt. 24, 154–161 (1985). E. Betzig, ‘‘Proposed method for molecular optical imaging,’’ Opt. Lett. 20, 237–239 (1995). H. van der Meer, J. A. J. M. Disselhorst, J. Ko¨hler, A. C. J. Brouwer, E. J. J. Groenen, and J. Schmidt, ‘‘An insert for single-molecule magnetic-resonance spectroscopy in an external magnetic field,’’ Rev. Sci. Instrum. 66, 4853–4856 (1995). W. E. Moerner, ‘‘Low-temperature studies in solids,’’ in Single-Molecule Optical Detection, Imaging and Spectroscopy, T. Basche´, W. E. Moerner, M. Orrit, and U. P. Wild, eds. (VCH, Weinheim, Germany, 1997), Chap. 1. J. L. Baudour, ‘‘Transition structurale dans les polyphenyles. I. Structure crystalline de la phase basse temperature du p-terphenyl a 113 K,’’ Acta Crystallogr., Sect. B: Struct. Crystallogr. Cryst. Chem. 32, 150–154 (1976). H. de Vries and D. A. Wiersma, ‘‘Fluorescence transient and optical free induction decay spectroscopy of pentacene in mixed crystals at 2 K. Determination of intersystem crossing and internal conversion rates,’’ J. Phys. Chem. 70, 5807–5822 (1979). W. P. Ambrose, Th. Basche´, and W. E. Moerner, ‘‘Detection and spectroscopy of single pentacene molecules in a p-terphenyl crystal by means of fluorescence excitation,’’ J. Chem. Phys. 95, 7150–7163 (1991). M. Orrit and J. Bernard, ‘‘Single pentacene molecules detected by fluorescence excitation in a p-terphenyl crystal,’’ Phys. Rev. Lett. 65, 2716–2719 (1990). P. D. Reilly and J. L. Skinner, ‘‘Spectral diffusion of individual pentacene molecules in p-terphenyl crystal; stochastic theoretical model and analysis of experimental data,’’ J. Chem. Phys. 102, 1540–1552 (1995). J. L. Skinner and W. E. Moerner, ‘‘Structure and dynamics in solids as probed by optical spectroscopy,’’ J. Phys. Chem. 100, 13,251–13,262 (1996). M. Orrit, J. Bernard, A. Zumbusch, and R. I. Personov, ‘‘Stark effect on single molecules in a polymer matrix,’’ Chem. Phys. Lett. 196, 595–600 (1992).