Farm Restructuring and Efficiency in Transition: Evidence from Bulgaria and Hungary
Erik Mathijs and Liesbet Vranken
May 2000
Prepared for presentation to the American Agricultural Economics Association 2000 Annual Meeting Tampa, FL, July 30- August 2, 2000
Erik Mathijs is Assistant Professor and Liesbet Vranken Research Associate at the Policy Research Group of the Katholieke Universiteit Leuven, de Croylaan 42, 3001 Leuven, Belgium. Tel.: +32 16 321450 – Fax.: +32 16 321996 – E-mail:
[email protected]. This research was undertaken with support from the European Union’s Phare ACE Programme 1996. The authors thank Tibor Ferenczi, Hamish Gow, Diana Kopeva, Alexander Sarris and Jo Swinnen for their input in the survey and for their comments on the paper.
Copyright 2000 by Erik Mathijs and Liesbet Vranken. All rights reserved. Readers may make verbatim copies of this document for non-commercial purposes by any means, provided that this copyright notice appears on all such copies.
1
Farm Restructuring and Efficiency in Transition: Evidence from Bulgaria and Hungary
Erik Mathijs and Liesbet Vranken
ABSTRACT Based on survey data on Bulgarian and Hungarian crop and dairy farms, a double-peaked distribution of technical efficiency is observed. Several factors explain differences in efficiency. Human capital matters not only through age and education, but also through gender as farms with a higher share of women are more efficient. Contracting with upstream processors increase efficiency through facilitating the adoption of technology and the access to credits. The superiority of family farms over corporate farms is confirmed for crops but not for dairy.
Key words: Eastern Europe, Bulgaria, Hungary, technical efficiency, land tenure, governance
2
Farm Restructuring and Efficiency in Transition: Evidence from Bulgaria and Hungary Erik Mathijs and Liesbet Vranken
Introduction Farm restructuring in Central and Eastern Europe has been expected to bring about productivity and efficiency improvements, mainly as a result of improved incentives from competitive markets. Reform measures to liberalize prices, abolish subsidies, and create competitive markets should increase competitive pressures in and push farms to the efficient frontier or drive them out of business (Sotnikov). There is a longstanding belief that only production units organized as family farms will survive, due to their transaction cost advantages in dealing with agency problems (Schmitt, Deininger). Studies based on country data suggest that partial and total factor productivity measures have indeed improved in countries where the shift from collective to individual tenure has been more profound—such as in Albania and Romania—compared to countries where large-scale corporate farms persist—such as the Czech Republic, Hungary and Slovakia (Macours and Swinnen, Mathijs and Swinnen, 1998). Studies using firm-level accountancy data for East Germany and the Czech Republic suggest that the successors to the large-scale state and collective farms are not necessarily less efficient than the newly established family farms (Hughes; Mathijs and Swinnen, 2000). Unfortunately, all these studies have limited explanatory power as efficiency is affected by many more factors than organizational form, such as human capital and the farm’s environment. This paper uses survey data from Bulgaria and Hungary, which provide a rich set of variables to explain the pattern of technical efficiency. We proceed in two stages: first, non-parametric firm-
3
level technical inefficiency scores will be calculated using Data Envelopment Analysis and second, these measures will be used as dependent variable in a regression analysis.
Methodology To measure technical efficiency requires first, the specification of a frontier production function, and second, the measurement of the deviation or distance of the farms from the frontier, which is then a measure of technical inefficiency. For this, we use the technique of Data Envelopment Analysis (DEA), that constructs a convex hull around the observed data (Charnes et al.). A farm displays total technical efficiency if it produces on the boundary of the production possibility set. This boundary or frontier is defined as the best practice observed assuming constant returns to scale (CRS). Total technical efficiency can be further decomposed into pure technical efficiency and scale efficiency.
To calculate pure technical efficiency, the production technology is
assumed to display variable returns to scale (VRS). Scale efficiency is then the residual between total and pure technical efficiency. As a result, a farm that displays pure technical efficiency may not operate at an optimal scale, that is, its input-output combination may not correspond to the combination that would arise from a zero-profit long-run competitive equilibrium situation (Färe et al.). In the remainder of the paper we will only deal with measures of total technical efficiency to enable the comparison between family farms, most of which are relatively small, with successor farms of state and collective farms, which are all large. We follow the approach suggested by Coelli et al. who contend that in a VRS model an inefficient farm is benchmarked against firms of similar size. In a CRS a firm may be benchmarked against firms which are substantially larger (smaller) than it. As in Färe et al. we assume that production is characterized by a non-parametric piecewise-linear technology, so that simple linear programming techniques 4
can be used to calculate efficiency. We further assume strong disposability of outputs and inputs and estimate the non-parametric deterministic frontier, expressed in terms of minimizing input requirements. Total technical efficiency can be estimated using the following linear program for each farm k that constructs the CRS frontier: {minλ,z λ subject to z Y ≥ Yk; z X ≤ λ Xk; z ≥ 0}, where Yk denotes the output of farm k, Xk is a vector of four inputs employed by farm k (capital, land, labor and other inputs), and z is a vector of k intensities that characterizes each farm.
Data Data for the efficiency calculation were taken from a representative survey of Hungarian and Bulgarian farms in 1998. The survey was stratified according to organizational form (family farms and corporate farms). The Hungarian data include 1,618 family farms and 404 corporate farms (including cooperatives), while the Bulgarian data set contains information on 1,411 households and 196 corporate farms (mostly cooperatives). A review of the data revealed some errors and farms for which errors could not be resolved were dropped.
Farms for which
information about physical production was missing were eliminated. We also removed farms when data on either labor, land or capital was missing. As it is best to study an homogeneous group of farms, we focus only on farms specialized in crops, a relatively land intensive commodity, and in dairy, a relatively capital intensive commodity. To be classified as a crop or a dairy farm, the value of grain or cow milk production in total output had to be more than 50 %. As a result of the data cleaning and the omission of mixed farms, we retained 178 Hungarian crop farms (63 cooperatives, 40 companies, and 75 family farms), 77 Hungarian dairy farms (24 cooperatives, 13 companies, and 40 family farms), and 93 Bulgarian crop farms (45 cooperatives,
5
9 companies, and 39 family farms). Bulgarian dairy farms could not be included in the study since the available number of farms specialized in cow milk production was too small. The data used for the calculation of technical efficiency include gross output and data on land, labor, capital and other inputs. Land is total cultivated area multiplied by a land quality index. We calculated the input ‘capital’ using the estimated value of farm buildings, machinery, livestock and plantations. Labor figures were converted into annual working units (AWU) in order to achieve comparable data. In the Hungarian sample, one AWU corresponds to 2,150 labor hours or the number of hours that a full-time worker can perform in one year. The labor numbers used in the Bulgarian calculations are the total amount of workers and not the total hours worked. For intermediate inputs we took into account the value spent on seeds, feed grains, roughage, concentrated feed, fertilizers, electric energy, gas, fuels and services plus the value of their inventories. Output is physical production valued at fixed prices and corrected for own produced feed used for animals. Using fixed national prices was necessary to avoid that output would be affected by price differences. The prices used in the output calculations were based on price information available in the surveys. Summary statistics are given in table 1 by organizational form. Family farms include both farms registered as sole proprietors and unregistered farms. Corporate farms are subdivided into two groups.
First, companies include both privatized state farms registered as joint stock
companies, cooperatives that have turned themselved into joint stock or limited liability companies and limited partnerships that could have been established as a result of the break-up of a collective farm or de novo. Second, cooperatives are true production cooperatives (one man = one vote). Table 1 reveals that the family farms in the data set are relatively small compared to the corporate farms. A comparison between companies and cooperatives shows that in crop production the cooperatives are on average larger than the companies, while the opposite is true 6
for the dairy farms. Further, the summary statistics show that the Bulgarian crop farms are on average smaller than the Hungarian ones.
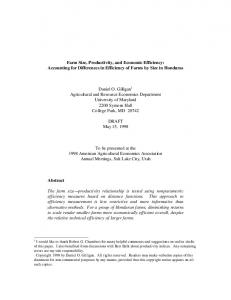
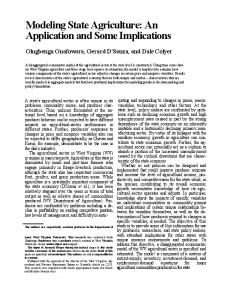
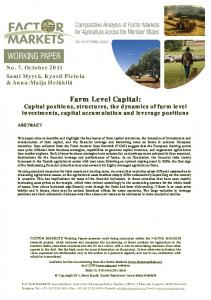
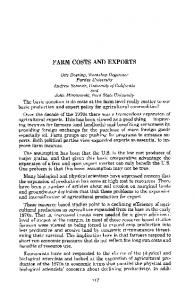
Efficiency Results Efficiencies were calculated for each of the three production sectors separately (Hungarian crops, Bulgarian crops and Hungarian dairy). The distribution of technical efficiency of Hungarian crop farms is shown in figure 1. It shows that the majority of the farms reach an efficiency level between 30 and 60 %. Both family farms and corporate farms can be found on the frontier, but a considerably higher share of family farms is located on the frontier. The distribution of cooperatives is shifted more to the left than those of companies and family farms. Figure 1 suggests that, while the three production structures can be technically efficient, on average cooperatives are less efficient than companies, while companies in turn perform worse than family farms. The average technical efficiencies confirm this idea: family farms reach an average of 58 %, companies of 50 % and cooperatives of 44 %. However, the differences are too small to be conclusive. A two-peaked distribution of the technical efficiency of Bulgarian crop farms becomes clear in figure 2. Corporate and family farms are able to become technically efficient. In comparison with Hungarian crop farms, we find a relative large amount of inefficient production units. For example, more than 30 % of the cooperatives reach an efficiency level lower then 20 %, while none of the Hungarian cooperatives specialized in crop production performed that bad in terms of efficiency. Companies reach an average efficiency of 51 % and thus perform better than family farms that reach an average efficiency of 44 %. It is important to take into account that the data contains only 9 Bulgarian companies specialized in crop production. This should be
7
kept in mind when a comparison is made between companies and one of the other two production structures. The average efficiency of cooperatives is 43 %. Figure 3 displays the distribution of the technical efficiency of the Hungarian dairy farms. A two-peaked distribution is shown: 45 % of the dairy farms reach an efficiency level between 10 % and 20 % and a rather large amount of the farms is located on the frontier—both family and corporate farms. The distribution of cooperatives is again shifted to the left. This is translated into a rather low average efficiency of 39 %. Companies perform somewhat better: they reach an average of 43 % due to the large amount of companies located on the frontier. The large spread of family farms leads to an average efficiency of 45 %, which does not allow us to conclude that they are more technically efficient than companies or cooperatives. To conclude, huge inefficiencies are apparent in all three sectors. Organizational form seems to be playing in role in explaining some in the differences in inefficiency, but it is also clear that additional factors will play an important role. In the next section, we will explore the factors that determine technical (in)efficiency in more detail.
Regression results To assess the sources of measured efficiencies, we use a Tobit regression model as efficiency scores are truncated (Zheng et al.). Farm-specific estimates of total technical efficiency are used as dependent variable.
As information on potential explanatory variables differs by
organizational form, we carried out three sets of regressions: the first set including only family farms, the second only corporate farms and the third pools data on family farms and corporate farms. In each case we use variables reflecting the stock of farm resources, such as human and physical capital, the flow of farm resources (investment) and farm organization.
8
Family farms Table 2 provides the summary statistics of the explanatory variables used in the regressions using data only for family farms: As proxies for the stock of resources, we use the average age of farm operators who spent most of their time on the farm (age), the average number of years of schooling of the most active farm operators (education), and the average share of women in adult household members (gender). On average, Bulgarian farmers (60 years) are older than Hungarian ones (51 years), while the level of education is about the same (9 to 11 years of schooling). We also introduce the variable purchased land, which is the share of newly purchased land in the total land holding of the household. This variable may be interpreted as reflecting the entrepreneurial ability of a household. The resource flow is captured first of all by the dummy variable investment that equals one if the household has made any investment in the last year. Hungarian farmers have invested slightly more (58 to 65 %) than Bulgarian ones (44 %). Further, the dummy variable contract, that equals one when some sales where made on contract, is introduced to test whether contracting has facilitated the access to technology. While quite a high share of Hungarian farmers deliver their produce on contract (31 to 45 %), contracting is relatively unimportant for Bulgarian family farms (13 %). For Bulgarian crop farmers, we introduced an additional variable sales, which is a dummy that equals 0 if all production is consumed within the household and 1 if at least some products are sold. Table 2 reveals that 15 % of all Bulgarian crop farmers sold nothing at all. Farm organization is captured by the following variables: specialization is the share of grains or milk in total output; feed production is a dummy that equals one if feed used for the breeding of animals was partly produced on the farm; and member/partner is a dummy that 9
equals one when at least one household member is member of a cooperative or partner in a company. The summary statistics reveal that 75 % of all dairy farms produce their own feed. Further, only a small share of family farms has a direct link with a cooperative or company. The results of the regressions are shown in table 3. We also introduced the land-man ratio to account for the differences in natural environment and in the case of Hungarian crop farmers also the distance to the nearest bus stop. The following conclusions can be reached: First, the results confirm the importance of human capital: the positive impact of education on technical efficiency is strongly confirmed both in dairy and crop production and in Bulgaria and Hungary. The effect of age differs. While age has a positive impact on Hungarian crop farms, it has a negative effect on Hungarian dairy and Bulgarian crop farms. The share of women in the household always has a positive impact on efficiency, but only significantly so in the case of Hungarian crop farms. The variable land acquisition has a positive and significant effect on the efficiency of Hungarian farms and is probably a proxy for the entrepreneurial orientation of the household. Economic size as measured by total output has a positive effect on efficiency in Hungary—not in Bulgaria—which suggests that larger family farms are more efficient than smaller ones. This is consistent with the general wisdom that the average cost curve in agriculture is L-shaped (Hallam). Second, contracting has a positive and significant effect on technical efficiency, but more so in Hungarian crop farming than in Hungarian dairy farming. This result supports Gow and Swinnen who report the positive effects of contracts offered to farmers by upstream processors, as the latter often provide advice, information and new technology, but also because such contracts facilitate the farmer’s access to credits through the intermediation efforts of the processor. For the regression on Bulgarian crop farms we also introduced a variable sales to capture the effects of subsistence. This was not necessary in Hungary where all farms are 10
commercial businesses. Sales have a positive effect on efficiency, which suggest that subsistence has a negative impact on technical efficiency. This confirms the finding of Parikh et al. that subsistence prevents farmers from reaching the efficiency frontier. When, in addition, products are being sold on contract, efficiency increases even more. Further, the negative effect of the investment dummy for Hungarian farms seems strange, as investment is mostly increasing efficiency though improved technology. However, crop farms invested in livestock rather than in assets enhancing crop productivity. Moreover, as the specialization variable shows, specialized farms are more efficient, which suggests that economies of specialization outweigh economies of scope. Third, membership in another agricultural enterprise has a negative effect for Hungarian crop farms, but a positive impact for Hungarian dairy farms and Bulgarian crop farms. Several factors play a role here. The traditional explanation is that off-farm work has a negative effect on efficiency, as less time is spent on managerial activities improving farm efficiency (Timmer, Parikh et al.). However, Herdt and Mandac found a positive relationship, which suggests that spending time off farm improves the farmer’s managerial skills through the acquisition of information. However, enterprise membership also reflects a better access to services, such as input provision, marketing and machinery. Sedik et al. stressed the importance of the presence of reliable channels of supply and sales to reduce the amount of resources devoted to search and to deal with the uncertainty associated with transition. Particularly the latter plays an important role in Bulgaria.
Corporate farms The summary statistics of explanatory variables for cooperatives and companies are given in table 4. With respect to human resources, only gender and the share of workers older than 60 11
could be used (60+). Again, Bulgarian farmers are older than Hungarian farmers, while slightly more women are employed on Bulgarian farms. Contract and investment have the same meaning as for the family farms. Almost all Hungarian farms sell their produce on contract (100 % for dairy and 92-95 % for crops), while only a quarter to a third of the Bulgarian corporate farms sell on contract. While specialization and feed production have the same meaning as for family farms, several additional variables related to the property rights and governance structure of corporate farms are included: •
Insider: the share of insiders, i.e. people actually working on the farm, in the total number of members. Particularly Hungarian dairy companies are characterized by a high share of absentee landowners (79 % of all members are absentee). Cooperatives have generally less outsiders.
•
Joint venture: enterprises with shares in other enterprises or from which shares are owned by other enterprises. The numbers point to a relatively high integration of both Hungarian companies and cooperatives into down- or upstream firms. This is due to the privatisation process which allowed corporate farms to buy shares of food processors. A similar process did not happen in Bulgaria, where cooperatives are far less integrated.
•
Transfer: dummy variable equal to 1 when a member or partner is allowed to transfer his or her ownership rights to his or her children. Interestingly, up to 46 % of Hungarian dairy cooperatives report that property rights are restricted, a surprisingly high figure considering property rights should be strong.
•
Sell: dummy variable equal to 1 when a member of partner is allowed to sell his or her land.
12
•
De novo: dummy variable equal to 1 when the farm has not been established as a direct successor of a state or collective farm. Most cooperatives are successors, while half to two thirds of the companies were established de novo
•
Non-agricultural activities: dummy variable equal to 1 when the farm has nonagricultural activities. Particularly Hungarian cooperatives are characterized by having activities in addition to their farming operation. The results of the three regression analyses are summarized in table 5 and allow to draw
the following conclusions: First, human capital has limited explanatory power to account for differences in technical efficiency among corporate farms. Both the share of labor force older than 60 years and the share of women in the labor force only have a positive impact on the efficiency of Hungarian dairy farms.
Further, as for the family farms, economic size has also a positive impact on the
efficiency of all corporate farms. This is a bit surprising, but the effect is smaller as reflected by the smaller size of the coefficients. Second, contract production has a positive impact on the performance of Hungarian crop farms. We introduced an interaction term between investment and contract in the regression on Bulgarian crop farms. The positive impact of contract production is even more stressed: farms that invested in 1997 and did not have contract production are less efficient than farms that invested and did sell products on contract. Third, the share of insiders has a positive influence on the technical efficiency of cooperatives. This can be ascribed to the fact that a high share of active members facilitates supervision. The effect of the share of insiders on the efficiency level of companies, as captured by the interaction effect company*insider, is negative which supports the idea that outside ownership increases the access to capital and encourages managers to improve technical 13
efficiency.
Companies perform significantly better than cooperatives, which suggests that
principal-agent problems are more restrictive in the latter. Among Hungarian dairy farms, de novo farms are more efficient than direct successors of cooperatives or state farms. Fourth, property rights matter as the variable transfer has a negative impact on technical efficiency of Hungarian crop farms. If members or partners of a corporate farm are able to pass on ownership rights directly to their children, the corporate farm herself is land insecure. Of course, this will have a negative effect on its efficiency. Nevertheless, this variable has an opposite effect on the efficiency level of Bulgarian crop farms. But here we introduced a dummy variable sell, which equals one if members or partners of a corporate farm could withdraw and sell their land. This variable also has a negative impact on the efficiency level. The variable sell was even more significant than the variable transfer. So, we can conclude that land insecurity has also a negative effect on the efficiency of Bulgarian crop farms. Fifth, only the efficiency level of Bulgarian crop farms is significantly affected by the degree of specialization, as more specialized farms are more efficient. Farms that are engaged in non-agricultural activities do not perform wel. This confirms the idea regarding the efficiency advantages of specialized firms. In the crop sector, joint ventures are performing significantly better than other firms. This can be ascribed to the exchange of technological and managerial know-how.
All farms Regression results for all farms pooled together are summarized in table 6. Only a limited number of variables could be included (gender, age, output, specialization, feed production, contract, investment). The results seem to support the hypothesis put forward by Allen and Lueck: in crop production, an extensive production sector, family farms are significantly more 14
efficient than corporate farms, while in an intensive production sector as dairy, there are no significant differences between family farms and corporate farms.
Conclusions In this paper we used survey data on Bulgarian and Hungarian crop and dairy farms to meausure and explain farm-specific technical efficiency. Using Data Envelopment Analysis, a doublepeaked distribution of efficiency can be observed, suggesting that most farms are far from the efficiency frontier. Hypotheses testing through Tobit regressions confirmed the superiority of family farms over corporate farms in crop farming, but rejected it in dairy farming. This result confirms the theory that family farms can only be more efficient in orientations where the influence of nature still plays a dominant role. An important policy implication is that farm restructuring towards individual tenures is only increasing efficiency in crop farming.
The
analysis further indicated that not only age and education play an important role, but also gender. Farms with a higher share of women are more efficient. This suggests that policies should be directed at women not only for equity reasons, giving women equal access to wealth, but also for efficiency reasons. Finally, a strong positive effect of contracts with upstream processors was found both for family and corproate farms. Contracts facilitate the adoption of technology and the access to credits. Governments should create an attractive environment for contracting and foreign direct investment, particularly as such contracts are introduced by foreign firms. Vertical coordination is an important strategy to tackle the situation of imperfect and missing markets that is so characteristic for transition economies.
15
References Allen, D.W. and Lueck, D. “The Nature of the Farm.” J. of Law and Econ. 41(1998):343-386. Charnes, A., Cooper, W.W. and Rhodes, E. “Measuring the Efficiency of Decision Making Units.” Europ. J. of Operations Res. 2(1978):429-444. Coelli, T., Prasada Rao, D.S. and Battese, G. E. An Introduction to Efficiency and Productivity Analysis. Kluwer Academic Publishers, Boston, 1998. Deininger, K. “Collective Agricultural Production: A Solution For Transition Economies?” World Develop. 23(1995):1317-1334. Färe, R., Grosskopf, S. and Lovell, C.A.K. The Measurement of Efficiency in Production. Kluwer Academic Publishers, Boston, 1985. Gow, H.R. and Swinnen, J.F.M. “Up- and downstream restructuring, foreign direct investment, and hold-up problems in agricultural transition.” Europ. Rev. of Agr. Econ. 25(1998):331350. Hallam, A. “Economies of Size and Scale in Agriculture: An Interpretive Review of Empirical Measurement.” Rev. Agr. Econ. 13(1991):155-171. Herdt, R.W. and Mandac, A.M. “Modern Technology and Economic Efficiency of Philippine Rice Farmers.” Econ. Develop. and Cult. Change 29(1981):375-399. Hughes, G. “The Total Factor Productivity of Farm Structures in Central and East Europe.” Bulgarian J. Agr. Sci. 5(1999), 298-311. Macours, K. and Swinnen, J.F.M. “Causes of Output Decline in Central and Eastern European Agriculture. ” J. Comparative Econ. 28(2000):172-206. Mathijs, E. and Swinnen, J.F.M. “Production Organization and Efficiency During Transition: The Case of East German Agriculture.” Rev. Econ. Stat., 2000, forthcoming. Mathijs, E. and Swinnen, J.F.M. “The Economics of Agricultural Decollectivization in East Central Europe and the Former Soviet Union.” Econ. Develop. and Cult. Change 47(1998):1-26. Parikh, A., Ali, F. and Shah, M.K. “Measurement of Economic Efficiency in Pakistani Agriculture.” Amer. J. Agr. Econ. 77(1995):675-685. Schmitt, G. “Why decollectivisation of agriculture in socialist countries has failed: a transaction cost approach.” In: Csaki, C. and Kislev, Y. (eds.), Agriculture Cooperatives in Transition, Westview Press, Boulder, 1993, pp. 143-159. Sotnikov, S. “Evaluating the Effects of Price and Trade Liberalisation on the Technical Efficiency of Agricultural Production in a Transition Economy: The Case of Russia.” Europ. Rev. Agr. Econ. 25(1998):412-431. Sedik, D., Trueblood M. and Arnade C. “Corporate Farm Performance in Russia, 1991-1995: An efficiency Analysis.” J. Compar. Econ. 27(1999):514-533. Timmer, C.P. “Using a Probabilistic Frontier Production Function to Measure Technical Efficiency.” J. Political Econ. 79(1971):776-794.
16
Zheng, J., Liu, X. and Bigsten, A. “Ownership Structure and Determinants of Technical Efficiency: An Application of Data Envelopment Analysis to Chinese Enterprises (19861990).” J. Compar. Econ. 26(1998):465-484.
17
40
Absolute frequency
35 30 25 20 15 10 5 0 0-10
10-20
20-30
30-40
40-50
50-60
60-70
70-80
80-90
90-100
Total technical efficiency
Figure 1a. Distribution of total technical efficiency of Hungarian crop farms. 18
Absolute frequency
16 14 12 10 8 6 4 2 0 0-10
10-20
20-30
30-40
40-50
50-60
60-70
70-80
80-90
90-100
Total technical effciency Company
Cooperative
Family farm
Figure 1b. Distribution of total technical efficiency of Hungarian crop farms by legal form.
18
20 18
Absolute frequency
16 14 12 10 8 6 4 2 0 0-10
10-20
20-30
30-40
40-50
50-60
60-70
70-80
80-90
90-100
Total technical efficiency
Figure 2a. Distribution of total technical efficiency of Bulgarian crop farms.
Absolute frequency
12 10 8 6 4 2 0 0-10
10-20
20-30
30-40
40-50
50-60
60-70
70-80
80-90
90-100
Total technical efficiency Company
Cooperative
Family farm
Figure 2b. Distribution of total technical efficiency of Bulgarian crop farms by legal form.
19
25
Absolute frequency
20
15
10
5
0 0-10
10-20
20-30
30-40
40-50
50-60
60-70
70-80
80-90
90-100
Total technical efficiency
Figure 3a. Distribution of total technical efficiency of Hungary dairy farms. 9
Absolute frequency
8 7 6 5 4 3 2 1 0 0-10
10-20
20-30
30-40
40-50
50-60
60-70
70-80
80-90
90-100
Total technical efficiency company
cooperative
family farm
Figure 3b. Distribution of total technical efficiency of Hungarian dairy farms by legal form.
20
Table 1. Summary statistics Family farm Average
St.Dev
Corporate farm Company Cooperative Average St.Dev Average St.Dev
HUNGARY Crop farms Output (× 106 HUF) Land (ha) Labor (AWU) Capital (× 10³ HUF) Inputs (× 10³ HUF)
1.605 26 1.2 2600 971
3.683 60 1 5031 2142
86.876 1282 26 48760 57490
Dairy farms Output (× 106 HUF) Land (ha) Labor (AWU) Capital (× 10³ HUF) Inputs (× 10³ HUF)
0.860 3 1.6 985 323
1.353 4 1.1 807 341
756.510 1558.941 2339 2031 137 134 340370 392341 236150 267217
606.860 2131 137 240367 163328
604.907 1512 103 147629 114425
BULGARIA Crop farms Output (× 106 BUL) Land (ha) Labor (AWU) Capital (× 10³ BUL) Inputs (× 10³ BUL)
4.871 6 1.2 17996 651
7.746 11 0.8 27619 1541
324.955 453 11 59343 19887
415.215 838 44 432768 53990
424.815 793 39 1880651 76920
Source: Own calculations
21
78.345 974 23 47901 56890
474.846 477 10 75384 19296
106.583 1645 58 93841 69506
82.068 1085 41 83383 68305
Table 2. Summary statistics of explanatory variables, family farms Hungary, crops Hungary, dairy Age 51 years 51 years Education 11 years 9 years Gender 29 % 36 % Land acquisition 13 % 14 %
Bulgaria, crops 60 years 10 years 40 % na
Contract* Sales* Investment*
31 % na 65 %
45 % na 58 %
13 % 85 % 44 %
Specialization Feed production* Member/partner*
77 % na 19 %
73 % 75 % 25 %
78 % na 15 %
Landman-ratio 22 ha/AWU 2 ha/AWU Distance 0.79 km na * Share of family farms for which the dummy variable equals one. Source: Own calculations
22
10 ha/AWU na
Table 3. Tobit regression results for family farms Independent Hungary, crops Hungary, dairy variables coeff. prob. coeff. prob. Stock Age 3.66 0.0001 -1.99 0.0443 Age^2 -0.03 0.0019 0.03 0.0022 Education 5.67 0.0134 21.04 0.0069 Education^2 -0.31 0.0006 -0.98 0.0228 Gender 0.43 0.0001 0.14 0.1738 Land acquisition 0.29 0.0015 0.36 0.0001 Output 0.50 0.0090 0.08 0.0327 Flow Contract Sales Invest
Bulgaria, crops coeff. Prob. -2.78 0.02 12.82 -0.64 0.06 0.36
0.4793 0.5810 0.0048 0.0037 0.6996 0.5362
24.99 -8.84
0.0001 0.1149
11.86 -13.97
0.0169 0.0269
25.29 22.22 7.23
0.0821 0.0397 0.4401
Organization Specialization Feed production Member/partner
0.13 -13.42
0.3685 0.0270
0.68 0.43 17.04
0.0033 0.9496 0.0011
1.16 15.07
0.0003 0.2257
Landman-ratio Distance Intercept
-0.27 14.93 -94.57
0.0004 0.0001 0.0018
-3.44 -97.83
0.0184 0.0691
-27.01
0.7765
Source: Own calculations
23
Table 4. Summary statistics of explanatory variables, companies and cooperatives
60 + Gender Contract* Investment* Insider Joint venture* Transfer of ownership rights to children* Sell* De novo* Specialization Feed production* Non-agricultural activities * Landman-ratio
Hungary, crops 1% 13 % 95 % 60 % 53 % 45 % 80 % na 68 % 78 % na 30 % 67 ha/AWU
Companies Hungary, dairy 1% 22 % 100 % 77 % 21 % 62 % 85 % na 46 % 72 % 85 % 46 % 21 ha/AWU
Bulgaria, crops 14 % 30 % 33 % 78 % 80 % 33 % 67 % 78 % na 93 % na 33 % 35 ha/AWU
Cooperatives Hungary, dairy Bulgaria, crops
Hungary, crops 60 + 2% 1% Gender 28 % 25 % Contract* 92 % 100 % Investment* 65 % 71 % Insider 67 % 75 % Joint venture* 64 % 63 % Transfer of ownership rights to children* 73 % 54 % Sell* na na De novo* 6% 17 % Specialization 74 % 69 % Feed production* na 96 % Non-agricultural activities * 70 % 54 % Landman-ratio 45 ha/AWU 18 ha/AWU * Share of companies for which the dummy variable equals one. Source: Own calculations
24
19 % 28 % 25 % 71 % 70 % 22 % 71 % 36 % na 82 % na 16 % 23 ha/AWU
Table 5. Tobit Regression results for corporate farms Hungary, crops Hungary, dairy coeff. prob. coeff. prob. Stock 60+ -1.14 0.1758 5.58 0.0008 Gender 0.03 0.8294 1.74 0.0001 Output 0.08 0.0080 0.06 0.0001 Flow Contract Invest Invest*contract Organisation Insider Company Company*insider Venture Transfer Sell De novo Specialization Feed production Non-agr.activities Landman-ratio Intercept
Bulgaria, crops coeff. prob. 0.26 -0.26 0.03
0.2376 0.1882 0.0443
11.39 11.09 -
0.0892 0.0071 -
-6.68 -
0.1561 -
-18.10 -50.08 56.49
0.2300 0.0002 0.0010
0.15 27.63 -0.26 8.22 -16.55 -0.11 -14.89
0.0076 0.0001 0.0044 0.0489 0.0007 0.4288 0.0002
0.15 38.28 -0.51 -0.70 6.85 28.72 -0.12 72.85 -24.94
0.0871 0.0001 0.0001 0.8657 0.1631 0.0055 0.7255 0.0001 0.0001
0.21 73.79 -0.40 27.61 21.98 -40.64 1.25 -1.51
0.0298 0.0201 0.2703 0.0087 0.0094 0.00 0.0001 0.8654
-0.06 41.89
0.0425 0.0026
0.16 -103.36
0.5390 0.0001
-0.08 -38.25
0.0036 0.2376
Source: Own calculations
25
Table 6. Tobit Regression results for all farms Independent Hungary, crops Hungary, dairy variables Coefficient prob. coefficient prob. Stock Gender 0.26 0.0017 0.05 0.7330 60+ -0.04 0.5808 0.18 0.0368 Output 0.07 0.0463 0.04 0.0001 Flow Contract Invest Invest * family farm Organization Company Family farm Specialization Feed production Intercept
Bulgaria, crops coefficient prob. 0.14 -0.14 0.02
0.3420 0.1504 0.0432
9.14 -27.10
0.0773 0.0010
-14.48 8.56
0.1388 0.4926
22.90 -
0.0068 -
16.99 49.21 -0.28 -
0.0004 0.0001 0.0168 -
18.24 16.33 1.50 10.13
0.0595 0.1945 0.0001 0.2249
-3.79 28.80 1.34 -
0.7477 0.0014 0.0001 -
51.08
0.0001
-79.83
0.0003
-74.56
0.0017
Source: Own calculations
26