Fast and Automatic Reconstruction of Structured Illumination. Microscopy Images with Multiscale Products. Clovis Tauber1, Pedro Felipe Gardeazábal ...
Fast and Automatic Reconstruction of Structured Illumination Microscopy Images with Multiscale Products Clovis Tauber1 , Pedro Felipe Gardeaz´abal Rodr´ıguez2 , Vincent Loriette2 , Nicolas Chenouard1 , Benoit Dubertret2 , Jean-Christophe Olivo-Marin1 1
Institut Pasteur - Quantitative Image Analysis Unit - CNRS URA 2582 25, rue du docteur Roux F-75724 Paris Cedex 15 France {tauber, chenouar, jcolivo}@pasteur.fr 2
Laboratoire Optique physique - ESPCI - CNRS UPRA 0005 10, rue Vauquelin F-75005 Paris France {PFGR, Vincent.Loriette, Benoit.Dubertret}@espci.fr
Abstract In this paper, we propose a new method to reconstruct high resolution images from structured illumination microscopy. It consists of estimating the illumination pattern parameters with a multiscale analysis in the Fourier domain and filtering the significative features with a statistical test. Our method is fast and automatic, aiming at being computationally effective for in vivo biomedical applications.
1. Introduction Structured illumination microscopy (SIM) is a technique that enables to go beyond the resolution limit imposed by the phenomenon of diffraction [1]. It has the advantage of being a full field method that can be implemented as an add-on to a standard fluorescence microscope. The method consists in illuminating the sample with a spatially structured light, generally sinusoidal stripes, to create moir´e fringes and acquiring three images by shifting the pattern twice by 2π/3. The fringes display information originating from the frequency region outside the cutoff of the microscope. Such images are actually the sum of three information components that can be computationally separated. The reconstruction of the high resolution image consists in repeating this process for several orientations of the illumination, and repo-
978-1-4244-2175-6/08/$25.00 ©2008 IEEE
sitioning the information to its proper position in the reciprocal space. This is generally done by comparing the different information components where they overlap [3]; the translations are estimated by registering data in the Fourier domain. As described in [2], the overall process is under the supervision of an operator that has to find the optimal settings by balancing between ringing artefacts and gain in resolution. This process is time consuming and not easily amenable to automatization, which limits its use in modern biological applications that require fast dynamic imaging. In this paper, we propose a new method for automatic reconstruction of the SIM high resolution images which is fast and computationally effective. Our approach consists in precisely localizing the Dirac spots associated with the illumination pattern with a wavelet product and a statistical hypothesis testing based on a Bessel function. The paper is organized as follows. Section 2 details how the reconstruction parameters can be estimated from the localization of Dirac spots. In section 3, we present the proposed multiscale wavelet product for spot detection and the associated statistical hypothesis test. Finally, experimentations are described in section 4.
2. Reconstruction from structured illumination parameters Considering a horizontal orientation of the illumination pattern, the intensity in the plane of the
three acquired images, noted In , n ∈ {0, 1, 2}, can be modeled by:
In (x, y) =
x I 2π (1 + cos(2π + φ)) +n 2 px 3
(1)
f
where px is the illumination period and φ is the phase shift of the illumination perceived by the microscope. In the Fourier domain, this leads to: 2nπ 2nπ I 1 I˜n (fx , fy ) = (δx + (δx− ei 3 +φ + δx+ e−i 3 +φ ))δy 2 2 (2) � � 1 − where δx = δ(fx ), δy = δ(fy ), δx = δ fx − px � � and δx+ = δ fx + p1x . The different components, noted I˜− , I˜c and I˜+ , that compose these images can be separated by linear combination of the different I˜n :
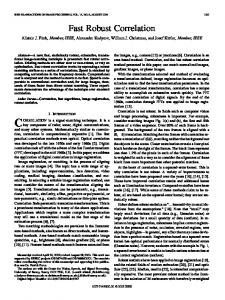
1 I˜c = (I˜0 + I˜1 + I˜2 ) = Iδx δy (3) 3 1 I˜− = I˜1 + I˜2 + √ (I˜1 − I˜2 ) + 2I˜c = Iδx− δy eiφ (4) i 3 1 I˜+ = I˜1 + I˜2 − √ (I˜1 − I˜2 ) + 2I˜c = Iδx+ δy e−iφ(5) i 3 The reconstruction method proposed by Gustafsson consists in moving each component to its proper position by registering I˜− and I˜+ with I˜c , as they should represent the same spectral information where they overlap [1]. We approach the reconstruction process from a different angle. Instead of registering data, we propose to estimate the parameters of the illumination pattern. The parameters are then used to shift the spectral components to their proper position because the translation corresponds to the illumination orientation and frequency (eq.4-5). As the Fourier transform of a sinusoidal striped illumination has only three components, this illumination pattern appears in the Fourier transforms I˜n of the acquired images as three Dirac spots. The distance of the spots to the DC corresponds to the illumination frequency (fig.1). We thus propose to estimate the reconstruction parameters by localizing automatically the Dirac spots associated with the illumination in the spectral domain. To obtain a significative resolution improvement, the period of the sinusoidal stripes has to be as small as possible. In the case of linear SIM, this means that the location of the spots in the Fourier domain has to be close to the cutoff frequency of the microscope. Considering the shape of
(a) SIM image
f
(b) Illumination pattern
Figure 1. Structured Illumination pattern in the Fourier domain.
the optical transfer function, this is where the signal to noise ratio is the lowest. As a consequence, Dirac spots appear in the Fourier amplitude domain as gaussian spots in very noisy background. To detect them, we propose a multiscale algorithm based on an undecimated wavelet representation of the data and a selective filtering of the wavelet coefficients, as described in the following section. Once the spectral components are repositioned, the phase shifts (e−/+iφ ) can be calculated by comparing the phase of the three overlapped DC components of I˜c , I˜− and I˜+ . All the reconstruction parameters can thus directly be obtained from the illumination pattern parameters.
3
3.1
Gaussian spots detection multiscale product
with
` trou Wavelet representation A
We use the `a trou wavelet transform based on a cubic spline [6]. Three specificities are exploited: i) the inherent adaptiveness of the analysis to the objects size, ii) the correlation of the wavelet coefficients of objets across consecutive scales and iii) the low computational cost that allows fast reconstruction. From an amplitude image A = |I˜n |, we compute separable convolutions to obtain the smoothed approximations Ai and Ai+1 . The detail images Wi = Ai − Ai+1 are obtained as the differences between consecutive approximation levels. As the spots are supposed to be Dirac delta functions, we limit our analysis to the finest scales and therefore only compute the first and second approximation images by convolution with the filters: h1
=
[
1 1 3 1 1 ] 16 4 8 4 16
(6)
h2
3.2
=
[
1 3 1 1 1 0 0 0 0 ] 16 4 8 4 16
(7)
Spots detection
Considering the very strong variations of amplitude in the Fourier domain, it is difficult to distinguish the Dirac spots from what can be perceived as noise by analysing one detail image only. Following the method proposed in [4, 5], we consider that the Dirac spots are features of interest represented by a small number of coefficients, that are both large and correlated across the scales. On the contrary, the discontinuities that correspond to noise have smaller coefficients that do not propagate across levels. We compute the correlation image Pn which corresponds to the multiscale spatial product between the two detail images: Pn (i, j) = W1 (i, j)W2 (i, j).
(8)
coefficients below the threshold. The Dirac spots are then identified as the strongest and furthest apart symetric spots among the remaining coefficient. We interpolate the data locally for sub-pixel accuracy.
4
Experimentations
4.1
Dirac spots localization
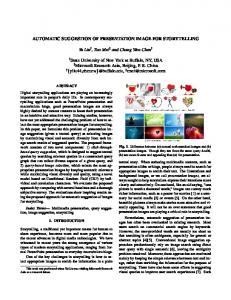
Figure 2 presents the result of the proposed automatic detection of Dirac spots when the illumination pattern corresponds to isotropic Gaussian spots. The studied sample is made of 200nm beads on a microscope slide, imaged with a x60 objective (NA1.2). We used a small illumination period so that the spots are located almost at the cutoff frequency, and have quite a low amplitude. As can be seen in figure 2d, our method leads to the correct localization of the Dirac spots.
The coefficients of Pn with high values correspond to small but significant isotropic objects.
3.3
Statistical Hypothesis testing
For more robustness, we filter the coefficients of Pn with a statistical hypothesis test. We consider that the Fourier amplitude image A is corrupted by an additive white gaussian noise. We first estimate the variance σ of the noise in A by filtering it with a high-pass Daubechie wavelet filter and by computing the median absolute deviation of the filtered data. This corresponds directly with the noise variance of A as this wavelet transform does not change the shape of the noise distribution, nor its variance. The variances σ1 and σ2 of the noise in W1 and W2 are computed from σ and used to normalize the noise in both detail images. The distribution of the noise in Pn corresponds to the product of two correlated Normal distributions with variance 1, it has the following PDF [5]: K0 (|x|) exp(ρ|x|) p p(x) = , π 1 − ρ2
(9)
where K0 is the modified Bessel function of the second kind, of zero order, and ρ is the correlation between two normally distributed variables. Our test is based on the corresponding cumulative density function. We compare the pvalues of the correlation image Pn with a predetermined detection level, and filter out the spots associated to
(a) An
(b) Pn
(c) Filtered
(d) Result
Figure 2. Automatic localization of the Dirac spots.
We generated more images with the beads, aiming at increasing the difficulty of the detection by creating spots with distorded shapes. Two corresponding results are presented in figure 3, with a zoom on the vicinity of one Dirac spot. In each case, the multiscale product correctly filters the information associated with the spot, and the statistical hypothesis test facilitates the spot detection.
4.2
Reconstruction method
Once the Dirac spots are precisely localized, we can compute the reconstruction parameters (sec.2). In figure 4, we present the result of our automatic reconstruction method, using the estimated parameters of the illumination pattern. Figures 4a and 4c show on one example that we reach the resolution enhancement that can be achieved by SIM. Figures 4b and 4d correspond to the intensity distribution in the small square depicted in figures 4a and 4c.
(a) An
(b) Pn
(c) Filtered
(d) Result
Figure 5. PSF comparison. (e) An
(f) Pn
(g) Filtered
(h) Result
Figure 3. Automatic localization of the Dirac spots (zoomed areas).
As can be seen, the unique spot in figure 4a has been clearly resolved into two different spots in the reconstructed image, illustrating the gain in separation ability. Finally, figure 5 shows the point spread function in an image obtained with the proposed SIM reconstruction method, and the PSF corresponding to the observation with a conventional microscope. The width of the SIM PSF at mid-height is smaller by a factor of 1.807, thus quantitating the gain in resolution.
5
Conclusion
We have presented a new method to reconstruct high resolution images in SIM. Our approach aims at improving the computational time for reconstructing SIM images and increasing the effectiveness of the system for biological applications. Rather than registering data in the Fourier domain, we proposed to estimate the reconstruction parameters by localizing the Dirac spots associated with the illumination pattern in the reciprocal space. We increase the robustness of the method thanks to selective filtering of features given by a wavelet transform. It is automatic and fast compared to the current reconstruction method. The effectiveness of the method was assessed on real data and proved its promising use for biological applications.
References
(a) Standard Image
(b) Zoomed area
(c) Reconstructed SIM Image
(d) SIM zoomed area
Figure 4. Resolution comparison.
[1] M. Gustafsson. Surpassing the lateral resolution limit by a factor of two using structured illumination microscopy. Journal of Microscopy, 198:82–87, 2000. [2] M. Gustafsson. Extended-resolution reconstruction of structured illumination microscopy data. Talk at the Signal Recovery and Synthesis Meeting, 2005. [3] M. Gustafsson. Nonlinear structured-illumination microscopy: Wide-field flurescence imaging with theoretically unlimited resolution. PNAS, 102:13081–13086, 2005. [4] J.-C. Olivo-Marin. Extraction of spots in biological images using multiscale products. Pattern Recognition, 35:1989–1996, 2002. [5] B. Sadler. Analysis of multiscale products for step detection and estimation. IEEE Trans. Inform. Theo., 45:1043–1051, 1999. [6] J. Starck, F. Murtagh, and A. Bijaoui. Multiresolution support applied to image filtering and restoration. Graph. Models Image. Process., 10:241–255, 1995.