Jun 25, 2012 - such as home and work whereas others exhibit more diver- sity. To address this .... session trigger. Figure 4: During this 2 hour timeline, SMS (in red) ...... fetch latency, which is constrained by cellular technology. Second ...
Fast App Launching for Mobile Devices Using Predictive User Context Tingxin Yan1 , David Chu2 , Deepak Ganesan1 , Aman Kansal2 , Jie Liu2 1
University of Massachusetts Amherst, 2 Microsoft Research
{yan, ganesan}@cs.umass.edu, {davidchu, kansal, jie.liu}@microsoft.com
ABSTRACT As mobile apps become more closely integrated into our everyday lives, mobile app interactions ought to be rapid and responsive. Unfortunately, even the basic primitive of launching a mobile app is sorrowfully sluggish: 20 seconds of delay is not uncommon even for very popular apps. We have designed and built FALCON to remedy slow app launch. FALCON uses contexts such as user location and temporal access patterns to predict app launches before they occur. FALCON then provides systems support for effective app-specific prelaunching, which can dramatically reduce perceived delay. FALCON uses novel features derived through extensive data analysis, and a novel cost-benefit learning algorithm that has strong predictive performance and low runtime overhead. Trace-based analysis shows that an average user saves around 6 seconds per app startup time with daily energy cost of no more than 2% battery life, and on average gets content that is only 3 minutes old at launch without needing to wait for content to update. FALCON is implemented as an OS modification to the Windows Phone OS.
Categories and Subject Descriptors C.5.3 [Computer System Implementation]: Microcomputers—Portable devices; D.4.8 [Operating Systems]: Performance—Modeling and prediction
Keywords Mobile devices, Context, Location, Application prediction
1. INTRODUCTION Mobile apps have blossomed in popularity and ubiquity. With each generation, the multitude and diversity of apps continues to grow. A recent tally revealed 380,000 iOS apps, 250,000 Android apps and 35,000 Windows Phone (WP) apps. With so many apps out there, systems support that
Permission to make digital or hard copies of all or part of this work for personal or classroom use is granted without fee provided that copies are not made or distributed for profit or commercial advantage and that copies bear this notice and the full citation on the first page. To copy otherwise, to republish, to post on servers or to redistribute to lists, requires prior specific permission and/or a fee. MobiSys’12, June 25–29, 2012, Low Wood Bay, Lake District, UK. Copyright 2012 ACM 978-1-4503-1301-8/12/06 ...$10.00.
can improve our daily app interaction experience is poised to be widely beneficial. Early pioneers in mobile computing recognized that during mobile interactions, human attention is a scarce resource [8, 13]. Our analysis of a long term user study [14] supports this view: 50% of mobile phone engagements last less than 30 seconds, and 90% of engagements last less than 4 minutes. With such brief periods of interaction, it is all the more important that interaction is rapid and responsive. Unfortunately, interacting with apps can be surprisingly sluggish. Applications can take dozens of seconds to launch, negating any sense of agility. A particularly troubling class of apps are games, some of which can take upwards of 20 seconds to fully launch past splash screens, and even more time to reach a playable state. Our investigation shows that even relatively simple apps such as weather reporters can experience launch delays of 10 seconds or more. Some applications, such as email clients, are optimized for quick launch within seconds. However, these applications mask actual latency by showing stale content while asynchronously fetching new content over the network. While appropriate for a restricted set of interactions, stale content fails to engage the user in the same way that the latest fresh content can. When considering the full launch time starting from touch until the latest content is displayed, apps with asynchronously loaded content can also exhibit severe load times of up to a dozen seconds. One possible approach to decrease launch time is to cache apps in memory. This approach is implemented by iOS, Android and WP, yet suffers from several drawbacks. First, some apps, especially games, demand large amounts of memory, overwhelming memory real estate for other apps. Therefore, na¨ıve caching schemes can exhibit low benefit. Second, caching does not address the issue that content may become stale by the time the user interacts with the app. Another possible approach that addresses stale content is the use of push notifications. While push notifications can ensure content freshness, the energy cost of push communication can be prohibitively high [12]. Not surprisingly then, four out of the top five battery saving suggestions offered by Apple concern disabling push notifications [1]. Ideally, we would like to take advantage of both available cache and proactive content updates without incurring their drawbacks. It so happens that mobile devices are equipped with an increasingly sophisticated array of sensors such as IMUs, mics, cameras and geolocation units. Each can provide insightful context for the OS [7]. For a particular user, Angry Birds usage may be much more likely
• From extensive data analysis, we design spatial and temporal features that are highly indicative of mobile app access patterns. • We design a cost-benefit learning algorithm whose pre1
Fast App Launching with Context. The peregrine falcon can swoop dive at more than 200 mph – making it the fastest animal on earth.
1
Cumulative Probability
at home, whereas Email and Calendar usage may be much more likely at work. Or, a user may habitually check Facebook after receiving an SMS when at school. We have built the FALCON1 system to predictively prelaunch apps based on context signals and user access patterns. Prelaunch entails both preloading apps in memory and app-specific fresh content preparation. At the foundation of FALCON is a data-driven analysis that reveals surprising insights about how and when we use mobile apps. We find an intrinsic bundling behavior in how mobile apps are used — once a user starts using the phone, say for a phone call or SMS, they tend to use several other applications before turning away from the phone to another task. Bundling behavior manifests not just at the timescale of single user session with the phone, but across longer durations of several weeks. We find that games are often used in bursts where users tend to obsessively use a game for a few weeks, and then ignore it entirely for several months. Similarly, other contexts such as location and time-of-day plays a central role in app usage, perhaps indicative of our tendency toward structured behavior. While such behavioral insights can be distilled into a set of preload prediction rules, a key challenge is that users are not alike in how these behaviors apply to them. Some users are more likely to open several apps after a phone call whereas others do so after opening the browser; some users have strong tendencies at a core set of tightly defined locations such as home and work whereas others exhibit more diversity. To address this, FALCON personalizes the context triggers to the individual to maximize prelaunch accuracy. Applications also differ widely in terms of the benefits from correct prelaunch versus the cost of incorrect prelaunch. As an example comparing two popular games, Need for Speed takes over 2× more energy than Plants vs. Zombies even though both load equally slowly. FALCON uses a novel costbenefit adaptive prediction algorithm that accounts for both the expected latency benefit of correct predictions and the expected energy cost incurred for wrong predictions. The algorithm adapts to budget constraints and jointly optimizes the applications to prelaunch as well as the temporal and location contexts under which such prelaunching is enabled. Both features and learning algorithm are designed to achieve very low runtime overhead. We have implemented FALCON as an operating system modification to the Windows Phone 7.5 operating system and show that it has minimal energy, memory and processing overhead. In addition to preloading apps from local storage, FALCON ensures content freshness by prefetching content before app launch. This is achieved with a WP event handler that FALCON invokes whenever it predicts the app is about to be launched. For example, a Twitter app can fetch new tweets during this event. As a result, a user’s time to first meaningful app interaction is no longer bound by network latency. Our major contributions are as follows.
0.8 0.6 0.4 0.2 0 1
5
10
Duration (Minutes)
Figure 1: App usage durations for a representative individual over a one year long trace. dictions lead to launch latency reduction of nearly 6 seconds per app usage with the daily energy cost of no more than 2% battery lifetime. Predictions also lead to getting content that is only 3 minutes old at launch without waiting for content to update at launch. • We prototype FALCON on a Windows Phone, and demonstrate that it has minimal runtime energy overhead of a few µAh and a small memory footprint of under 2 MB. Taken as a whole, FALCON effectively replaces a subset of the policy decisions traditionally reserved for the memory manager and scheduler. Context permits FALCON to make much more informed app decisions which lead to substantial launch time reductions at minimal overhead. The rest of this paper is organized as follows. §2 provides quantitative background of the problem. §3 provides an overview of the system. §4 discusses the launch predictor, features and learner. §5 details implementation aspects. §6 evaluates FALCON. §7 discusses related work, and §8 offers a discussion and conclusion.
2.
BACKGROUND AND PROBLEM SCOPE
In this section, we take a closer look at the issue of app launch latency. Our investigation is based on trace data collected from the Rice LiveLab user study [14], and our own internal study. In the Rice LiveLab’s study, thirty four volunteers were given iPhones for a period of fourteen months from 2010-2011. During this time, their device usage was monitored. Our own internal double-blind study consisted of three WP users monitored over one month. We focus on the following elements which were recorded in both traces: app usage, location, datetime. The LiveLab’s trace is much more extensive; it will be the main focus of investigation unless otherwise noted. We first examine the thesis that mobile interactions are inherently brief [8]. Figure 1 illustrates the CDF of app usage durations across all users in the Rice trace. Indeed, most interactions with the phone are short with 80% of the apps being used for less than two minutes. This indicates that short engagements are the norm and the proportional effect of slow app startup can be expected to be even more severe for mobile users. Qualitative reports suggest that slow app launch is a substantial drag on user experience. As an example, a recent iOS upgrade caused an outcry from iPhone owners that were
Most Popular Marketplace Apps
!"#$%&'$()*+&!,-.&/01&
'!"
Pre-installed Apps
&#" &!" %#" %!" $#" $!" #"
()
)*
" +,
-". /
01 2) ))* 34 " 5 ., 97 678 2 1 62 " 3": :8 - )8" D"E F 1 -* , 8 ?G 2,/ " -2 ,7 F HI D" ): DH -, : G H J -2 ,G " K- :GI G ) M, 1:"( " ,* 12L 7) 6" " N .6 G 77D 5 / A8" .6 " 7, 2" F 61 7 F " O 6/8" )6 :< ) 9) -" ,/ 7) "
!"
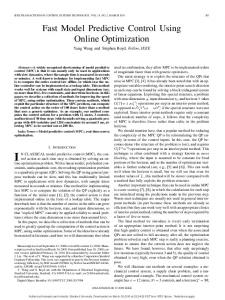
Figure 2: Total launch times of popular apps on Windows Phone. The first 14 are most popular apps in the Marketplace, and the last four are first-party apps that are preinstalled.
Figure 3: The FALCON Architecture. behavior is highly habitual, and linkable to observable context such as time and location.
hit with slower speeds [3]. Popular blogs suggest that users are willing to try involved system hacks to improve app launch times by ten seconds [2]. To quantify the extent of the issue, we studied the top 20 popular apps in the WP marketplace. Launch time represents the elapsed time from when a user taps on an app’s icon to the first time a user is able to interact with the application. Figure 2 shows that launch times are fairly long, with a median launch time of 11.2 seconds and an average launch time of 16.7 seconds. Surprisingly, no app launched in under 5 seconds. The trend for iPhone was similar. The use of asynchronous launch operations is a popular coping mechanism for slow launch times. Two typical classes of asynchronous operations are fetching content from the network while displaying stale content, and loading content from local storage while showing a splash screen. For example, when the native WP Email app is launched, it displays old messages while asynchronously fetching new messages. As a result, the launch time is 1.3-1.7 seconds. However, when the time for asynchronous message fetch is also accounted for, the elapsed time is 11 seconds, even on WiFi with no new emails present. Our anecdotal evidence suggests that checking for new email quickly is much more valuable than reviewing old email. Similarly, checking social networking apps for the latests posts is much more valuable than rereading old posts. For these network-bound apps, fast completion of asynchronous launch operations is important for much of the app’s utility. Similarly, games commonly employ splash screens while asynchronously loading graphics and art objects into memory from local storage. To count total launch time in these cases, we disable or skip any splash screens. Therefore, in this work we focus on Total Launch Time (TLT) which we define as the base launch time plus completion of asynchronous launch operations. Figure 2 also shows the TLT of several first-party apps: Email, People (a Facebook and Twitter news reader), Maps and Weather. The TLT range is 5-11 seconds. Slow launch times paired with brief usage durations are a troubling combination. It suggests that users are experiencing far too much overhead waiting for their apps to launch rather than engaging their apps. Fortunately, as §4 will show, our data-driven exploration indicates that user
3.
SYSTEM OVERVIEW
FALCON offers an architecture in which to systematically observe and utilize context and execute predictive app launch actions. Figure 3 shows the FALCON system architecture. The central component is the launch predictor. Its role is to use context signals to predict app launches. The launch predictor’s feature extractors convert raw data from context sources into features for the decision engine and model trainer. The decision engine performs inference to determine which features to use and what applications to prelaunch. The prediction is then passed on to the dispatcher, which loads apps into memory and executes the prelaunch routine of the selected app(s). The model trainer records observed features in order to periodically train and update the decision engine and feature extractors with new parametrizations.2 Note that training occurs infrequently and is only critical when access patterns change significantly, whereas inference occurs frequently and is required whenever a launch prediction is made. The process tracker handles communication with the kernel’s memory manager in order to ensure that the decision engine’s view of the apps running on the system is in sync with what is actually running. Supporting the launch predictor, the context source manager is a lifecycle manager and container for various context sources. It also helps shepherd raw data from individual context sources to the launch predictor. A benefit of the FALCON architecture is its modularity. We have been able to use several context sources (location, time, ambient light level, accelerometer and gyroscope), and three separate decision engines within the architecture. In the following sections of this paper, we focus on the instantiation of the FALCON architecture which we found most suitable for launch prediction.
4.
LAUNCH PREDICTOR DESIGN
The Launch Predictor is a machine learner with several feature extractors and a decision engine. This section first discusses the important features we identified, and then de2
Unlike standard features, ours involve some training.
feature ft fdt fλ fdt,λ fT oD fβ
description triggers dynamic triggers location cluster dynamic triggers per location time of day burst behavior indicator
Table 1: Feature Summary session Time
trigger
Figure 5: App usage is correlated with location.
Figure 4: During this 2 hour timeline, SMS (in red) triggers other follower apps (in green). Arrows indicate start of triggered sessions. scribes a novel cost-benefit learner and decision engine wellsuited to launch prediction.
4.1 Personalized Features Our primary objective for feature design is to identify a set of features that give strong insight into the next app to launch and that are very inexpensive to compute at inference time. As is typical of feature design, we take a datadriven approach. This investigation is heavily guided by our data exploration of the LiveLab and internal user studies. For each feature, we present a motivating vignette uncovered from the traces, followed by a formal definition of the feature. Table 1 summarizes the features considered.
4.1.1
Triggers and Followers
A novel feature in FALCON is session triggers and followers. Our data analysis reveals that once the user starts using the phone – for example to answer a phone call or view an SMS message – they have a tendency to open a sequence of other applications within relatively short durations of each other. We refer to such a sequence of application launches as a session. The data traces reveal that certain apps are more likely than others to be the trigger apps that start sessions, whereas other apps are more likely to be follower apps that are used in the same session as the trigger apps. Figure 4 shows a two hour extract of one user’s trace. During this time SMS was the trigger for four separate sessions. Analysis of aggregate user behavior revealed that SMS, Phone, Email, Facebook, and Web Browser are among the most popular triggers across all users. This is intuitive since trigger apps are ones that grab the users’ attention (e.g. SMS and Phone) or satisfy immediate information needs (e.g. Browser). Let ft denote a trigger feature. Intuitively, the trigger features identify the occurrence of a trigger app weighted with the likelihood of a follower app. For random variable follower app F , trigger app T , and candidate launch app α, the trigger feature is calculated as follows. ft = Pr(F = α | T ∈ τt ) I(τt ) where τt is a set of triggers, for example {SM S, P hone}, and I(x) is an indicator function that is 1 if (any member of) x is observed, and 0 otherwise. The term
Pr(F = α | T ∈ τst ) expresses the probability that the follower app is the candidate launch app α given that the trigger app is one of SMS or Phone. Note that probabilities are based on the data distribution observed during training. Interestingly, we found that the best triggers were different for different applications, even for a single individual. For example, the best three triggers for Email are different from those for AngryBirds. There is also significant variability across users — a heavy user of games might have a game as a trigger whereas others may not. These differences lead us to propose dynamic triggers that are calculated on a perlaunch-candidate basis as the set of top-k triggers most likely to lead to the launch candidate as a follower. τˆk = argmax Pr(F = α | T ∈ τk ) τk
fdt,k = Pr(F = α | T ∈ τˆk ) I(ˆ τk ) where τˆk represents the k best triggers for α. §4.2 discusses the procedure for choosing k to arrive at a fixed set of dynamic triggers per app fdt .
4.1.2
Location Clustering
Empirical observations suggest that location is correlated with app usage. Figure 5 illustrates the effect of location on app usage for a brief two week time window for a representative user from our internal user study. For this user, there is a surprisingly strong tendency for game usage at home, Browser and Calendar usage at work, and Twitter usage at a frequently visited shopping center.3 The location feature fλ is computed by assigning the user’s current location to the nearest neighbor cluster. fλ = argmin DIST(λ, lc ) c∈Clusters
where λ is the current location and lc is the central location of cluster c. Clusters are computed from the user’s historical data during the training phase. The literature offers many geospatial clustering algorithms [11], and after experimenting with several, we chose k-means clustering which incurs low computation cost while performing comparably to the others. We can use location in conjunction with triggers as a joint feature fdt,λ . For each location, we compute the best set of 3 The labels Home, Office and Shop are educated guesses according to the recorded geocoordinates.
Figure 6: This particular user launched the app Angry Birds frequently from mid-Jan to mid-Feb only. Both yearly and monthly timelines are shown. dynamic triggers as follows. τˆλ,k = argmax Pr(F = α | T ∈ τλ,k , L = λ) τλ,k
fdt,λ,k = Pr(F = α | T ∈ τˆλ,k , L = λ) I(ˆ τλ,k ) I(λ) This feature captures dynamic trigger variation across locations.
4.1.3
Temporal Bursts
We also find that a user’s app usage changes significantly over longer time scales. Figure 6 illustrates an app, Angry Birds, becoming popular during a month-long period, then ceasing to be used at all afterward. Perhaps not surprisingly, this behavior turns out to be very common for games and entertainment apps. However, our data analysis reveals that such burst usage behavior is dependent on the type of application, for example, games have shorter but more intense bursts in comparison with other applications. Therefore, a key challenge is to determine the frequency and duration of these bursts for each application in an efficient manner. To address this issue, we develop a novel burst predictor. The burst predictor uses multiple sliding windows, each of a different resolution, to detect and react to sudden upticks in app usage. Each app has its own burst predictor to track its bursty behavior. As a basis for our burst predictor, we use a wavelet-based burst detection algorithm [15] as a subprocedure. Given a stream of data, the detector’s goal is to find all windows of any length during which the aggregate statistic of the window exceeds a threshold. In our instantiation, this corresponds to detecting any sequence of days during which an app is launched more than a threshold per day on average. We currently set the threshold to one. The wavelet detector uses a unique modified wavelet data structure in order to bound the computational complexity of detection by O(n) where n is the number of days, whereas the brute force solution is O(n2 ). The output is an indicator for each window wi,j where i indicates the offset from the start of the stream and j indicates the length of the window. Let bi,j be a burst indicator which corresponds to a sliding window starting from day i of length j days. bi,j is true if the corresponding sliding window is a burst, and false otherwise. Provided the burst detector, our burst predictor must decide whether the next time step is part of a burst or not. To make the decision, our predictor measures the predictive power of each burst window size j in being able to successfully predict whether the app is used in the day following the window. Let wj represent the predictive power of window size j.
wj =
1 n−j
n X i
[bi,j bi+j,1 + (1 − bi,j )(1 − bi+j,1 )]
Figure 7: Time of day is correlated with app usage. By analyzing historical data, we can now determine the best window size as the one with the highest score, and use it to detect a burst. This window size can be used to compute fb , which is set to 1 if we are currently within a burst window and 0 otherwise. ˆj = argmax(wj ) j
fβ = bn−ˆj,ˆj Time of Day Feature: Besides multi-day temporal bursts, app usage likelihood changes throughout the day as well. Figure 7 illustrates this for a typical user in our internal user study. A simple Time of Day (ToD) feature fT oD represents the time of the day, segmented by hour. Our experiments with finer and coarser granularities did not yield much difference.
4.1.4
Additional Context Signals
We also built context sources mapping to accelerometer, gyroscope and ambient light level sensors. These proved sufficiently straightforward to incorporate into the FALCON architecture. However, we do not yet have sufficient user trace data to analyze their effectiveness at predicting app launches.
4.1.5
Multi-feature Decision Engine
The different features that we have described can be used as the core inputs of a decision engine that makes application prelaunch decisions. Once training phase has provided the trigger features location clusters, and burst predictions, the decision engine can decide whether or not to launch an application α when a trigger T is met. The decision procedure takes three steps. 1. fβ is checked to see whether a burst of α is underway. 2. fλ is checked to see whether the current location suggests use of α. 3. fdt,λ is checked to see whether a trigger for α started the current session. The three steps are executed in a sequential order. The launch decision for α can be summarized as follows. � true if fβ fλ fdt,λ > 0 decision(α) = f alse else
Our description of the decision engine, however, has a major omission — it does not take into account the actual cost and benefit of a correct preload versus an incorrect preload. In the following section, we describe how we can incorporate these cost-benefit considerations into our decision engine.
4.2 Cost-Benefit Learner The Cost-Benefit Learner (CBL) combines the output of the decision engine for each application together with knowledge of the cost-benefit tradeoffs of launching the application to decide whether to preload an application. We first provide an intuition for how the CBL operates before launching into the specifics of its mechanics and the details of the costbenefit trade-off.
4.2.1
CBL Overview
To decide whether to prelaunch or not, CBL takes three steps: First, it computes the precision and recall metrics for an application from the decision engine (§4.1.5). Second, it converts the precision and recall number to cost and benefit. Third, it determines the best followers for each trigger by maximizing benefit for a fixed cost budget. Precision and Recall: The precision and recall for a trigger and follower pair {T, F } at location cluster λ are defined from observed user data as follows. launches of F after T at λ sessions with trigger T at λ launches of F after T at λ recall(T, F, λ) = sessions with follower F at λ
precision(T, F, λ) =
Cost and Benefit: We measured the energy cost and loading time of all apps apriori. We can use the measurement results to determine the cost and benefit of prelaunching by combining the precision and recall results. Precision describes the expected number of prelaunchs that leads to an actual usage. Multiplying by energy cost of a prelaunch, we can derive the energy cost of a prelaunch that leads to an actual usage. Recall describes the probability that a follower is preloaded. Multiplying by the launch time of the follower, we can derive the loading time benefit of a prelaunch across all launches. We will quantitatively analyze the cost and benefit in the next section. Trading-off cost and benefit: We assume that the CBL is provided a daily energy budget. The energy budget is a predefined percentage of the total battery capacity that the CBL engine can use for its prelaunches within a day. (For example, the CBL may only be able to use 1% of the battery each day across all prelaunches.) Given this constraint, the goal of the CBL is to pick, for a given user, the best set of followers to prelaunch. Intuitively, we should prelaunch the items that have least energy cost and highest loading time benefit. The goal of our optimization framework is to choose the best option given the energy budget.
4.2.2
CBL Optimization Framework
We first describe the optimization procedure which runs during training. For ease of exposition, we cover the CBL’s method for finding dynamic triggers on a per location- and per app-basis. In our implementation, the technique is extended in the straightforward way to additionally include time-of-day.
Let cα and bα represent the energy cost and latency reduction benefit respectively for a single prelaunch of α. Then the expected cost c′ and benefit b′ of selecting to prelaunch α for all encounters of t and λ is calculated as follows. b′t,λ,α = bα × recall(t, α, λ) c′t,λ,α = cα × (1 − precision(t, α, λ)) Note that while the benefit b′ is scaled by the proportion of triggers leading to the follower, the cost c′ is scaled by the proportion of triggers not leading to the follower. This is because mistaken predictions incur a cost cα whereas energy for correct predictions can be accounted toward the user’s actual launch. We map our formulation to the 0-1 Knapsack problem to model the cost and benefit trade-off. Consider all tuples < t, λ, α > as candidates for the Knapsack. The predefined energy budget corresponds to the max allowable Knapsack weight, the expected reduced launch time b′t,λ,α corresponds to the benefit of inclusion in the Knapsack, and the expected energy cost c′t,λ,α corresponds to the weight in the Knapsack. It is a 0-1 Knapsack since a tuple can be included or excluded in its entirety. The 0-1 Knapsack model for the cost-benefit trade-off is formulated as follows. X ′ maximize bt,λ,α I(< t, λ, α >) t,λ,α
subject to
X
c′t,λ,α I(< t, λ, α >) ≤ W
t,λ,α
As before, the function I() is either zero or one, indicating whether or not to include the tuple < t, λ, α >. W is the energy budget. One possibility to solve the Knapsack problem is with dynamic programming. However, a dynamic programming solution requires pseudo-polynomial time. Instead, we use a standard greedy approximation to solve the Knapsack problem. The greedy approximation sorts the tuples in decreasing order of their benefit per unit of cost. It then proceeds to pick the tuples according to the ranked order, starting with the top-ranked one, until the energy budget is reached. The output of the greedy approximation is K, a list of tuples sorted by benefit per unit cost within the energy budget. The final step of the optimization updates the dynamic trigger feature fdt,λ to use the appropriate top-k triggers. Recall from §4.1.1 that for a given α, the value of k is used by τˆλ,k for the feature fdt,λ,k . k is set according to the number of appearances of α in K. The decision engine, which looks at fdt,λ,k for the chosen k, performs inference in time linear to the length of K. Dynamic Energy Constraints There are several ways to define an energy budget for the Knapsack optimization framework. For example, one could budget a fixed percentage of the battery per day, pick a percentage of the current battery level or have an finer-grained budget at an hourly level. While our optimization can work with different definitions of the energy budget, we use the representative example of a budget that is chosen based on the residual energy. The Knapsack model is adapted to the dynamic energy constraint W ′ as follows. W ′ = (W − U )θ where U is the energy consumed so far by prelaunching,
and θ is a tuning parameter in the range (0, 1] that can be chosen to discourage aggressive prelaunching when energy is abundant. We currently set θ = 1. Note that meeting the dynamic budget constraint does not require recomputation of Knapsack. Instead, we maintain a pointer to the position in K which represents the dynamic energy budget cutoff. Eviction Policy: Most phone OSs use an LRU policy for app eviction.4 While the CBL is primarily used for launch prediction, the sorted tuple list K is also used to evict the app least likely to be used. As part of launch prediction, apps already resident in memory are assigned very low cost scores. Nonetheless, such an app may still be evicted due to its meager benefit b′ according to the current trigger t and location λ. This conveniently integrates launch prediction with eviction policies. Server-based Training If the user app launch behavior changes (e.g. a new location is visited or a new app is installed), retraining is recommended. Even though the greedy Knapsack approximation is efficient, training involves scanning through all the logged context data. Therefore, we offload training to a server. We currently initiate retraining manually. The log with data records since the last training are sent to the server, and new parameters are sent back to the phone. Memory Constraints In the preceding discussion, we treated all preloads equally in terms of memory cost. The FALCON implementation and its associated evaluation also make this simplifying assumption. In practice, apps vary in memory usage. A logical extension of our Knapsack model can handle multiple-constraints where both energy and memory are treated as constraints.
Figure 8: FALCON ambient display widget is shown at the top of the home screen. Current predictions are Monopoly, FindSomeone and Music+Video.
Tombstoned apps, the OS retains some minimal tombstones of bookkeeping information, such as the last page of the app the user was on. In very low memory conditions, even tombstones may be dropped. To limit battery drain, background apps are only permitted 15 seconds of CPU time every 30 minutes.
5.2 5. IMPLEMENTATION We have implemented FALCON as an OS modification to Windows Phone (WP) 7.5. We first discuss the elements of WP’s app model relevant to our implementation before describing the implementation details.
5.1 Background on Windows Phone Apps WP apps are similar to webapps in organization. Each app is collection of pages with links pointing across pages. An app is referenced by its unique ID (UID), and a page within an app is referenced by its page name. Pages can take arguments as parameters. The following is an example of these elements: app:///ShowContactInfo?id=8. Each app has a default page Default that is loaded at startup. Apps can also support multiple entry points by supporting “deep links” to specific pages. For example, the standard Address Book app supports pinning of contact cards to the home screen via deep linking. Links are not functional crossapp; WP enforces strict app isolation. The WP app lifecycle consists of four states: Not Launched, Active, Deactivated and Tombstoned. Apps transition from Not Launched to Active when tapped from the home screen, and from Active to Deactivated whenthe user navigates away to the home screen or another app. An app undergoing deactivation has a 10 second grace period to perform cleanup activity before receiving no further cycles. A deactivated app is still resident in memory until it is evicted by the memory manager which then changes its state to Tombstoned. For 4
Without paging, apps are evicted in their entirety.
Implementation Description
FALCON is implemented in three parts. The first is an OS service. The second is a new application event upcall. The third is an ambient display widget. The FALCON OS services is a privileged daemon written in native code. As such, it has access to the registry, a persistent structured datastore, and can call privileged library and system calls. For example, starting a new process is a privileged call. FALCON replaces a subset of the standard policies of the system’s memory manager and scheduler with its prelaunch decisions. The service manages a thread for each context source. Currently, three context sources are used corresponding to the features described in §4.1. Context sources post updates at different rates, depending upon the rate of change of the underlying signal. In order to support variable update rates, the main service shares a model data structure with each source and the launch predictor. Each source independently updates the model with observations for the context for which it is responsible. The launch predictor uses the model’s observations in its inference process. The launch predictor is executed whenever one of several defined events occurs: (1) the phone receives an SMS or phone call, (2) the user unlocks the phone, or (3) the user launches a trigger app. These events already activate the phone’s application processor from a low to high energy state so it is inexpensive to piggyback the launch predictor execution. Upon generating an inference, the launch predictor passes the candidate app(s) to the dispatcher, which vectors the launch signal through the appropriate prelaunch event up-
call. For third party apps which are written in managed C#, this process involves translating native calls to managed code calls. Apps implement the event handler as a custom page named Prelaunch, e.g. app:///Prelaunch. The dispatcher jumps directly to the Prelaunch deep link. An app can implement any custom prelaunch logic in its Prelaunch page. For example, our modified Email app fetches new emails during prelaunch, and our modified game loads the last level the user played during prelaunch. In general, network content fetch or local storage load operations are good candidates for Prelaunch. For apps that do not implement the Prelaunch link, the dispatcher opens its Default page instead. This is sufficient for us to reduce launch time for many apps without requiring app modification. In WP, pages are meant to show a display to the user, which is not appropriate for prelaunching. Once the dispatcher opens an app to either the Prelaunch or Default page, it immediately deactivates it. With the existing WP deactivation grace period, this gives the app an opportunity to complete its app-specific prelaunch operation. For prelaunch deactivation, the grace period is modified to 25 seconds, which is high enough to cover the total app launch times of most apps. The deactivation event also gives apps an opportunity to adjust for any side-effects (e.g. unregistering server state) that the Default page may have initiated. Conveniently, developers already implement the deactivation event as part of the regular app lifecycle management protocol. Lastly, FALCON includes an ambient display widget using the WP live tiles mechanism. Live tiles are simply home screen icons that can be updated programmatically. Figure 8 shows a screenshot of the FALCON widget. The launch predictor updates the live tile to show the highest likelihood candidate apps.
6. EVALUATION In this section, we evaluate the performance of FALCON through extensive data analysis as well as measurements of our prototyped system implementation.
6.1 Dataset The primary dataset in our analysis is the Rice LiveLab user study [14]. In this study, thirty four volunteers were given iPhone 3GSs for a period of up to fourteen months. We use two traces from the LiveLab users study: the app usage trace which records the start time and duration of every app usage, and the location trace which records the user’s location with an interval of five minutes when GPS is available. By joining the app usage table and location table, we have a trace of the time and location information corresponding to each app usage. Note that since location is obtained at a relatively coarse granularity compared to app usage data, there are several instances where we do not have data at precisely the times that an app was used. To address this, we interpolate location points using a nearest neighbor method. In total, the interpolated trace of time and location information contains over 400 thousand samples across fourteen months. The majority of our evaluation is conducted based on the LiveLab dataset, except for microbenchmarks which are measured on the Windows Phone platform.
6.2
Microbenchmarks
Before measuring the performance of FALCON, we first benchmark three critical parameters for each app: a) the time taken for launching an app, b) the amount of energy consumed during app launch, and c) the memory consumed by the app at launch time. Note that we focus on these parameters at launch time as opposed to how they vary during app usage. Our measurements are conducted on an LG Mazza phone running Windows Phone 7.5. We measured the top twenty most popular apps in the Windows Phone Marketplace, as well as the first party apps that are preinstalled on the phone, including People, Email, and Maps. Figure 9(a) shows the CDF of app launch time with and without prelaunching. The launch time includes both the OS loading time and network fetch time. The network fetch time is the average over a number of measurements under a good WiFi connection, which is an optimistic estimate since a cellular data connection is likely to be slower. Without preloading, half of the apps require more than 10 seconds to be fully launched, and around 10% of apps have a launch time of more than 20 seconds. With preloading, the app launch time can be reduced dramatically to close to zero. Figure 9(b) shows the CDF of energy cost to launch an app. The energy cost as measured with a Monsoon power meter ranges from 500 to 2500 µAh, with a median energy consumption of 750 µAh. For reference, a typical LiOn battery on a mobile phone has a capacity of 1500 mAh, therefore the energy cost ranges from 0.03% to 0.17% of the battery capacity for a single launch. Clearly, when app usage is high, the total energy cost of launching applications can be a significant fraction of the overall budget. A benefit of FALCON is that we can cap the total amount of energy for preloading to ensure that its effect on battery life is bounded. Figure 9(c) shows the CDF of memory cost for launching an app. The memory consumption varies from 10 MB to 90 MB, with a median memory consumption of 30MB. This is a significant fraction of available memory on smartphones, which typically have memory capacity between a few tens to hundreds of MB. (Our latest WP phone has about 150MB available for user apps.)
6.3
Benefits of Individual Features
At the core of FALCON are three features: session triggers and followers, temporal bursts, and location clusters. We now look at the benefits of using each of these features in isolation.
6.3.1
Session Triggers and Followers
Our goal in this section is to understand trigger and follower behavior across different users and applications. Specifically, we ask three questions: a) what applications are the best triggers across different users, b) are there differences between individuals in their trigger and follower behavior, and c) for a single user, are there differences in triggers for different follower apps? Figure 10(a) shows the top 5 session triggers across all users. Not surprisingly, this list includes Email, Facebook and Safari — all popular apps. What is surprising, however, is that SMS and Phone calls are excellent triggers as well. In other words, receiving an SMS or a phone call creates an interruption into an individual’s routine, and once inter-
0.6 0.4 NO-OP Preloading
0 0
5
10
15
20
25
Cumulative Probability
0.8
0.2
1
Cumulative Probability
Cumulative Probability
1
0.8 0.6 0.4 0.2 NO-OP
0
30
0
Loading Time (seconds)
1000
2000
1 0.8 0.6 0.4 0.2
3000
NO-OP
0 0
Energy Consumption (uAh)
(a) CDF of launch time
15
30
45
60
75
90
Memory Consumption (MB)
(b) CDF of energy consumption
(c) CDF of memory consumption
(a) Top 5 triggers across all users.
(b) Top 5 triggers for a specific user.
Safari
Prefer
CyaniAH
0.4 0.35 0.3 0.25 0.2 0.15 0.1 0.05 0
SMS
0
Safari
0.05 Phone
Safari
Phone
Facebook
0
Email
0.05
0.1
Email
0.1
SMS
0.15
0.2 0.15
WordsWF
Probability Density
0.2
Probability Density
0.25
SMS
Probability Density
0.3 0.25
Phone
Figure 9: Microbenchmark of launch time, energy cost, and memory cost. Apps measured include the top 20 most popular ones in Windows Phone Marketplace, and preinstalled first party apps.
(c) Top 5 triggers for “Angry Birds”.
Figure 10: Different set of session triggers for (a) aggregation across multiple users, (b) a specific user, and (c) a specific app across different users. Y-axis shows the probability that each app acts as a trigger. App name abbreviations in the graphs are: “WordsWF” = “WordsWithFriendsFree,”“CyaniAH” = “CyanideAndHappiness.”
6.3.2
1 0.9
Cumulative Probability
rupted the users tend to use other applications before they close the phone. Figure 10(b) shows the top 5 triggers across all users are not necessarily the best triggers for an individual. This graph shows the best triggers for a user who is heavy user of games — in this case, the best trigger is in fact the WordsWithFriends game. This indicates that personalization is needed for the user, and we cannot assume that triggers are the same across everyone. To understand if different apps have different triggers, we look at the triggers for a specific application across all users. We choose Angry Birds as our target app in this evaluation since it is very popular across multiple users and its loading time is representative for games. Figure 10(c) shows that triggers for AngryBirds are also different from those across all applications, suggesting that triggers should be chosen differently for each application. To conclude, this evaluation shows that triggers need to be both user- and app-specific, and it makes the case for dynamic personalized triggers that we will evaluate in §6.4.2.
0.8 0.7 0.6 0.5 0.4 0.3 0.2
All Apps Games First-party Apps
0.1 0 1
30
60
90
120
150
180
Number of Days in Burst Window Figure 11: CDF of number of days that involve bursty usage for each application. 80% of games have less than 30 bursty days over 14 months usage.
Temporal Bursts
We now turn to evaluate the performance of the temporal feature, namely bursty app usage. Temporal bursts can be an effective feature for improving prelaunch accuracy since it indicates when an application is heavily used during a relatively short window of time, such as a span of several days. Our evaluation looks at which applications are likely to be
used in a bursty manner and which are not. Intuitively, one would expect that games are likely to be used in a bursty manner whereas First-party apps such as Email or People (WP Facebook client) should have a more steady usage pattern. Therefore, we explore the burstiness for three cate-
6.3.3
1 0.9 0.8 0.7 0.6 0.5 0.4 0.3 0.2 0.1 0
0.8 0.7 0.6 0.5 0.4 0.3 0.2
Location Only Burst Only Location+Burst
0.1 0
Location Clusters
0
After temporal burst feature, we now look at the performance of location clusters. Similar with temporal features, we look for applications that are heavily used within certain location clusters to improve prelaunch accuracy. We evaluate the distribution of number of location clusters per application (determined via k-means clustering). We use the same categories as the previous section — All applications, Games, and First-party apps. Our intuition is that games tend to be used in fewer locations than other apps. Figure 12 shows the CDF of number of clusters where each app category is used. From this graph, we can see that games have a higher locality than other apps — 90% of game apps are used in less than 25 clusters, and more than half of games are used in less than 10 clusters. Thus, we conclude that location clustering is also a discriminating feature, particularly for games.
Cumulative Probability
1 0.9
Cumulative Probability
gories of apps — All applications, Games, and First-party apps. Figure 11 shows the CDF of number of bursty days for each app category. Each point in this graph corresponds to a {user, app} pair. From this graph, we can conclude that games have stronger bursty behavior than apps such as Email and Facebook. Around 80% of games are used within 30 days out of 14 months trace length, while only 20% of the first party apps are used within the same time frame. This observation suggests that bursty behavior is a discriminating feature that we can exploit to improve the prelaunching performance, especially for games.
1 10 20 30 40 50 Number of Clusters Where Apps Are Used Figure 12: CDF of number of location clusters per app. Over 50% of games are used within less than ten clusters.
6.4 Combining Features We now look at the benefits of combining the features of temporal burst and location clusters on prediction accuracy. Our evaluation consists of two steps. First, we look at how adding temporal features and location clusters improves accuracy when the set of triggers are fixed across all users and apps. Second, we evaluate the benefits of making the triggers dynamic, in which case triggers can be modified within a cluster and burst window based on the individual and target application for each user.
20
30
40
50
Number of Preloads Figure 13: Benefit of location and temporal burst features, measured in terms of number of preloads per correct usage.
6.4.1
Benefits of location + temporal features
In this experiment, we look at the benefits of combining location and temporal features. We fix trigger apps to include the most common triggers across users, Phone, SMS, and Safari. We then explore the benefit of using only location clusters, only temporal bursts, and finally a combination of the two for each follower app. For each setting, we look at improvement in prelaunch accuracy, specifically, the number of preloads per app usage for each user. Figure 13 shows the CDF of number of preloads across all users. Note that all curves have the same set of triggers. As seen from the figure, location clustering by itself performs poorly — the median number of preloads that lead to an actual app usage is around 27. If we use only temporal bursts, the median preload number is reduced to only six. Combining the two features gives even better performance — median number of preloads reduces to around five.
6.4.2 All Apps Games First-party Apps
10
Benefits of dynamic triggers
While combining location and temporal features improves preload accuracy, it still incurs the cost of several preloads per app usage. We now look at how dynamic triggers improve performance over static triggers. This experiment evaluates improvement in precision and recall by personalizing triggers for each user based on both location and temporal burst contexts. We focus on “Angry Birds”, a popular game that provides a representative example of an application that exhibits both location and spatial selectivity. We compare the precision and recall of preloading under three trigger settings: static triggers for all users and location clusters, dynamic triggers for each user but the same for all location clusters, and dynamic triggers for each user at each location clusters. Figure 14(a) and Figure 14(b) shows the precision and recall for two different users when the follower app is AngryBirds. For both users, dynamic triggers for each location cluster achieves the best precision and recall, and clearly provides dramatic improvements over the other two cases. In addition, the performance of dynamic triggers for each location cluster is also stable for different users, while the performance of the other two schemes varies significantly for different users. This observation clearly in-
1
1
Dynamic trigger w/ cluster Dynamic trigger w/o cluster Static trigger
0.9 0.8
0.8 0.7
Precision
0.7
Precision
Dynamic trigger w/ cluster Dynamic trigger w/o cluster Static trigger
0.9
0.6 0.5 0.4
0.6 0.5 0.4
0.3
0.3
0.2
0.2
0.1
0.1
0
0 0
0.1 0.2 0.3 0.4 0.5 0.6 0.7 0.8 0.9
1
0
Recall
0.1 0.2 0.3 0.4 0.5 0.6 0.7 0.8 0.9
1
Recall
(a) User 1
(b) User 2
Figure 14: Precision and recall of prelaunching a follower app for two individual users under static and dynamic trigger settings. In this graph, “Angry Birds” is used as a representative follower app that exhibits both temporal and spatial selectivity. dicates that we should use dynamic personalization of triggers at the location cluster level.
6.5 Evaluation of cost-benefit learner Having comprehensively evaluated how features can enable better preloading, we turn to evaluate the performance of Cost-Benefit Learner (CBL). Our cost-benefit analysis includes information about the cost of a preload in terms of energy, and the benefits of the preload in terms of app loading latency, or in the case of network prefetching, in terms of the freshness of fetched data. We use the energy/latency benchmarks from §6.2 in this evaluation. We assume for simplicity that each app has equal memory consumption. 1
Cumulative Probability
0.9
6.5.2
0.8 0.7 0.6 0.5 0.4 0.3 0.2
Email w/o Prefetching Email w/ Pulling Email w/ Prefetching
0.1 0 1s
30s
5m
30m
1d
Freshness (minutes) Figure 15: Benefit of prelaunching for app freshness. Email is used as a representative application that is both heavily used and has high network content fetch time.
6.5.1
both heavily used and incurs significant delay for fetching emails from servers. First, we compare CBL (noted as Email w/ Prefetching) against two baseline schemes: a) no prefetching (noted as Email w/o Prefetching), and b) active pull with an interval of 30 minutes(noted as Email Pulling). Our evaluation metric is freshness of the app, which is defined as the time that elapses between retrieval of content from the server and when the app is opened by the user. Figure 15 shows the freshness of rhe Email app using our scheme (note that the x-axis is in log scale). Compared with no prefetching, we improve freshness significantly by reducing the median freshness from 30 minutes to around 3 minutes. Our scheme also outperforms the pulling-based scheme, whose median freshness is about 10 minutes.
Performance of Prefetching
In this experiment, we look at the benefit for apps that require fetching new content during the launch process. We take the Email application as a representative app, which is
Performance of Preloading
In this experiment, we look at how app loading time can be improved by our CBL learner. We compare our scheme against LRU caching, which is the standard policy on most smartphones including Windows Phone. In this experiment, we select 24 popular apps (including games, social apps, and First-party apps) as follower to cover the most common app usage cases on WP platform. We assume that the memory manager allows up to five apps, as is the case on the current Windows Phone platform. We also assume that every app has equal memory consumption. While both CBL and LRU take advantages of bursty behavior of apps, there is a subtle but important difference in the way FALCON vs. LRU work for bursty apps. It might seem like LRU would work well when apps are bursty, but the burstiness of apps (e.g. games) is at the timescale of days, not minutes. In other words, a “bursty game” might be used once or twice a day. LRU is designed to work well when burstiness is at short timescales, where apps are so frequently used that they are not evicted. CBL is able to take advantage of burstiness at the timescale of days because we are looking at longer term contextual and session behavior. Our CBL outperforms LRU by up to 100% in terms of loading time. Figure 16 shows the median loading time is around 1 second and 2 seconds for CBL and LRU, respec-
Binary Size Memory (stable state) Processor utilization (stable state) Processor utilization per prediction Energy cost per prediction
1
Cumulative Probability
0.9 0.8 0.7 0.6 0.5
Table 2: FALCON Overhead Profile
0.4 0.3
energy cost of less than 1% battery power, and less than 6 seconds with 2% battery power.
CBL w/ all apps LRU w/ all apps CBL w/ Games LRU w/ Games
0.2 0.1 0 0
3
5
6.6
10
15
Loading Time (seconds) Figure 16: Benefit of loading time with prefetching. CBL is compared against LRU, both when all applications are used, and when only games are used. We look at games separately since these apps exhibit both temporal burstiness and spatially correlated usage patterns.
Time Benefit per Load (Seconds)
tively. Even when LRU already performs well in terms of loading time, our scheme still improves the loading time by half. For games, the median loading time is also reduced from 9 seconds with LRU, to 6 second with CBL. Quartiles Mean
14 12 10 8 6 4 2 0 0.5
1
1.5
2
2.5
Energy Budget (as % of battery capacity) Figure 17: Energy cost and launching time benefit of using the combination of dynamic triggers, temporal bursts, and location clustering for prelaunch.
6.5.3
129 KB 1840 KB