It is well known that the number of cells in the kth-order Voronoi diagram of n .... will become saturated by exactly the top k tangent planes at every pixel, and will ... according to their depth value prior to rendering, but this is meaningless for ...
Fast Approximation of High Order Voronoi Diagrams and Distance Transforms on the GPU Ian Fischer and Craig Gotsman Computer Science Department Harvard University
Abstract We present a graphics hardware implementation of the tangent-plane algorithm for computing the kth-order Voronoi diagram of a set of point sites in image space. Correct and efficient implementation of this algorithm using graphics hardware is possible only with the use of an appropriate shader program on the GPU. This is achieved by rendering in k passes the parallel projection of the top k levels of an arrangement of planes tangent to the paraboloid z = x2+y2. Each level of the arrangement corresponds to the so-called kth-nearest point diagram, which is interesting in its own right. Composition of the images of the k top levels results in the kth-order Voronoi diagram. The diagram facilitates efficient computation of the k nearest neighbors of an arbitrary query point. We describe our implementation of the algorithm in OpenGL and Cg, and several optimizations. We also show how to efficiently compute the distance transform of the given sites using the GPU, based on the first-order Voronoi diagram. Keywords: Voronoi diagram, distance transform, GPU algorithm
1. Introduction The Voronoi Diagram First-order Voronoi diagrams are defined on a set of geometric entities, called sites, in Rn. The diagram is a partition of Rn into regions of points that are closer to one site than to any other site. The most intuitive case is point sites in two dimensions. In this case the regions are convex polygons (sometimes called cells), some unbounded. More formally, a first-order Voronoi diagram V is defined on a set of sites S = {s1, s2, .., sn} in R2 by mapping each point in the plane to the site closest to it. All points mapped to si form the Voronoi cell V(i):
V (i ) = {x ∈ R 2 : si − x ≤ s j − x , ∀j ≠ i} . An example of a first-order Voronoi diagram in the Euclidean plane can be seen in Figure 1. There are many possible generalizations of planar Voronoi diagrams. Firstly, non-point sites can be used, e.g. lines, curves, and polygons in two dimensions. In the case of non-point sites, the Voronoi cell boundaries become curved. Secondly, higher-dimensional space can be used. The Voronoi cells are convex polyhedra for point sites in 3D. Thirdly, non-Euclidean distance functions can be used, or the sites can be weighted. Finally, the diagram itself can be generalized to higher orders – measuring proximity to more than a single site. Thus, a first-order diagram describes the regions closest to each individual site, a second-order diagram describes the regions closest to an (unordered) pair of sites, and so on. Formally, the kth-order Voronoi diagram V is defined on a set of sites S = {s1, s2, .., sn}, with n ≥ k , such that the Voronoi region for a subset of k sites is as follows:
V (i1 , i2 ,.., ik ) = {x : si1 − x + si2 − x + ... + sik − x ≤ s j1 − x + s j2 − x + ... + s jk − x , ∀{i1 , i2 ,.., ik } ≠ { j1 , j2 ,.., jk }}.
1
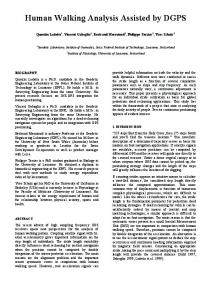
Figure 1: First-order Voronoi diagram of 150 point sites.
It is well known that the number of cells in the kth-order Voronoi diagram of n point sites is O(kn) (Okabe et al 1992), and they are convex polygons. This is despite the fact that there are O(nk) possible subsets of sites of size k, which, by definition should give rise to a cell, but most of these cells are, in fact, empty. An example of a series of kth-order Voronoi diagrams can be seen in Figure 2. One important use of the 2nd-order Voronoi diagram is the computation of the Delaunay triangulation – the dual of the 1st-order Voronoi diagram. It is easy to see that there exists an edge in the Delaunay triangulation between two sites if and only if the cell associated with those two sites in the 2nd-order Voronoi diagram is not empty. The algorithm presented in this paper computes kth-order Voronoi diagrams of point sites in two dimensions. 2
1
123
12
12 34
12 35
23 125 3 15
235
25 35
5
245 34
4
234
12 45
23 45
145 45
345
13 45
Figure 2: Left to right: First, second, third, and fourth-order Voronoi diagrams of five point sites.
The Cone Algorithm In many applications, it is useful to compute discrete approximations of Voronoi diagrams. This involves generating a color image on a square grid of pixels, such that the pixels belonging to the same Voronoi cell are all colored in the same distinct color. Most notable is the work of Hoff et al (1999), which we call the Cone algorithm. This computes the first-order Voronoi diagram of 2D sites using a geometric approximation of the shape of the 3D graph of the appropriate 2D function measuring the distance of a point from a site. Specifically, a point site’s Euclidean distance function is approximated by a discretization of a right-angled cone whose apex is at the site. A line segment’s Euclidean distance function is approximated by two planes extending away from the line at 45 degrees, and the discretization
2
of two right cones at the endpoints of the line segment. The set of colored 3D objects corresponding to the given sites is rendered in parallel projection on the graphics hardware using standard OpenGL programming (which incorporates hidden surface elimination), and the resulting image approximates the Voronoi diagram. The Cone algorithm is fast, and works well on a wide variety of sites, including approximations of curves (the curve is approximated as a sequence of line segments). It is also quite easy to implement, particularly for point sites. However, the Cone algorithm requires generating and processing an amount of geometry that is a function of both n, the number of sites, and m, the resolution of the output image. In order to bound the error due to the discretization of the right-cone, each such cone must consist of a number of 3D polygons proportional to m. Thus, higher resolution images require that more 3D polygons be generated and processed. In this paper we describe the image-space implementation of a well-known, but completely different, algorithm to compute Voronoi diagrams (O’Rourke 2000, Sect 6.6). The algorithm proceeds by rendering and compositing a special collection of intersecting planes, all tangent to the unit paraboloid in 3D. Thus we call this algorithm the Tangent-Plane algorithm. Although a simple algorithm, the limitations of the standard graphics rendering pipeline prevent its implementation in OpenGL, as will be explained later. Fortunately, using a special depth peeling algorithm, we are able to construct a fragment shader, running on the GPU (Graphics Programming Unit), which generates the correct effect. The algorithm generalizes easily to all kth-order Voronoi diagrams, and provides maximal accuracy for point sites, independent of the values of m and n. In addition to the numerous uses of the Voronoi diagram, there has also been a large body of work dedicated to the (non-image space) computation of the Voronoi diagram and its variants. A comprehensive overview of that work may be found in the excellent survey by Aurenhammer (1991) and book by Okabe et al (1992). The best deterministic algorithm for the computation of the kth-order Voronoi diagram of n point sites in the plane is due to Agarwal and Matoušek (1995), and requires O(kn1+ε) time. The interested reader is referred to Chan (2001) for a complete account of the different algorithms, deterministic and randomized. 2. The Tangent-Plane Algorithm In this section, we discuss the concepts used in the design of the Tangent-Plane algorithm, as well as the basic outline of the algorithm itself. The Tangent-Plane algorithm relies on some basic properties of arrangements of planes, as well as a recently developed technique in GPU programming known as depth peeling. Arrangements of the Tangent Planes An arrangement is a set of (d–1)-dimensional hyperplanes in d-dimensional space. Thus, a set of lines in 2D is an arrangement of lines, and a set of planes in 3D is an arrangement of planes. When dealing with arrangements, it is useful to assume that we are working with simple arrangements; namely, no two members of the arrangement are parallel, and no three meet at the same d–2 dimensional hyperplane. The latter means that in 2D no three lines meet at the same point, and in 3D no three planes meet at the same line. Simple arrangements give rise to tight upper bounds on the complexity (the number of vertices, edges, and faces) of all possible arrangements of n hyperplanes, as they are in fact the worst case – adding degeneracies such as parallel hyperplanes only reduces the complexity of an arrangement.
3
Given a horizontal direction, a point on a hyperplane in an arrangement is said to be at level k, if there are at most k−1 hyperplanes vertically above this point and at most n−k hyperplanes below this point. The kth level of an arrangement is the set of points at level k. A specific arrangement of planes in 3D can be used to compute the kth-order planar Voronoi diagram. Consider the paraboloid z = x2+y2. If (a,b) are the coordinates of a point site, the plane whose equation is z = 2ax+2by-(a2+b2) is tangent to the paraboloid at (x,y) = (a,b). The set of all such planes for all sites defines an arrangement of planes that will allow us to construct the kth-order Voronoi diagram of the sites. It is easy to see that this is a simple arrangement of planes. The only way that two planes can be parallel is if the sites that represent them are coincident, which is not consistent with the definition of a set of sites. Likewise, it is impossible for three such planes to intersect at the same line. It is well known (see e.g. (O’Rourke 2000, Sect 6.6)) that the kth-order Voronoi diagram of a set of planar point sites can be constructed using the top k levels of this arrangement of tangent planes. This is easiest to see for a set of point sites in 1D. In this case, the paraboloid becomes the parabola y = x2, and the tangent planes become the tangent lines y = 2ax-a2, where a is the x coordinate of the site. The tangent lines of two adjacent sites at a1 and a2 intersect when 2a1x-a12 = 2a2x-a22, implying that x = (a1+a2)/2 - the cell boundaries are at the midpoint between the two sites - as is expected and evident in Figure 3, which shows the first and second-order 1D Voronoi diagrams of three sites. The Voronoi boundary in the second-order diagram is at the midpoint between the two extreme sites, as all points on the line will be closer to the middle site than to at least one of the other two sites, so the middle site has no influence. viewpoint (at infinity)
Second level of the arrangement.
-1
First level of the arrangement.
1
First-Order Diagram Second-Order Diagram 2
Figure 3: Three tangent lines to the parabola y = x corresponding to three 1D sites. The cell boundaries in the firstorder Voronoi diagram (drawn in the colors of the tangent planes) are the midpoints between adjacent pairs of sites. The cell boundary in the second-order diagram (drawn in yellow and orange) is the midpoint between the two extreme points. These midpoints correspond to the projection of the points of intersection of the respective tangent lines, as shown by the vertical gray lines. The corresponding two levels of the arrangement are also visible. The first level is the set of gray dashed line segments, and the second level is the set of gray dotted line segments.
Returning to 2D, the first-order Voronoi diagram of a set of point sites in the plane can be constructed simply by rendering the view from infinity of the arrangement of tangent planes – in other words, in parallel projection (also known as orthographic projection). Similarly, rendering the top k levels from infinity gives precisely the kth-order Voronoi diagram. By “rendering”, we mean identifying each pixel (using a unique color) with the set of the first k planes intersected by a parallel view ray through it. This idea results in the following simple algorithm for computing the discrete kth-order Voronoi diagram using graphics hardware:
4
for each site construct tangent plane render tangent plane with distinct color in parallel projection with transparency 1/k
By rendering each tangent plane with transparency 1/k, we aim for the situation where the alpha channel will become saturated by exactly the top k tangent planes at every pixel, and will ultimately contain a color which uniquely identifies that subset of planes for that pixel. The other n-k planes will be hidden behind the opaque combination of the top k planes. Unfortunately, this simple algorithm will not work in practice. The problem is that the tangent planes typically penetrate each other, so each pixel will “encounter” the tangent planes in an essentially different order. The only way to guarantee that the correct k planes contribute to the color of the pixel is only if they are encountered in reverse order from the kth distant to the closest. Any other ordering will not produce the correct result, due to the z-buffering. As can be seen from the analogous 2D diagram in Figure 4, the second (blue) line drawn will be displayed incorrectly, because below its intersection with the first (red) line, the first line will be the only thing visible, and will thus be composited against the background color. The most common method for resolving alpha blending problems is to sort the objects in the scene according to their depth value prior to rendering, but this is meaningless for interpenetrating objects such as our tangent planes. It seems that to render them correctly, we must use a technique called “depth peeling”, or “order-independent transparency”, first implemented by Everitt (2001).
Red line drawn first. Blue line drawn second.
Ray from the camera to the frame buffer that draws incorrectly.
Ray from the camera to the frame buffer that draws correctly. This fragment is discarded when processed, because it fails the depth test.
Incorrect values.
Correct values.
Frame buffer. Black background.
Figure 4: Simple compositing of tangent lines fails to produce the correct effect. Consider two tangent lines (red and blue) being rendered at half-transparency against a black background (bottom black line). The red line is drawn first, and the blue line is drawn second. The left side of the diagram is rendered incorrectly – the red line is composited against the black background rather than the blue line, because the blue line is not yet in the frame buffer. When the blue line is drawn, the part of it below the red line is discarded because it fails the depth test (the red line is closer to the camera at that point). The part of the blue line that is above the red line is drawn correctly, however, as the red line is already in the frame buffer, so the compositing works. This is visible on the right side of the diagram, where the color in the frame buffer is yellow, rather than dark red.
5
Depth Peeling Depth peeling is a multi-pass algorithm. At every pass, it “peels” off one level of the arrangement by rendering all the planes, and comparing the current depth against the closest depth found in the previous pass, before writing to the frame buffer. In this way, we end up at pass k with the parts of the tangent planes that comprise the kth level of the arrangement. The peeling requires the use of two depth buffers, one for the previous level’s closest depth, and one for the current level’s closest depth. At each pass except the first, the current depth is compared to the previous depth, and the fragment is maintained only if it is further from the view point than the fragment that passed at the previous level, but closer than all other fragments at that pixel. Since graphics hardware typically does not possess more than one depth buffer, Everitt recommended that shadow mapping hardware function as a second, read-only depth buffer. For further implementations details, see (Everitt 2001). Using the depth peeling technique, we are able to accurately extract the top k levels of the arrangement of tangent planes, which are then composited to generate compute the kth-order Voronoi diagram, as follows: for each site construct tangent plane // k passes for i = 1 to k for each site render tangent plane in parallel projection texture[i] using depth comparison with depth[i-1] // single pass Composite all k textures with transparencies 1/k
to
In k passes, the algorithm generates k texture maps, each containing a level of the arrangement, from the first (top) level to the kth. The kth level is also called the kth-nearest point diagram, to be discussed in the next section. It consists of pixels colored in no more than n distinct colors, one for each site. The n colors should be chosen such that all possible sums of k of them are distinct colors. This problem has been studied extensively in coding theory, and there exist constructions (Bose and Chowla 1962) such that the largest of the n numbers does not exceed O(knk). Summing the k levels will result in the kth-order Voronoi diagram, with a distinct color per cell. In practice we have observed in our experiments that random 8-bit colors per site result in distinct colors per cell, certainly for neighboring cells, which suffices to be able to distinguish between the cells. 3. kth-Nearest Point Diagram The kth-order Voronoi diagram is formed by compositing (summing) the top k levels of the arrangement of tangent planes, as discussed in the previous section. Each of these levels forms the so-called kth-nearest point diagrams, which are of interest independent of the kth-order Voronoi diagram.
6
Figure 5: (Left to right) First through fifth-nearest point diagrams of the five point sites of Fig. 2. The blue cells correspond to the same site. Note how this cell evolves.
The kth-nearest region associated with a given site is the set of points in the plane such that the site ranks number k in the ordering of the sites by distance from the point, and is a collection of one or more unconnected cells (Okabe et al 1992). See the blue cells forming the region associated with one site in Figure 5. It is useful to establish a bound on the number of cells, as their complexity can affect the accuracy of the final output – the kth-order Voronoi diagram. If one of the kth-nearest point diagrams is complex enough that many cells are smaller than a pixel in size, the kth-order Voronoi diagram will contain many errors. The analysis of the complexity of the kth-nearest point diagram is simplified somewhat by the fact that the underlying structure is a simple arrangement of planes. The total number of faces at all levels of an arrangement of n planes is O(n3) (O’Rourke 2000). Each such face corresponds to exactly one cell in the set of all possible kth-nearest point diagrams, so the total complexity of all n possible kth-nearest point diagrams is also O(n3). The correspondence between faces in the arrangement and cells in the set of kth-nearest point diagrams should be intuitively obvious. A vertical line will pass through each of the n planes exactly once, and the order of the intersection of the planes gives the ranking of the distances between each site and the line’s projection in the plane. The complexity of the kth-nearest point diagram for a fixed level k is much more difficult to determine. Clearly it does not exceed n3. The greatest complexity is found at k = n/2, and the least complexity is found at k = 1 and k = n, where there are O(n) cells. The first-order Voronoi diagram is, not surprisingly, identical to the first-nearest points diagram. Likewise, the nth-nearest point diagram corresponds to the (n-1)th-order Voronoi diagram, also known as the farthest-point Voronoi diagram, as can be seen by comparing the first and last diagrams of Figures 2 and 5. The cells associated with one site in the kthnearest point diagrams expand out in “rings” from the region in the first-nearest point diagram up to some midpoint, and then contract back towards the nth-nearest point region, as can be seen in Figure 5.
7
4. The Distance Transform Some of the many applications of the Voronoi diagram require the so-called distance transform (DT) of the sites. This associates with every pixel in image space its distance to the site nearest to it. See an example in Figure 6. The distance transform is important for natural neighbor interpolation of a function sampled at the sites (Sibson 1981), morphological operations on images, such as medial axis and skeleton computation (Fabbri et al 2002), and polygon morphing (Cohen-Or et al 1998). Many efficient algorithms exist for the computation of the distance transform, or a close approximation of it (meaning that the distances are not exactly the true distances) for images. A particularly efficient algorithm, running in O(m) time, where m is the number of image pixels, is due to Breu et al (1995). All these algorithms, however, run in software and cannot significantly benefit from the GPU.
Figure 6: Distance transform of a (white) curve, which is approximated as a set of point sites. Higher intensity pixels are farther from the curve.
Using the Tangent-Plane algorithm for Voronoi diagrams, it is possible to extract the distance transform from the depth buffer in a post-processing step. In fact, we can do more than that – we can also extract the distance transform corresponding to every level of the arrangement, namely the distance of each pixel to its kth-nearest neighbor. This will possibly enable other applications. Distance Transform Computation As illustrated in Figure 7 for the 1D case, given the tangent plane corresponding to a site located at point a and x – an arbitrary point along the real line – denote by d(x) the vertical distance at x from the parabola to the tangent plane, by h(x) the distance from the camera to the same point on the tangent plane, and by p(x) the distance from the camera to the same point on the parabola. Let T(x) = 2ax-a2 be the tangent line. Clearly, d(x) = h(x)-p(x), h(x) = z-T(x) and p(x) = z-x2, where z is the height of the projection plane. Thus d(x) = z-2ax+a2-z+x2 = (x-a)2, so d(x) is also the squared distance from x to a. To summarize, the computation of the distance transform amounts to subtracting the paraboloid distance function p(x,y) = z-x2-y2, which is independent of the sites, and may be rendered once for all pixels, from the depth of the first level of the arrangement (the depth map from the first pass). This assumes, however, that the depth contains an absolute distance from the camera to the tangent planes, which is not the case. In practice, the depth values are normalized to the interval [0,1]. Therefore, p(x,y) must be similarly normalized, and the true (pixel) distance transform recovered by a linear transformation of the difference.
8
viewplane
p
z h
-1
a
d x
1
distance from a to x
Figure 7: Computation of squared distance of pixel at coordinate x from site at coordinate a. The green tangent line to the blue parabola y = x2 is due to the site. The bottom black line is the line on which the sites lie. The viewplane is z units above this.
kth-Order Diagrams The distance transform is not well defined for kth-order diagrams (k>1). However, one may think of various ways of doing this, depending on the application. Fortunately, using our algorithm allows the computation of the distance transform for each one of the nearest point diagrams, for all values up to k. This will yield, for every pixel, its distance from the site which ranks number k in the list of distances of all sites from the pixel. 5. Approximation Error As with all discrete approximations of continuous entities, our algorithm incurs some error. This manifests in pixels being colored in the wrong color, and some very small cells being eliminated from the diagram. Fortunately, as opposed to the Cone algorithm, we do not employ any approximation of a 3D shape (the cones), so that is not a potential source of error. The Cone algorithm requires about 85 polygons per cone (for each point site) to reduce the error to less than a pixel at image resolution of 1024 x 1024 pixels (Hoff et al 1999). Our tangent planes are not an approximation. The main source of error in the Tangent-Plane algorithm is the precision of the depth buffer, which is a key in accurate rendering of the levels of the arrangement. When viewing the arrangement of planes in perspective projection, the tangent planes occasionally show z-fighting in the vicinity of their intersection – the flicker associated with slightly different perspectives causing different parts of the scene to fail the depth test. This same imprecision happens when viewing the planes in parallel projection, but since the camera is not moving, it is not very noticeable. This will typically result in error along the boundaries of the cells of the kth-nearest point diagrams. Oddly enough, Hoff et al. (1999) report that this is a minor source of error as opposed to the others present in the Cone algorithm. More difficult to deal with is the case where the depth buffer comparisons cause the algorithm to “pass through” two planes in a single pass, causing that pixel to be improperly colored at every level after that. As a result, diagrams with higher k may have a speckled or dirty appearance because of the higher number of pixels that randomly have the wrong color. See Figure 8 for an example. It is possible to correct most of these errors by a simple post-processing of the Voronoi diagram. The majority of such errors occur strictly in the interior of the Voronoi cells, as opposed to on the boundary between cells. Since the regions are convex, we can use a unanimous filter to correct the image. This filter is one that changes the color of the center pixel to the color held by all the surrounding pixels, if such a color exists. Thus, a 3x3 unanimous filter will
9
change the color of the center pixel if all eight other pixels are one color. This filter will correct errors within cells, but will not modify the boundaries between cells. In many cases it suffices to use a simple majority filter.
Figure 8: Errors in a Voronoi diagram using both the Cone algorithm (top) and the Tangent Plane algorithm (bottom). Images on right – 2nd-nearest point diagram for 2 sites. Images on left – the corresponding 2nd-order Voronoi diagram (containing just one cell). Black pixels in all images are erroneous. Note that the errors occur along the single boundary in the 2nd-nearest point diagrams, thus in the interior of the resulting 2nd-order Voronoi cell.
6. Optimizations Possible optimizations of the Tangent-Plane algorithm depend somewhat on the application. In this section we discuss a few of the more generic optimizations. Our implementation included the first two described here. GPU Storage of Geometry The simple version of the algorithm maintains the tangent plane geometry on the CPU. It is possible to do better by storing a copy of a generic tangent plane (e.g. tangent to (0, 0)) in graphics memory (as a vertex buffer object) for each site, and then to compute the correct tangent plane in a vertex program by transferring the 2D coordinates of the site to the GPU disguised as a 2D texture coordinate. This optimization results in significant performance benefits over immediate-mode rendering if the graphics drivers do in fact store the data on the GPU, which is typically the case. Depth-Test Inversion If k is greater than n/2, it is possible to switch the depth-test from “greater than” to “less than” and simply “peel” levels from the bottom up, such that computing the kth-order Voronoi diagram for such a k will require just n-k (which is less than k) passes. A notable example is the farthest Voronoi diagram,
10
equivalent to the (n-1)th-order Voronoi diagram, which may be computed in one pass using this technique. Incremental Algorithm In some applications the sites are not all given in advance, but rather are supplied over time. In these applications, the Voronoi diagram must be constructed based on a small initial subset of the sites, and then updated online as each new site is received. Of course, it is always possible to construct the diagram from scratch each time a new site becomes available, but this is obviously suboptimal. Luckily, a small modification to our algorithm transforms it into an incremental algorithm, where the diagram may be updated after each site. The price for this bonus is a slightly less efficient algorithm. Unfortunately, it is possible only to add sites, but not remove them. This incremental algorithm is as follows: for each site construct tangent plane // k passes for i = 1 to k initialize depth buffer with depth[i] render tangent plane in parallel projection to texture[i] using depth peeling relative to depth[i-1] update depth[i] and texture[i] // single pass Composite all k textures with transparencies 1/k The main difference between this incremental algorithm and the batch algorithm is that now all k depth buffers must be maintained, instead of just two employed as dual depth buffers. Level Reuse Some applications might use multiple k-order Voronoi diagrams for a single set of sites but different values of k. In this case it suffices to compute the diagram for the largest such k, and then simply composite the appropriate levels for each of the smaller values of k. It is not necessary to recompute the levels for each diagram. 7. k-Nearest Neighbor Queries While the kth-order diagram is not likely to find as many uses as the standard first-order Voronoi diagram, it does have a number of immediate applications. The most popular is the k-nearest neighbor query: Given a kth-order Voronoi diagram and a query point, the cell containing the query point identifies the set of k sites closer to the query point than all other n-k sites. See Cárdenes et al. (2004) for a sample application in medical image segmentation. To find the r nearest neighbors from the output of the Tangent-Plane algorithm, it suffices to sample each of the k-nearest point diagrams at the query point, for k=1,..,r. The colors of the r samples identify the sites. Furthermore, the sites may be reported in order of distance from the query point, which is more information than the kth-order Voronoi diagram itself contains, as these diagrams are order-insensitive.
11
8. Delaunay Triangulation It is easy to see that the cells of the second-order Voronoi diagram correspond exactly to the edges of the Delaunay triangulation of the point sites. Thus, it is possible to compute the Delaunay triangulation by detecting the identities of the cells of the second-order diagram. In practice, we do this by looking at the label of each pixel of the first- and second-closest point diagrams. The only drawback of this method (besides imprecision issues) is when a cell of the second-order diagram is located completely off the screen, which happens when sites are close to the border of the screen, or when three sites on the convex hull (of the sites) are nearly collinear. In both cases, the resulting Delaunay triangulation may be missing edges. 9. Implementation and Performance We implemented the Tangent-Planes algorithms described in this paper in C++ and OpenGL, and incorporated a number of different shaders written in assembly language and Cg for an NVIDIA GPU. In this section we provide details on the shaders, along with some complexity analysis and empirical runtime measurements for our implementation. We compare this both theoretically and experimentally to the Cone algorithm implementation for the first-order Voronoi diagram. For the kth-order Voronoi diagram, we also analyze both the time and space complexity, in particular as affected by the number of passes. The Shaders and OpenGL The most prominent shader we use handles the depth peeling operation. This is the core behind correct implementation of the tangent planes algorithm. It is a modification of the Everitt’s (2001) depth peeling fragment shader, written in assembly. The code follows. !!ARBfp1.0 OPTION ARB_fragment_program_shadow; TEMP R0; MOV R0, fragment.position; TEX R0.x, R0, texture[0], SHADOWRECT; ADD R0.x, R0.x, -0.5; KIL R0.x; MOV result.color, fragment.color; END
As Everitt describes, depth peeling can be implemented using the ARB extension which supports shadowmapping. Texture buffer texture[0] contains the contents of the depth buffer from the previous level, against which the depth of the current fragment is compared. Performing a shadow-mapping comparison (as designated by the SHADOWRECT keyword) returns a binary result – 1 if the fragment passes the comparison of the depth texture with the current fragment’s depth value and 0 otherwise. Subtracting 0.5 causes the value to be negative if the fragment failed the depth comparison, so it may be subsequently discarded by the KIL operator. Thus, we discard all fragments that fail the depth test. The colors of all other fragments are written to the frame buffer. The OpenGL implementation holds no major surprises. The only caveat is that the blend function used during the compositing of the k layers should be the following: glBlendFunc(GL_SRC_ALPHA, GL_DST_ALPHA);
12
Other blend functions will not give the correct result. Another useful shader computes the quad representing an arbitrary tangent plane on the GPU, which allows us to make use of the vertex buffer object (VBO) ARB extension. As mentioned in Section 6, this is an optimization that can result in significant speedup. For k=1, we often observed speedups of up to 300% on some graphics cards just from using VBO’s. This vertex shader is quite simple. Its implementation in Cg follows: void vp_tangentPlane(
float4 position : POSITION, float4 color : COLOR, float2 site : TEXCOORD0,
out float4 out float4
oPosition : POSITION, oColor : COLOR,
uniform float4x4 modelViewProj ) { oPosition.xz = position.xz; oPosition.y = 2 * site.x * oPosition.x + 2 * site.y * oPosition.z – site.x * site.x - site.y * site.y; oPosition.w = 1.0; oPosition = mul(modelViewProj, oPosition); oColor = color; }
The x and z coordinates of the vertices of the quad are fixed to the four combinations of {-1,+1} with itself, and we use them and the site coordinates to compute the corresponding y coordinates, using the derivative of z = x2+y2. To minimize the amount of data transmitted over the AGP bus, we transfer the site coordinates to the GPU as a two-component texture coordinate. If the sites are dynamic, the entire list of site coordinates must be transferred to the GPU for rendering at each frame. However, the colors of the sites still remain constant between frames, as do the x and z coordinates of the tangent plane quads. Thus, vertex and color data can remain on the GPU between frames. We also implemented the distance transform in a simple fragment shader. First, every time the window is resized, we compute the value of the paraboloid z = x2 + y2 at every pixel of the viewport and store the result in a texture. To compute the distance transform, we render a full-screen textured quad with texture coordinates corresponding to the corners of the viewport, from (0,0) to (w,h), where h and w are the height and width of the viewport, respectively. At each fragment, we subtract the paraboloid texture from the depth texture of the first level of the arrangement. After all w×h fragments have been processed, we read the depth buffer back to the CPU to retrieve the values of the distance transform. The shader for this follows. void fp_distanceTransform(float4 color float2 tex
: COLOR, : TEXCOORD0,
out float4 oColor : COLOR, out float dist : DEPTH, uniform samplerRECT depthMap, uniform samplerRECT paraboloid ) { float depth = texRECT( depthMap, tex );
13
float parab = texRECT( paraboloid, tex ); dist = depth – parab; dist = sqrt( dist ); oColor = 1.0; }
Time and space complexity As mentioned in Section 1, the runtime complexity of the Cone algorithm depends on n and m, where n is the number of sites and m is the resolution of the output image in pixels. This complexity is O(nm). For the same reason, our Tangent-Plane algorithm also runs in O(nm) time for the first-order Voronoi diagram – each of the n sites generates m fragments. Table 1 details the frame rates (in frames/sec) of the two algorithms for various values of n and m, as measured on an AMD Athlon 64 3400+ 2.21 GHz Processor with 1 GB of RAM running Windows XP Professional. The graphics hardware used was an NVIDIA GeForce FX 5950 Ultra driving a 1600×1200 pixel display with 32 bits/pixel at 60Hz refresh rate. It is evident that the runtime of the two algorithms is quite similar. Likewise, since m>>n, the space complexity is dominated by the size of the output image – O(m) – for both algorithms. m (pixels)
n TP alg Cone alg (sites) (fps) (fps) 512 32 32 5122 1024 15 15.8 2048 8.7 8.6 512 8.7 8.6 10242 1024 4.6 4.5 2048 2.3 2.3 Table 1: Rendering performance (in frames/sec) of the Tangent Plane algorithm vs. the Cone algorithm for the firstorder Voronoi diagram for different values of m and n.
For k>1, there is a significant fall in rendering performance compared to k=1. This is due to extra overhead per pass for the actual peeling process, which increases the number of instructions in the shader from one for the first pass to eight for each of the subsequent passes. However, this is the same for each subsequent pass, so the runtime complexity of the Tangent-Plane algorithm for the kth-order Voronoi diagram is O(knm) – each of the k levels generates nm fragments. Rendering speeds can be seen in Table 2 for n = 512, k = 5, 10, 15 and m = 5122, 10242. The space complexity for computing the kth-order Voronoi diagram is dominated by m and k. For each of the k levels, we store a texture of m pixels. Thus, the space complexity is O(km). For reasonable values of k and m, this is much less than the texture memory available on today’s GPUs. For example, to render to a 1024×1024 pixel image, each level requires 4MB of texture memory, which allows k to increase to about 30 before exhausting the texture memory available on many of today’s mid-range GPUs. This number is closer to 60 for high-end GPUs. m k (pixels) (passes) 5 5122 10 15 5 10242 10 15
TP (fps) 0.711 0.32 0.207 0.169 0.075 0.049
Table 2: Rendering performance (in frames/sec) of the Tangent Plane algorithm for the kth-order Voronoi diagram for different values of m and k. The number of sites in all cases was n=512.
14
10. Discussion While the Cone and Tangent-Plane algorithms perform comparably, it is worth mentioning when one might be preferable to the other. In our experience, both are easy to implement. However, the TangentPlane algorithm seems to be slightly more precise geometrically than the Cone algorithm – as long as the cones are discrete, there will always be some additional error, even if it can be driven to sub-pixel levels. Indeed, we found that even with highly tessellated cones (more than twice that required to reduce error to sub-pixel levels), there are still pixel-level differences between the Cone and Tangent-Plane algorithm outputs. Thus, we recommend using the Tangent-Plane algorithm if as accurate an approximation as possible is needed. The Cone algorithm allows a much easier rendering of the Power Diagram, a useful variant of the Voronoi Diagram not discussed here. Both algorithms offer simple implementations for distance transforms, but here again, the Cone algorithm suffers from geometric error that the Tangent-Plane algorithm does not have. Neither algorithm seems to offer a significant advantage for the k-nearest neighbors query, due to the complicated nature of the depth-peeling errors. There is a way to compute the kth-order Voronoi diagram using a variant of the Tangent Plane algorithm without depth peeling, namely, by simply rendering a larger collection of tangent planes. However, this construction, described by Aurenhammer (1990), requires the rendering of O(nk) tangent planes, which is prohibitive for large k. Aurenhammer decribes a way to reduce this number, but the resulting algorithm is quite complicated and requires O(k2nlogn) time. Our implementation of the Tangent-Plane algorithm actually generates more information than that contained in the kth-order Voronoi diagram – it also ranks the k sites according to distance. The algorithm is capable of computing the first-order Voronoi diagram of n=512 points at image resolution of m=1024x1024 pixels in 8.5 frames/sec, enabling interactive applications for k=1, and near-interactive applications for other typical (small) values of k. Since the complexity of the algorithm is linear in n, m and k, it scales well, and can take direct advantage of future improvements in the speed of graphics hardware. Finally, generalization of the depth peeling technique to accommodate more complex sites, such as curves and polygons, would be a useful extension. Currently we approximate the complex sites by multiple point sites, which gives incorrect results for k>1. The most obvious way to directly handle complex sites would be to have the depth peeling shader take into account also the color of the fragment at the previous level, and pass the fragment through only if it had a greater depth and a different color. It remains to be seen if this is possible. References F. Aurenhammer. A new duality result concerning Voronoi diagrams. Discrete & Computational Geometry 5:243-254, 1990. F. Aurenhammer. Voronoi diagrams - a survey of a fundamental geometric data structure. ACM Computing Surveys, 23(3):345-405, 1991. P.K. Agarwal and J. Matoušek. Dynamic half-space range reporting and its applications. Algorithmica 13:325–345, 1995
15
R.C. Bose and S. Chowla, Theorems in the additive theory of numbers. Comment. Math. Helv. 37:141147, 1962-63. H. Breu, J. Gil, D. Kirkpatrick, M. Werman. Linear time Euclidean distance algorithms. IEEE Transactions on Pattern Analysis and Machine Intelligence, 17(5):529-533, 1995. R. Cárdenes, S.-K. Warfield, A.J.U. Mewes, and J. Ruiz-Alzola. k-Voronoi diagrams computing in arbitrary domains. In Proc. IEEE International Conference on Image Processing, 2003. T. Chan. Random sampling, halfspace range reporting, and construction of (