May 7, 2007 - presents a new machine learning based technique to auto- matically ... performance model based on the code features of the tuned .... ror metric is a poor measure for performance prediction and ... the UTDSP [18] program compress and ran on an embed- ... sequences sorted by increasing actual speedup.
Fast Compiler Optimisation Evaluation Using Code-Feature Based Performance Prediction Christophe Dubach, John Cavazos, Björn Franke, Michael O’Boyle
Member of HiPEAC Institute for Computing Systems Architecture, University of Edinburgh, UK
ABSTRACT Performance tuning is an important and time consuming task which may have to be repeated for each new application and platform. Although iterative optimisation can automate this process, it still requires many executions of di�erent versions of the program. As execution time is frequently the limiting factor in the number of versions or transformed programs that can be considered, what is needed is a mechanism that can automatically predict the performance of a modi�ed program without actually having to run it. This paper presents a new machine learning based technique to automatically predict the speedup of a modi�ed program using a performance model based on the code features of the tuned programs. Unlike previous approaches it does not require any prior learning over a benchmark suite. Furthermore, it can be used to predict the performance of any tuning and is not restricted to a prior seen transformation space. We show that it can deliver predictions with a high correlation coe�cient and can be used to dramatically reduce the cost of search.
Categories and Subject Descriptors D.3 [Software]: Programming languages; D.3.4 [Programming languages]: Processors�Compilers, Optimization ; I.2.6 [Arti�cial intelligence]: Learning�Induction
General Terms Performance, Experimentation, Languages
Keywords Performance Modelling, Compiler optimisation, Architecture, Machine learning, Arti�cial Neural Networks
1.
INTRODUCTION
Tuning applications to improve performance is an important but tedious and time consuming task. For performance
Permission to make digital or hard copies of all or part of this work for personal or classroom use is granted without fee provided that copies are not made or distributed for profit or commercial advantage and that copies bear this notice and the full citation on the first page. To copy otherwise, to republish, to post on servers or to redistribute to lists, requires prior specific permission and/or a fee. CF’07, May 7–9, 2007, Ischia, Italy. Copyright 2007 ACM 978-1-59593-683-7/07/0005 ...$5.00.
Grigori Fursin and Olivier Temam
Member of HiPEAC ALCHEMY Group INRIA Futurs and LRI, ParisSud University, France critical applications such as those found in embedded devices, it has to be performed for each new application and each new platform. The programmer has to, �rst of all, make a potentially bene�cial program modi�cation, then compile it, before �nally executing the new program and recording its execution time. This modify-compile-execute cycle must be repeatedly performed until a su�cient performance gain is achieved or the programmer has run out out time. There has been much work in the area of iterative optimisation aimed at automating this process [23, 12, 7, 16, 20, 10, 11]. Such approaches focus on choosing good program modi�cations or transformations so that the number of modify-compile-execute cycles is reduced. Although it is possible to �nd good performance improvement automatically, iterative optimisation still requires many executions of di�erent versions of the program. As execution time is frequently the limiting factor in the number of versions or transformed programs that can be considered, what is needed is a mechanism that can automatically predict the performance of a modi�ed program without actually having to run it. Ideally, such a predictor would be independent of platform, program and most importantly not be restricted to certain classes of program modi�cations. Such a scheme would allow many di�erent versions to be rapidly evaluated, dramatically reducing the time to produce a tuned application. Alternatively, for the same amount of time, many more program versions could be considered and increased performance achieved. This paper presents a new technique to automatically predict the speedup of a modi�ed program using a performance model based on the code features of the tuned programs. To build such a model, we �rst randomly transform the program to be tuned and run it on the target platform a number of times. The code features of the modi�ed programs plus their execution time are then used for training a machine learning based model. This learnt model is then able to predict the speedup of any new modi�ed version of the program without executing it. Unlike previous work [5] it does not need to run an extensive training suite of benchmarks to build a predictor, it only needs a few runs of the program to be tuned. Nor is it limited to a �xed pre-examined transformation space as is the case of the reactions-based model [5]. Instead, because it uses features of the code, it can predict the performance of any modi�cation of the program. In this paper we show that we are able to e�ectively predict the performance of a large number of tuned programs with few samples. Using just 16 samples we can predict the performance of 88000 modi�cations with a correlation coef-
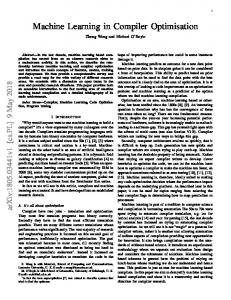
compress 1.7 Real speedups Features predictor Mean predictor 1.6
1.5
speedup
1.4
1.3
1.2
1.1
1
sequences
Figure 1: Optimisation space of the compress program. The x-axis represents the 88000 transformed versions of the program sorted in order of increasing speedup. The y-axis denotes the speedup value of the corresponding transformed program over the original program. The curve labelled Real speedup denoted the actual performance while the curve labelled Features predictor is the predicted value of our feature-based scheme using 64 evaluations of randomly transformed programs. �cient of 0.65. With 128 samples, this rises to 0.8 - a highly accurate predictor. Furthermore, we show that this technique can be used to guide an iterative optimisation process to help selecting those transformations likely to give good performance four times faster than random search. While the focus of this paper is in using prediction to avoid execution on a new platform, it has much wider potential application. The ability to automatically predict program performance is particularly worthwhile in the early stages of processor design. Typically, simulators are used as they allow easy exploration of di�erent con�gurations at the cost of drastically increased execution time. The overhead of simulation makes program tuning prohibitively expensive until the actual hardware is available. If we were able to build an accurate performance predictor, it would overcome the cost of simulation allowing programs and processor architecture co-design. The paper is structured as follows: a motivation example is �rst provided in Section 2 illustrating the bene�ts of using a performance predictor. It shows that a simple error metric is a poor measure for performance prediction and shows how the correlation coe�cient is a better �t. Section 3 brie�y describes the various models and predictors evaluated in this paper. This is followed by Section 4 which describes in some detail, the program features that are used to build our models. Section 5 describes the experimental setting used in Section 6 to evaluate the di�erent models and predictors. As one of the main bene�ts of this approach is it ability to predict the performance on unseen transformations, Section 7 shows how the predictor can be used to select good versions of a program in unseen transformation spaces. This is followed by a brief review of related work in Section 8 and �nally, Section 9 concludes this paper.
2.
MOTIVATION This section illustrates how our predictor can be used to
estimate the speedup of di�erent versions of a program and describes ways in which its accuracy may be evaluated. We want to compare the predicted performance of di�erent versions of a program against their actual values. In order to give a realistic evaluation, rather than evaluating a few hand-tuned versions, we automatically generated many di�erent program versions using combinations of the 13 different program transformations, listed in Table 3. We restricted our attention to sequences of these transformations of up to length 5 giving 88000 di�erent program versions (see Section 5 for further details). Each of these transformation sequences was applied to the UTDSP [18] program compress and ran on an embedded platform, the Texas Instrument C6713 clustered VLIW processor. The results of applying each of the transformation sequence is shown in Figure 1 where the curve labelled Real speedups is the actual speedup achieved when various transformations or tunings are applied to compress. The y-axis is the speedup obtained after applying a transformation sequence, and the x-axis is simply the transformation sequences sorted by increasing actual speedup. Most versions of the program give a speedup with the best achieving 1.66. We want to build a predictor that can predict this behaviour based on a small number of program executions or samples. In this example, we randomly generated 64 transformed programs and executed them in order to build a predictor that was able to predict the remaining points in the space. The performance prediction of our scheme is shown by the line labelled Features predictor. As it is visually apparent, our model is able to fairly accurately predict the performance of this program when applied to di�erent transformation sequences. It requires runs of just 64 randomly generated transformation sequences of the program to learn a model. This represents less than 0.1% of the whole space. This model can then predict the performance of the remaining 88000 − 64 transformation sequences applied to that program. At �rst, it may be surprising that such a small training set size is su�cient to capture such a huge space. However, transformed programs have large areas of similar behaviour which can be captured in a few trials. Furthermore, as we use code features, the model automatically determines which �performance region� a transformed code belongs to.
2.1
Mean predictor and mean absolute error
Although our scheme appears to perform well, it is important to have a fair comparison with a default scheme in order to evaluate the predictions. The simplest naive scheme is one which always predicts the same speedup for all transformations based on the average value of any transformed program. If we perform such an experiment frequently enough, such a naive predictor will always predict the mean value of the space and thus is called the mean predictor. Its predictions are shown with the line labelled Mean predictor on Figure 1. The role of the mean predictor becomes apparent once we consider metrics to quantify the quality of our predictions. A commonly accepted metric is the mean absolute error : PN |predicted valuei −real valuei | where N represents mae = i=1 N the total number of observed values. In Figure 2(a) the mae of our predictor is compared with that of the mean predictor and plotted as a function of the number of runs
1.7 0.25 features predictor mean predictor
1.6
0.2
Speedup
1.5
mae
0.15
1.4 1.3
0.1
1.2 1.1
0.05
pred 8 random
1 0 0 1
2
3
4 5 6 sample size (power of 2)
7
8
9
1 features predictor mean predictor
0.8
correlation
0.6
0.4
0.2
0
2
3
4 5 6 sample size (power of 2)
7
8
9
(b) Correlation coe�cient.
Figure 2: Evaluation of the performance of the predictors for the compress program. The sample size is a logarithmic scale (21 , . . . , 29 ) and represents the number of executions of di�erent versions of the compress program, or training data, needed to train each model. Both models have been trained 50 times using di�erent random training samples. The values shown are thus averaged.
used to build the model. While our model improves with the number of runs, both the predictors exhibit similar mae. However, we know from Figure 1 that the mean predictor is poor at performance prediction and does not distinguish between di�erent versions of the program. In fact, the mae of the mean predictor gives information about the variance of the space (formally, the variance of the space is equal to the mean squared error, which is strongly related to the mae ).
2.2
20
30
40
50 60 evaluations
70
80
90
100
Figure 3: Searching the large space of the compress program. The x-axis represents the number of evaluations or executions of transformed versions of the program. The y-axis shows the amount of performance improvement achieved. Pred 8 is a search using a features-based model which has 8 prior training evaluations. Random denotes a simple random search.
(a) Mean absolute error.
1
10
Correlation coefficient
Although mae gives some insight into the accuracy of a predictor, it is not good at distinguishing between good and poor versions of a program. To evaluate the quality of the predictor, we therefore chose to use the correlation coe�cient. This metric, explained in Section 6.1, takes a value between 0 and 1 (neglecting the sign). The closer to 1 this value is, the better the predictor is. Figure 2(b) shows the
correlation coe�cient for our feature-based predictor and for the mean predictor. The mean predictor has a correlation of 0, meaning that it is unable to predict the shape of the curve, while our predictor is able to improve its accuracy as the number of training samples is increased. The scale is logarithmic, so point 6 represents 26 =64 sample runs with a correlation coe�cient of 0.85 - a very accurate predictor. The detailed performance of this particular version of the predictor has already been shown in Figure 1. The correlation coe�cient is therefore a good metric since it allows us to quantify in a single number how well the predicted values follow the real speedups.
2.3
Using the predictor to find good points
Another way of evaluating the quality of our predictor is to use it to search for good optimisation points in a previously unseen transformation space. In other words, how well does it predict the performance of programs transformed in a manner it has never seen before, and how can that be used to guide the search for good optimisations. Figure 3 shows how random search and our predictor perform when searching a new optimisation space. This new space contains transformation sequences of length 20 selected from up to 54 transformations, which we refer to as the large space (see Table 4 for further details). The random search is performed by randomly selecting a transformation sequence in the space and by running the resulting program. This is repeated 100 times and the best transformation sequence found so far is kept. The curve labelled pred 8 shows the performance of our predictor built using just 8 samples from the small 88000 element space shown in Figure 1. It is used as follows: initially 500 random points are selected but not executed from the new space (1034 di�erent sequences; described in Section 7) and their code features extracted. We refer to this space as the large space. The predictor then ranks those samples based on their predicted performance. Figure 1 shows that the predictor is not accurate in determining the abso-
need to train on a prior benchmark suite, instead we simply use code features of the transformed program to predict performance. The type of code features used, is described in detail in Section 4. The above description gives a summary of the overall approach. However, given the < codef eatures, speedup > pairs, there are a number of modelling approaches that can be considered for building a predictor. We consider two of the simplest schemes.
Linear model. Figure 4: Training and using the features-based predictor. During the training phase, a set of transformation sequences is applied to the original C program. Then pairs of features/speedup values are gathered; the features are extracted and the transformed programs are executed. Those pairs of values compose the training set and are used to train the model using an iterative process. Once the model is trained, it can be used to predict the speedup of a new transformation; features are extracted from the new transformed program and used as an input to the model. lute best performing option, but is good at identifying good candidates. So the prediction based search pred 8 starts executing the version with the best predicted execution time, then the second best, and so on, up to 100 times. It is interesting to notice that using this scheme with the mean predictor results in random search; the mean predictor assumes all versions are equally good (same prediction) and hence randomly selects. As it can be seen in Figure 3, our features-based predictor dramatically outperforms random search. The predictor used to search the new space has been trained using only 8 samples from the small and di�erent space, but it is still useful to search a space of transformation sequences never seen before unlike previous approaches [5]. This example illustrates one way in which the model can be used for performance tuning.
3.
LEARNING A PREDICTIVE MODEL
In this section we describe our approach to building an accurate predictor using a small number of runs of the transformed program and their associated code features. Other approaches are also considered and later used for comparative evaluation in Section 6.
3.1
Features-based predictor
Figure 4 shows how the features based predictor is trained and used. During training, a set of randomly selected transformation sequences (T1 , . . . , TN ) is applied to the target C program. From the resulting transformed programs, the features are extracted and the speedup values are collected after running those programs. This creates a set of pairs < codef eatures, speedup > that are used to train the model. Once the model has been trained, any new transformation sequence (Tnew ) can be applied to the program. The features of the new program are then extracted and fed into the model which provides a prediction of its speedup. Unlike the reaction based approach techniques [5], we do not
Linear regression is one of the basic models that is often uses in statistic. It makes prediction by computing a weighted sum of the input variables. The weights are determined by minimising the mean squared error from the training set. The advantage of this method resides in it's simplicity; the problem of �nding the optimal weights is simply reduced to a few matrix operations and once the optimal weights (ω1 , . . . , ωN ) are computed, the prediction can be made with a simple weighted sum of the inputs P (f eat1 , . . . , f eatN ) : speedup = N i=1 ωi · f eati . Its performance is evaluated in Section 6.
Artificial neural network model.
The second model is our preferred model and is an ANN (Arti�cial Neural Network [3]). Its main advantage over the linear regressor is that it can model a non-linear space. Our ANN is a multi-layer perceptron which has one hidden layer that contains 1 to 5 hidden neurons (weights). The standard back-propagation algorithm is used to train the ANN.
3.2
Non-feature-based alternative predictors
We compare our model against the mean predictor, the sequence encoding-based predictor and the reactions-based approach, neither of which use code features.
Mean predictor.
Introduced in Section 2, the mean predictor acts as our baseline predictor. It does not use any features at all and always predicts the mean of the points that it has sampled. This value, computed from the training set, tends towards the mean of the space when enough samples are taken from the space. The mean of the space is the constant value that minimises the mean absolute error mae and, therefore, makes a good base case predictor.
Sequence encoding-based predictor.
This approach, similar to our code feature-based predictor uses a vector of bits that encodes the sequence of transformations instead of program features as an input to the model. The chosen encoding does not take into account the ordering of the transformations, but simply the presence of a given transformation in the sequence.
Reaction-based predictor.
The last predictor considered is the reaction-based scheme described in [5]. Like the previous predictor, it directly uses the sequence of transformations applied to a program as an input to a learnt model [5]. In addition to this, it uses a signature of the program as an input. This signature, referred as reactions, corresponds to the speedups obtained when some prede�ned sequences of transformations have been ap-
Label
computation operations
Label
address computation operations
LDC CVT LOD STR MBR CMPI/CMPF UJMP/CJMP CPY SFT ROT ARII/ARIF MULI/MULF DIVI/DIVF LOG CAL ARYI/ARYF MEM AREF RET ARYLDC ARYCVT ARY...
Label
LOOP_BODY LOOP_TEST FOR IF
Load a constant value Conversion between �oat/int Load from memory Store to memory Multi-way branch Comparison using int/�oat Unconditional/Conditional jump Copy Shift Rotation Arithmetic operation on int/�oat Multiplication on int/�oat Division on int/�oat Logical operation Function call Array accesses on int/�oat Memory operation Array reference Return from function load a constant value conversion between �oat/int ...
control-�ow operations While loop body While loop test For loop If-then-else statement
Figure 5: The four class of features that represent the factors that in�uence performance.
Table 1: The 3 categories of operations considered for features extraction; computation operations, memory access computations and control-�ow operations.
plied to the program. This characterises the behaviour of the program. The major di�erence with all the other predictors presented in this paper is that it requires extensive prior training on a benchmark suite. In e�ect, it builds a model correlating transformation sequences with speedup. It has been shown to work well and is straightforward to use.
4.
SOURCE CODE FEATURES
The main distinctive characteristic of our methodology is the use of program features as a mean of building accurate performance models. This section describes how the essential program characteristics or features are extracted from a transformed program in order to build the featuresbased models. Since these features are extracted at the source level, they are platform independent, unlike other approaches. Having the right features is critical for performance accuracy. The following sections describe and provide justi�cation for our selection.
4.1
Description of the features
The feature categories that summarise and characterise a program are derived from high-level information describing the operations within a program. Those operations can be classi�ed into three categories and are shown in Table 1 which roughly correspond to computation, address and control-�ow operations. Since our features are extracted using the SUIF infrastructure [13], the operations considered are simply based on the intermediate representation used within SUIF.
Classes of features.
We use four separate classes of features based on the three di�erent categories of high-level operations to characterise a program as shown in Figure 5. These features are considered to be good predictors of a program's performance. The
Figure 6: Pro�ling information extraction. feature class that characterises code size is determined by simply counting the number of occurrence of each operation in the program. The second class, is derived by counting the number of operations executed using once-only pro�ling information of the original non-transformed program (see the next section for further detail). To characterise the level of parallelism available (the third feature class) we assume an ideal machine that can execute each operation in one cycle with unlimited resources. Given the pro�ling information, the total number of cycles required to execute the program is quickly approximated. Finally, we estimate the number of distinct memory accesses statically from the source code. These 4 feature classes are easy to determine and provide a signature of the program's behaviour.
Relative features.
As we are interested in speedup relative to the original program, we need to record the di�erence between the features of the baseline and transformed program. Therefore the feature vector is extracted by taking the relative difference between the features of the baseline and the transformed program. the elements of the feature vector are thus normalised. Elements that contain null values mean that the corresponding features of the original code and the transformed code are the same.
4.2
Extracting execution frequency
Certain features cannot be determined statically. For instance, the number of iterations of a loop might be unknown
Program
adpcm compress edge detect �t �r histogram iir lms�r lpc spectral estimation
maximum speedup
Table 2: Programs used in our experiment and the corresponding maximum speedup available in the small space. hence pro�ling information is used to determine the execution frequency of each basic block. The extraction of this information is summarised in Figure 6. Counters are inserted into the original C source code for each dynamic control-�ow structure and pro�le information is collected when the original program is �rst run; it has negligible overhead. This is in fact very similar to the micropro�ler developed in [17]. The original program is then annotated with this information, so that the information is available to any subsequent transformations. When a transformation is applied, the pro�ling information is updated deterministically. This way we are able to extract accurate features from any subsequent modi�ed version, without affecting program behaviour.
4.3
Reduction of dimensionality
The total number of features extracted per C program is 118, which means that our model should have 118 inputs. Unfortunately, in an ANN, every input corresponds to a neuron. Since the number of free parameters increase with the number of neurons, we need to keep this number small. The �rst step consists in removing redundant features. For instance �oating point operations can be dropped if the program does not perform any �oating point operation. This �ltering is done automatically when the model is trained, leaving on average 35 features. The resulting features will thus be speci�c for each program (but stay the same accross the di�erent versions of the same program). To further reduce the number of inputs, we apply a well known technique called PCA (Principal Components Analysis). PCA [3] is a linear transformation that transforms the data into a new coordinate system such that the greatest variance by any projection of the data comes to lie on the �rst coordinate (called �rst principal component), the second greatest on the second coordinate, and so on. In our setup, we keep only the main components that account for 95% of the total variance. In our case, the number of inputs is typically reduced to 5 using this technique.
5.
Transformation
1.31643 1.64141 1.29729 1.82053 1.84127 1.00001 2.04555 1.00396 1.12012 1.09078
EXPERIMENTAL SETUP
Loop unrolling (factor 1,2,3,4) FOR loop normalisation Non-perfectly nested loop conversion Break load constant instructions Common subexpression elimination Dead code elimination Hoisting of loop invariants IF hoisting Move loop-invariant conditionals Copy propagation
Table 3: The 13 transformations used to generate the 88000 versions of each program.
Despite the fact that those programs are relatively small compare to other benchmark suites, our approach can still be used on bigger programs. Bigger programs can be optimised locally, for instance on a per-function basis, and a predictor built for each individual function.
Transformations.
We consider source-to-source transformations available in the restructuring compiler SUIF 1 [13]. We have selected the transformations described in Table 3. As we (arbitrarily) consider four loop unroll factors, this increases the number of transformations considered to 13. We then exhaustively evaluated all transformations sequences of length 5 selected from these 13 options. There are 154440 possible transformation sequences since no transformation can appear twice in the sequence. However, since unrolling can only appear once in any sequence (only one possible unroll factor), it decreases the total number of possible sequences we evaluated to 88000 per benchmark.
Platform.
The Texas Instrument C6713 is a high-end �oating point DSP, running at 300MHz. This wide-clustered VLIW processor has 256KB of internal memory. The programs were compiled using the TI's Code Composer Studio Tools Version 2.21 compiler with the highest -O3 optimisation level and -ml3 �ag (generates large memory model code).
Statistical significance.
Training involves randomly selecting samples from the 88000 possible transformation sequences. In order to get a statistically signi�cant behaviour, we repeat this sampling 50 times. Thus, for each sample size, we show the average result over the 50 trials and, where appropriate, record the standard deviation. In addition to the training set, we need one execution of the baseline program to compute the relative speedups of subsequent transformations.
6.
EXPERIMENTAL RESULTS
This section provides a brief description of the programs, transformations and platforms used in our evaluation.
In this section we compare the quality of our scheme using the di�erent models proposed in Section 3.1 and against the di�erent regressors described in Section 3.2.
Benchmarks.
6.1
The UTDSP [18, 21] benchmark suite contains small, but compute-intensive DSP kernels as well as larger applications composed of more complex algorithms. The size of programs ranges from 20 to 500 lines of code. The programs used, listed in Table 2, represent widely used compute-intensive kernels from embedded applications.
Correlation coefficient
As shown in the motivation section, mae, though an important metric, is not a good measure at predicting the right shape or trend of the space. As we want to use the predictor to discriminate between good and bad transformed programs, we need a metric that captures the modelling accuracy of the shape of the space.
Coefficient of correlation 1
Correlation
Mean predictor adpcm compress edge detect fft fir histogram iir lmsfir lpc spectral est.
0.9 0.8 0.7 0.6
0.9 Features ANN h5 Features ANN h3 Features ANN h1 Features Linear
0.8 0.7 0.6
0.5
0.5
0.4
0.4
0.3
0.3
0.2
0.2
0.1 0.1 0 0 -0.1 1
2
3
4 5 6 sample size (power of 2)
7
8
9
-0.1 1
Figure 7: The correlation coe�cient of the Features ANN predictor with 5 hidden neurons. Correlation is plotted as a function of the training set size (logarithmic scale) on a per program basis. The mean predictor has constant 0 correlation.
2
3
4 5 6 sample size (power of 2)
7
8
9
8
9
(a) Correlation coe�cient. Standard deviation of the correlation 0.5 Features ANN h5 Features ANN h3 Features ANN h1 Features Linear 0.4
To analyse the quality of our models, we therefore use the correlation coe�cient. The correlation between two vari) ables is de�ned as ρX,Y = cov(X,Y , where σX and σY repreσX ·σY sent the standard deviation of variable X and Y respectively, and cov(X, Y ) is the covariance of variable X and Y . The correlation coe�cient only takes values between -1 and 1. The larger this value is, the stronger the relation between the two variables is (ignoring the sign). At the extreme, a correlation of 1 means that both variables are perfectly positively correlated; one variable can be expressed as the product of the other one (linear relation). A correlation of 0 means that there is no linear relationship between the two variables. Figure 7 shows how this coe�cient varies with the number of runs used to train the model for each program. The model used here is the features-based model using 5 hidden neurons, since it leads to the best average performance as we will see in the next section. Each line corresponds to a particular program and each point on that line corresponds to the correlation coe�cient for a given training set size. The x-axis is a logarithmic scale and given su�cient (29 = 512) training data, our predictor performs extremely well in all cases except adpcm. Even with smaller training sets (26 = 64) our scheme still performs well, with an average correlation coe�cient of .75. As expected the mean predictor performs badly across all benchmarks and is unsuitable as a means of distinguishing between fast and slow versions of the program.
6.2
Comparison of models
The previous section shows that our scheme performs well requiring only a few program runs plus the associated program features to accurately predict the performance of a large number of program variants. In this section we evaluate the di�erent models proposed in Section 3.1. Consider the diagram in Figure 8(a) which shows the correlation coe�cient for each of the di�erent models. Each line represents the performance of a particular model averaged across the entire benchmark suite. As before, each point describes the correlation coe�cient for a particular training set size (logarithmic scale). The Features ANN based
0.3
0.2
0.1
0 1
2
3
4 5 6 sample size (power of 2)
7
(b) Standard deviation of the correlation coe�cient.
Figure 8: Correlation coe�cient and its standard deviation for the di�erent features-based models, averaged across all benchmarks (50 runs per program), as a function of the training set size (logarithmic scale).
approaches outperform linear regression for small sample sizes, while linear regression improves in performance when it has greater than 25 = 32 training runs. However, the best feature based scheme across the entire training set size is the one using the ANN with 5 hidden neurons. With enough samples in the training set, the correlation coe�cient is greater than 0.8 across all benchmarks showing that this model is working extremely well. Given that each of these models is based on random samples from the transformation space (to build the training set), it is useful to know the standard deviation of each of the predictors. Clearly having a volatile predictor is not very useful. Figure 8(b) shows this standard deviation for varying training sample sizes (logarithmic scale). All schemes show decreasing standard deviation with increased sample size as expected. Again the ANN model that uses 5 hidden neurons outperforms all the other models with the smallest standard deviation.
6.3
Comparison of predictors
Figure 9 shows the comparison of our features-based pre-
Transformation
Loop unrolling (factor 1,2,3,4) Loop tiling (tile size 0,1,...,9) Splitting of deep FOR loops (0,1,...,9) Loop �attening For loop normalisation Turn imperfectly nested loops into perfectly nested loops Hoisting of loop invariants Move loop-invariant conditionals Guard FORs Induction variable detection Array padding (padding 0,1,...,9) Extract array upper bounds Improve array bound information Reconstruct explicit array reference Scalarise constant array references Aggressively scalarise constant array references Expression tree breakup (0,1,...,9) Reassociation Control simpli�cation Forward propagation Copy propagation Constant propagation Constant folding Bounds comparison substitution Common subexpression elimination Replace constant variables Reduction detection Privatisation Secularisation Dead code elimination Bit packing If hoisting Unstructured control �ow optimisation Replace call-by-reference Array Deliberation Form arrays Chain multiple array references Dismantle TREE_FORs Dismantle TREE_LOOPs Dismantle TREE_BLOCKs Dismantle array instructions Dismantle multi-way branches Dismantle non-constant FORs Dismantle TREE_FORs with spilled index variable Dismantle TREE_FORs with modi�ed index variable Dismantle empty TREE_FORs Dismantle TREE_BLOCKs with empty symbol table Lift call expressions Eliminate struct copies Eliminate sub-variables Globalise local static variables Global variable privatisation Put in explicit load/stores for non-local variables Eliminate enumeration types
Correlation 0.9 Features ANN h5 Sequence ANN h5 Reactions ANN h5 Mean predictor
0.8 0.7 0.6 0.5 0.4 0.3 0.2 0.1 0 -0.1 1
2
3
4 5 6 sample size (power of 2)
7
8
9
Figure 9: Comparison of the di�erent predictor averaged across all benchmarks. The correlation coe�cient as a function of the training set size (logarithmic scale).
dictor against the other predictors. As expected, the mean predictor has the worst correlation coe�cient. The predictor based on the encoding of the sequence as an input, needs approximatively 4 times as many samples or executions as our best scheme. The reactions-based approach [5] Reactions ANN 5 performs similarly (trained with 128 samples per program from the benchmark), independently of the training size. This behaviour can be explained by the fact that the training of the reactions-based model is done o�ine. The runs required from the program of interested are used to characterise it and not to train the model. Thus only a small number of runs is necessary. But even with the knownledge gains during the o�ine training phase on other programs, the reactions-based regressor perform worst than our features-based approach for more than 2 runs. This section shows that using program features allows the construction of good performance predictors. The next section evaluates their use in selecting good performance improving transformations.
7.
PREDICTING NEW SEQUENCES
One of the main advantages of using code features is the ability to predict the performance of new transformation sequences or hand-tuned code. In order to evaluate its use on unseen transformations, we randomly generated 500 different program versions generated using compositions of 54 di�erent transformations, listed in Table 4 of up to length 20. This new space, refered as large space in the motivation section, leads to approximately 1034 unique sequences of transformations. In order to �nd good tranformation sequences in the large space, we perform a search by using our features-based predictor (ANN 5 hidden neurons). The predictor is trained with a few samples from the small space described earlier. Using this predictor, we evaluate how it can be used to �nd good transformation sequences in the new large space.
7.1
Searching the space
Figure 10 shows the result obtained when our featuresbased predictor is used to search this large space. Predictors, built from di�erent amount of training data (8, 64,
Table 4: Transformations used in the large space. 512) from the small space, are shown in this diagram and compared against random search. The predictor is used to predict the speedups of all 500 program versions and order them based on their predicted speedup in decreasing order. Then, when the search occurs, the program version with the highest predicted speedup is executed, then the second best, and so on. As we see on this graph, the more samples we use during the training phase (8 vs 64 vs 512), the better the search results are. In the case where we have a model trained on 512 prior runs, we can achieve 70% of the available speedup in 10 runs, which takes over 40 random evaluations to achieve.
7.2
Threshold-based search
An alternative way of using the predictor to search the space consists of randomly searching within those points predicted to be within x% of the maximum. For instance, if we chose x = 1%, all the sequences whose prediction is within 1% of the maximum predicted value are candidates for search. The reason for doing this is apparent on reexamination of Figure 1 which shows several predicted maxima. Ordering the predictions by decreasing order and starting with the best one can cause the predictor to get stuck in one of those local maxima.
80
% of available improvement found
70 60 50 40 30 pred 512 pred 64 pred 8 random
20 10 0
10
20
30
40
50 60 evaluations
70
80
90
100
Figure 10: Searching the large space for good sequences. The predictor uses ANN with 5 hidden neurons and the training size has been varied between 8 and 512 samples. By keeping only the points within a given percentage of the maximum prediction, we �lter away poor predictions without getting stuck in local maxima. This assumes that the real maximum speedup value of the space lies within a few percent of the maximum prediction; Figure 11 shows this assumption holds. Again, three models with varying amounts of training data (8, 64, 512) are used to search the large space. For each model, the �rst approach denoted by the line pred 100st is shown. It performs well initially but fails to provide substantial improvement later on. The threshold-based schemes denoted by pred x% where x represents the threshold applied, show slightly worse initial performance but are able to sustain performance gains throughout the search. It seems that having this threshold set to 5% leads to the best trade o� and allows substantial improvement over the �rst method after only 20 runs. Obviously the choice of the strategy depends on the number of evaluations available. The more evaluations are allowed, the less tight the �lter needs to be. Overall, our schemes consistently deliver a good performance level 5× faster than the number of evaluations required by random search. It is interesting to note that a threshold of 100% corresponds to random search. This section shows that not only is our features-based predictive model good at predicting the performance of transformed programs, but it can also be used to �nd good new transformed programs when employed in a iterative search on a new transformation space.
8.
RELATED WORK
Most prior work has focused on predicting good optimisations rather than predicting optimisation performance some of which relies on program features -based characterisation of the programs. For instance, Monsifrot et al. [19], Stephenson et al. [22] and Agakov et al. [1] all use static loop nest features. Features may capture those characteristics of the static program that are best at predicting program transformations to apply. Cavazos et al. [4] describe using supervised learning to control whether or not to apply instruction scheduling. Monsifrot et al. [19] use a classi�er based on de-
cision tree learning to determine which loops to unroll: they looked at the performance of compiling Fortran programs from the SPEC benchmark suite using g77 for two di�erent architectures, an UltraSPARC and an IA64. Stephenson et al. [22] use machine learning to characterise the best unroll loop factor for a given loop nest, and improve over the ORC compiler heuristic. All of these approaches are successful in automatically generating compiler heuristics for code segments rather than in predicting the eventual performance of the selected optimisations for whole programs. Rather than predicting the impact of a single transformation, others have looked at searching [23, 12, 7, 2, 16, 20, 10, 11] for the best set or sequence of optimisations for a particular program. Cooper et al. [7] propose a number of algorithms to solve the compilation phase ordering problem. Their technique searches for the best phase order of a particular program. Such an approach gives impressive performance improvements, but has to be performed each time a new application is compiled. In contrast, our models are constructed on a training set of programs and can then be used to accurately predict the quality of unseen transformations. Kulkarni et al. [16] introduce techniques to allow exhaustive enumeration of all distinct function instances that would be produced from the di�erent phase-orderings of 15 optimisations. This exhaustive enumeration allowed them to construct probabilities of enabling/disabling interactions between the di�erent optimisation passes. Using these probabilities, they constructed a probabilistic batch compiler that dynamically determined which optimisation should be applied next depending on which one had the highest probability of being enabled. Fursin et al. [11] developed a technique to speed up program iterative optimisations using static multi-versioning of the most time consuming code sections, and low-overhead run-time phase detection scheme. This technique can speed up iterative search by several orders of magnitude and can be bene�cial during the training data generation stage of our models. Pan et al. [20] partitioned a program into tuning sections and then developed fast techniques to �nd the best combination of optimisations for each of these tuning section. They are able to reduce the time to �nd good optimisation settings from hours to minutes. Agakov et al. [1] build models of good transformation sequences from training data on a per program basis. This is then used to guide iterative search on a new program. Unlike this paper, they only attempt to predict good transformations to apply rather than predicting the performance impact of any particular transformation. Predicting performance is a signi�cantly more di�cult problem as it requires the precise capture of architecture behaviour. Although there has been little work in predicting performance of programs in an arbitrary transformation space, there has been related work performed in architecture design space exploration. Karkhanis et al. [15] propose an analytical model for hardware exploration that captures the key performance features of superscalar processors. This model can potentially be used for software exploration, but the construction of the model is ad hoc and a complex process, which makes it di�cult to generalise and replicate. Eeckhout et al. [8] use statistical simulation to similarly capture processor characteristics, and generate synthetic traces that
90
% of available improvement found
80 70 60 50 40 30 pred 100st pred 1% pred 5% pred 10% random
20 10 0
10
20
30
40
50 60 evaluations
70
80
90
100
90
90
80
80 % of available improvement found
% of available improvement found
(a) 64 training samples.
70 60 50 40 30 pred 100st pred 1% pred 5% pred 10% random
20 10 0
10
20
30
40
50 60 evaluations
70
80
70 60 50 40 30 pred 100st pred 1% pred 5% pred 10% random
20 10 90
100
0
(b) 8 training samples.
10
20
30
40
50 60 evaluations
70
80
90
100
(c) 512 training samples.
Figure 11: Each graph shows the predictor trained with a di�erent amount of training data. Each line corresponds to the performance of the corresponding search technique. are later run on a simpli�ed superscalar simulator. After any program transformation, a new trace (requiring a full functional simulation) needs to be generated if this approach were to be used for software exploration. Thus, this approach is not suitable for software exploration. Recently Ipek [14] has proposed a distinct method for both considerably speeding up and automating the hardware design-space exploration process. The idea is to train an ANN to predict the impact of hardware parameter variations (e.g., cache size, memory latency, etc) on the performance behaviour of a target architecture. After training on less than 5% of the design space, the model can accurately predict performance variations with less than 2% error. Though as we noted earlier this does not mean it is discriminating and should be compared against a mean predictor. Also, any modi�cation of the program binary, such as applying a program transformation, requires training a new model using several thousands simulations. As a result, this approach is also not suitable for software exploration. Our approach similarly relies on machine learning to build a
performance model, but it can accommodate any new program transformation without retraining.
9.
CONCLUSION AND FUTURE WORK
This paper has shown that it is possible to automatically derive a performance predictor for tuning programs. By using program features we have shown that such predictors can be constructed using machine learning based approaches. Unlike previous approaches, we require only a few training runs per program and no prior training on a benchmark suite. In addition, the predictor is not restricted to previously seen transformations. By incorporating our featuresbased approach with a single hidden layer ANN we show that high level of predictive accuracy is achievable. Furthermore, we show that such a predictor can be used to �nd good transformation sequences in an unseen transformation space. Future work will combine our technique with architectural performance prediction allowing automatic performance prediction of the compiler/architecture co-design space.
10.
REFERENCES
[1] F. Agakov, E. Bonilla, J. Cavazos, B. Franke, G. Fursin, M.F.P. O'Boyle, J. Thomson, M. Toussaint, and C.K.I. Williams. Using machine learning to focus iterative optimization. In Proceedings of the International Symposium on Code Generation and Optimization (CGO), pages 295�305, 2006. [2] L. Almagor, K.D. Cooper, A. Grosul, T.J. Harvey, S.W. Reeves, D. Subramanian, L. Torczon, and T. Waterman. Finding e�ective compilation sequences. In Proceedings of the Conference on Languages, Compilers, and Tools for Embedded Systems (LCTES), pages 231�239, 2004. [3] C. Bishop. Neural Networks for Pattern Recognition. Oxford University Press, 2005. [4] J. Cavazos and J. Eliot, and B. Moss. Inducing heuristics to decide whether to schedule. In Proceedings of the ACM SIGPLAN Conference on Programming Language Design and Implementation (PLDI), pages 183�194, 2004. [5] J. Cavazos, C. Dubach, F. Agakov, E. Bonilla, M.F.P. O'Boyle, G. Fursin, and O. Temam. Automatic performance model construction for the fast software exploration of new hardware designs. In Proceedings of CASES, pages 24�34, 2006. [6] K.D. Cooper, A. Grosul, T.J. Harvey, S. Reeves, D. Subramanian, L. Torczon, and T. Waterman. Searching for compilation sequences. Tech. report, Rice University, 2005. [7] K.D. Cooper, A. Grosul, T.J. Harvey, S. Reeves, D. Subramanian, L. Torczon, and T. Waterman. Acme: adaptive compilation made e�cient. In Proceedings of the Conference on Languages, Compilers, and Tools for Embedded Systems (LCTES), pages 69�77, 2005. [8] L. Eeckhout, R.H. Bell Jr., B. Stougie, K.D. Bosschere, and L.K. John. Control �ow modeling in statistical simulation for accurate and e�cient processor design studies. In Proceedings of the International Symposium on Computer Architecture (ISCA), pages 350�363, 2004. [9] A. Epshteyn, M. Garzaran, G. DeJong, D. Padua, G. Ren, X. Li, K. Yotov and K. Pingali. Analystic Models and Empirical Search: A Hybrid Approach to Code Optimization, In Languages and Compilers for Parallel Computing (LCPC), 2005. [10] G.C. Fursin, M.F.P. O'Boyle, and P.M.W Knijnenburg. Evaluating Iterative Compilation. In Proceedings of the 15th Workshop on Languages and Compilers for Parallel Computing (LCPC), pages 305�315, 2002. [11] G. Fursin, A. Cohen, M.F.P. O'Boyle, and O. Temam. A Practical Method For Quickly Evaluating Programs Optimizations. In Proceedings of the 1st International Conference on High Performance Embedded Architectures & Compilers (HiPEAC), pages 29�46, 2005 [12] B. Franke, M.F.P. O'Boyle, J. Thomson, and G. Fursin. Probabilistic source-level optimization of embedded programs. In Proceedings of the Conference on Languages, Compilers, and Tools for Embedded Systems (LCTES), pages 78�96, 2005.
[13] M. Hall, L. Anderson, S. Amarasinghe, B. Murphy, S.W. Liao, E. Bugnion, and M. Lam. Maximizing multiprocessor performance with the SUIF compiler. IEEE Computer, V. 29, I. 12, pages 84�89, 1999. [14] E. Ipek, S.A. McKee, B.R. de Supinski, M. Schulz, and R. Caruana. E�ciently Exploring Architectural Design Spaces via Predictive Modeling. In Proceedings of the 12th international conference on Architectural support for programming languages and operating systems, (ASPLOS-XII), pages 195�206, 2006. [15] T. Karkhanis, and J.E. Smith. A �rst-order superscalar processor model. In Proceedings of the International Symposium on Computer Architecture (ISCA), pages 338�349, 2004. [16] P. Kulkarni, W. Zhao, H. Moon, K. Cho, D. Whalley, J. Davidson, M. Bailey, Y. Paek, and K. Gallivan. Finding e�ective optimization phase sequences. In Proceedings of the Conference on Languages, Compilers, and Tools for Embedded Systems (LCTES), pages 12�23, 2003. [17] K. Karuri, M. A. Al Faruque, S. Kraemer, R. Leupers, G. Ascheid, H. Meyr. Fine-grained application source code pro�ling for ASIP design. In Proceedings of the 42nd annual conference on Design automation (DAC), pages 329�334, 2005. [18] C. Lee. Utdsp benchmark suite. In http://www.eecg.toronto.edu/~corinna/ DSP/infrastructure/UTDSP.html, 1998. [19] A. Monsifrot, F. Bodin, and R. Quiniou. A machine learning approach to automatic production of compiler heuristics. In Proceedings of the International Conference on Arti�cial Intelligence: Methodology, Systems, Applications, LNCS 2443, pages 41�50, 2002. [20] Z. Pan, and R. Eigenmann. Fast automatic procedure-level performance tuning. In Proceedings of the 15th international conference on Parallel architectures and compilation techniques PACT, pages 173�181, 2006. [21] M. Saghir, P. Chow, and C. Lee. A comparison of traditional and vliw dsp architecture for compiled dsp applications. In Proceedings of the International Workshop on Compiler and Architecture Support for Embedded Systems (CASES), 1998. [22] M. Stephenson and S.P. Amarasinghe. Predicting unroll factors using supervised classi�cation. In Proceedings of International Symposium on Code Generation and Optimization (CGO), pages 123�134, 2005. [23] S. Triantafyllis, M. Vachharajani, N. Vachharajani, and D.I. August. Compiler optimization-space exploration. In Proceedings of the International Symposium on Code Generation and Optimization (CGO), pages 204�215, 2003. [24] T.F. Wenisch, R.E. Wunderlich, B. Falsa�, and J.C. Hoe. Turbosmarts: accurate microarchitecture simulation sampling in minutes. In Proceedings of the ACM SIGMETRICS, pages 408�409, 2005. [25] R.E. Wunderlich, T.F. Wenisch, B. Falsa�, and J.C. Hoe. Smarts: Accelerating microarchitecture simulation via rigorous statistical sampling. In Proceedings of the International Symposium on Computer Architecture (ISCA), pages 84�95, 2003.