Fast Image Segmentation Using Two-Dimensional Otsu Based on
Recommend Documents
Two Modified Otsu Image Segmentation Methods. Based On Lognormal And Gamma Distribution. Models. Duaa H. AlSaeed. â,ââ. , Ahmed Bouridane. â,ââ.
Keywords: Clustering, Colour image segmentation, Mean shift, Histological ... The framework of histological image segmentation based on the proposed ..... Lee W, Roysam B. Improved automatic detection and segmentation of cell nuclei in ... skeletal m
pilation of visual assets is also one of the major bottlenecks. â [email protected]. â¡ [email protected] ... formats are typically specified on fixed size N Ã M texel.
tracking, automated manufacturing and mobile robotics. ... and nearest neighbor classification provide good results in terms of ... soccer for instance, where features of the environment .... This is typically an expensive opera- tion that can ...
Abstract. We introduce a fast, multiscale algorithm for data clustering, which we apply to image segmentation as an example. Our algorithm uses modern ...
Departamento de Ciência da Computação. Núcleo de Processamento Digital de Imagens. Caixa Postal 702, 31270-010 Belo Horizonte, MG, Brazil. {arnaldo ...
ages, one can prefer to analyze clusters by non-parametric classifiers [2]. A family of .... by the non-contextual labeling; for any image pixel x: S(x) = ci(x) with i(x) ...
We propose a graph theoretical algorithm for image segmentation which pre- .... Contraction: If T â T is a tree, then we can contract it to a single vertex and.
many image/video applications, such as computer vision, image analysis ... Concise region representation which is consistent with human visual ... 1 Introduction. Image .... threshold (c) Region Merge using JND criterion (more consistent.
Email: [email protected]. Abstract—This paper proposes perceptual segmentation of ... Carson et al. [4] proposed the. Blobworld representation based on ...
ABSTRACT: In this work we present a new proposal for image segmentation ... noise, anchored pixels may appear in the contour and a correct final location is ...
Let C(Ri Rj) be the watershed contour be- ... computation of watershed contour dynamics can be done ... fpi j1 pi j2 ::: pi j Ng be a the wateshed countour be-.
camera-driven user interfaces and robotics applications. 1. ... first initializing for each pixel a corresponding single-pixel ... weight each edge E â E using a weighting function w(·). .... Ek,l if and only if the corresponding triangles Tk and
Keywords: stereo correspondence, multi-view stereo, segmentation, image-based rendering. 1. Introduction. Stereo is a fundamental problem in computer vision ...
Another approach is to use a set of constant thresh- olds defining a color class as a rectangular block in the color space (Jain, Kasturi, & Schunck 1995). This ap-.
Dec 24, 2007 - J. C. Goswami is Principal Engineer at Schlumberger Technology Center, Sugar Land, TX - 77478, USA. He was a Professor at IIT Kharagpur.
Approximate Surface Reconstruction and Region Growing. Dirk Holz and ... Using the. Microsoft Kinect camera at a resolution of 160Ã120, we can compute full.
dark zones uses the closing and the identity as primitives. To select the primitives, a contrast criterion given by the connected tophat transfor- mation is proposed.
International Journal of Advances in Science and Technology,. Vol. 2, No.3, 2011 ..... He has completed his Bachelors in Computer Science and. Engineering ...
Outdoor Scene Image Segmentation Based On Background.pdf. Outdoor Scene Image Segmentation Based On Background.pdf. Open
Keywords: Image segmentation, complex networks, community detection, modularity .... as the inter-community links are aggregated and represented as links ...
Diagnosing ALL begins with a medical history, physical examination, complete blood count and bone .... Malignancies, Stanford Medicine Website, available at.
segmentation scheme based on fuzzy color similarity measure to segment out ... approach based on the HLS color coordinate system. We first design a set of fuzzy ..... cyan, red, magenta) and seventeen tone modifiers. Hue angle of red is 0 ...
Fingerprint image segmentation is an important pre-processing step in automatic fingerprint recognition system. A well-designed fingerprint segmentation ...
Fast Image Segmentation Using Two-Dimensional Otsu Based on
Aug 2, 2017 - Firstly, in order to enhance the performance of image segmentation, the guided filtering is employed to improve neighborhood image template ...
Hindawi Journal of Electrical and Computer Engineering Volume 2017, Article ID 1735176, 12 pages https://doi.org/10.1155/2017/1735176
Research Article Fast Image Segmentation Using Two-Dimensional Otsu Based on Estimation of Distribution Algorithm Wuli Wang,1,2,3 Liming Duan,1,2 and Yong Wang4 1
1. Introduction Image segmentation is the technology and process of segmenting an image into multiple segments with characteristics and extracting regions of interest, and it is the basis of image analysis. The quality of image segmentation directly affects the results of the subsequent image processing [1]. Image segmentation methods mainly include threshold method [2, 3], edge detection method [4], region method [5], graph cut method [6], clustering method [7–12], and machine learning based method [13–15]. In recent years, machine learning, especially the deep learning represented by convolution neural networks (CNN), has captured more attention in image segmentation [15–19]. However, such methods require a multitude of annotated images as samples for training, which is a very time-consuming. In addition, in practice, a small amount of real images as training sample, such as dozens of computed tomography (CT) scanning images, is unable to achieve the desired results.
Threshold technique is simple and effective for image segmentation, which has been widely used in computer vision and pattern recognition. There are several popular threshold methods including Otsu, maximum entropy, minimum cross entropy, and histogram [20, 21]. Compared to other threshold segmentation methods, Otsu is the most popular for grayscale image segmentation [22]. In order to enhance the performance of the classical Otsu, a series of improvements have been proposed [23–26]. However, those improved Otsu methods still only use the one-dimensional gray histogram of image without considering the spatial information of image, which is similar to the classical Otsu method. When the image is affected by noneven brightness, noise, and other factors, the result of image segmentation is not ideal, even incorrect. For this reason, Liu and Li [27] extended the Otsu from one dimension to two dimensions and proposed an Otsu method based on two-dimensional gray histogram. By combining the pixel information with the spatial correlation information between the pixel and its neighborhood, the
2
L−1 The neighbor image grayscale
proposed method is able to provide better segmentation results than one-dimensional Otsu. Nevertheless, the twodimensional Otsu enlarges the search space into two dimensions, which increases the complexity of the algorithm and expands the computational cost with exponential growth. Consequently, some fast algorithms have been proposed, one of which is the introduction of artificial intelligence algorithm. The intelligent search strategy is employed to speed up solving the global optimal threshold instead of exhaustion method. Sun [28] and Deng et al. [29] applied the genetic algorithm to image segmentation based twodimensional Otsu, which improves the efficiency of algorithm to some extent but fails to address the premature convergence problem of genetic algorithm. The two-dimensional Otsu based artificial fish swarm algorithm [30] is not sensitive to the selection of initial value and parameter, robust, simple, and easy to implement, but easy to fall into local optimum and low convergence accuracy. Tang et al. [31] and Guo et al. [32] introduced the particle swarm algorithm into the method of image segmentation based on the two-dimensional Otsu. Although the algorithm manifests simple, easy to operate, and general characteristics, the diversity of particles disappears rapidly when the selection of the parameter or the population size is not appropriate. And the above defects of the algorithm can lead to precocious and fall into local optimum. Sun et al. [33] adopted a method of image segmentation using twodimensional Otsu based on simulated annealing algorithm, which shows its superiority in searching the global minimal solution but also has the disadvantage of slow convergence speed. The above-mentioned two-dimensional Otsu methods based on intelligent algorithm enhance the calculation efficiency of two-dimensional Otsu to a certain extent. However, the sum of probabilities of target and background on the main diagonal of two-dimensional histogram is still approximately 1, which is similar to the traditional two-dimensional Otsu. This approximation has been proved to be incompatible with the real image by Fan and Zhao [34] and Wu et al. [35]. And the curve and oblique methods based on two-dimensional Otsu were, respectively, proposed to get a satisfying effect of image segmentation, but the applicability of these two methods is poor [36]. Furthermore, the existing two-dimensional Otsu methods employ the mean filtering template to construct two-dimensional histogram, which loses the edges and detailed features of the neighborhood image and influences the effect of image segmentation. In this paper, in order to improve the effect of segmentation and reduce computational cost of two-dimensional Otsu algorithm, a novel fast image segmentation method using two-dimensional Otsu based on estimation of distributed algorithm is proposed. Firstly, to obtain the approving performance of image segmentation, the guided filtering is employed to improve neighborhood image template instead of the mean filtering. Moreover, the probabilities of the target and background in two-dimensional histogram are exactly calculated to get more accurate threshold. Finally, in order to segment the image quickly and accurately, the estimation of distribution algorithm [37] with outstanding searching ability and fast convergence speed is applied to find the optimal segmentation threshold.
Journal of Electrical and Computer Engineering
II
III
I
IV
s
0
t L−1 The original image grayscale
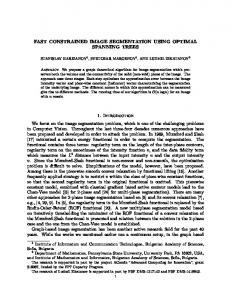
Figure 1: Two-dimensional histogram.
2. Improvements to Method of Two-Dimensional Otsu The method of two-dimensional Otsu applies the twodimensional histogram comprising the image gray and its neighborhood image average gray to find the optimal threshold and then divides the image into the target and background. The main diagonal regions I and III of the two-dimensional histogram denote, respectively, the target and background; the subdiagonal regions II and IV present severally the edge and noise, as shown in Figure 1. Under the method of traditional two-dimensional Otsu, the sum of probabilities of the target and background is approximate to 1, and the sum of probabilities of the edge and noise is approximate to 0. This approximation is only satisfied under certain conditions, which has been confirmed in theory and experiment by the literatures [34–36]. The accuracy of image segmentation is low when the approximation is not true. In addition, the neighborhood image is obtained by a mean filtering template under the method of traditional twodimensional Otsu, which can effectively eliminate the Gaussian noise of image but also obscure the edge and detailed features of image and affect the performances of image segmentation. Therefore, in order to enhance the performances of image segmentation, the traditional two-dimensional Otsu is improved from two aspects: using the guided filtering to build a new neighborhood template and accurately calculating the probabilities of the target and background. 2.1. Construction of Neighborhood Template Based on Guided Filtering. In order to enhance the effect of image segmentation under two-dimensional Otsu method, we introduce the guided filtering to improve the neighborhood template, which can preferably preserve features of the edge and details [38]. The guided filtering is a filtering method that restrains the details of image and is similar to the bilateral filtering. However, compared with the bilateral filtering, the perform-
Journal of Electrical and Computer Engineering
3
ance of guided filtering is better and the algorithm is faster. It can be regarded as a local linear model, defined as 𝑞𝑖 = ∑𝑊𝑖𝑗 (𝐼) 𝑝𝑗 , 𝑗
(1)
where 𝐼 represents the guided image, 𝑝 denotes the input image, 𝑞 stands for the output image, 𝑖, 𝑗 is the index of the pixel, and 𝑊𝑖𝑗 (𝐼) is the filter kernel function, and defined as 𝑊𝑖𝑗 (𝐼) =
2.2. Exact Calculation of the Two-Dimensional Otsu Step 1. Construct two tuples according to the gray values of original image and the filtered neighbor image by the guided filtering, denoted as the gray value of original image and the gray value of neighbor image. If the frequency of two tuples (𝑖, 𝑗) is expressed as 𝑓𝑖𝑗 , then the corresponding joint probability density can be defined as
𝑖 ⋅ 𝑝𝑖𝑗
𝑠
𝑡
∗ ∗ 𝜇∗1 = (𝜇1𝑖 , 𝜇1𝑗 )
(2)
where 𝜔𝑘 is the 𝑘th window of kernel function, |𝜔| is the number of pixels in the window, 𝜇𝑘 and 𝜎𝑘2 denote the mean value and the variance of a window in 𝐼, and 𝜀 is the smoothing factor. Here, the local window radius is set to 2, the value of 𝜀 is set to 0.04, and then the number of pixels in the window is |𝜔| = (2 × 𝑟 + 1)2 = 25. A new neighborhood template can be constructed by using the guided filtering with preserving the edge and details of image instead of the mean filtering, which can preferably construct the image two-dimensional histogram and advance the performance of image segmentation.
The improved two-dimensional Otsu algorithm suffers from a high computational cost. Consequently, we introduce the estimation of distribution algorithm with favorable global convergence ability and high computation efficiency to find the optimal segmentation threshold (𝑇∗ , 𝑆∗ ).
3. Fast Image Segmentation Using Two-Dimensional Otsu Method Based on Estimation of Distribution Algorithm As a new type of optimization algorithm in the field of evolutionary computation, the estimation of distribution
4
Journal of Electrical and Computer Engineering
algorithm proposes a new evolutionary model [39]. There are no genetic operations such as crossover and mutation in the estimation of distribution algorithm, which is different from the traditional evolutionary algorithm. The estimation of distribution algorithm predicts the best searching region according to sampling and statistical learning for searching space and generates the optimal new individual. The algorithm using the macrolevel evolution method based on search space has superior global search ability and positive convergence rate [38]. The two-dimensional Otsu method searches the optimal combination of image threshold and neighborhood image threshold in the global range, and the two variables are independent of each other. Accordingly, the variable independent estimation of distribution algorithm is employed to solve the optimal segmentation threshold in the two-dimensional Otsu. The gray value of a pixel in the image and a pixel in its neighborhood image is represented by the individual 𝑋 = (𝑥1 , 𝑥2 ), where the ranges of 𝑥1 and 𝑥2 are 0 to 255. The 𝑖th 𝑔 𝑔 𝑔 individual in the 𝑔th generation is denoted as 𝑋𝑖 = (𝑥𝑖1 , 𝑥𝑖2 ), the population size is indicated by the PopSize, and the largest generation of evolution is expressed by the MaxGen. The flowchart of image segmentation using two-dimensional Otsu based on estimation of distribution algorithm is shown in Figure 2, and the concrete steps are as follows. Step 1 (initialize the population). The current evolutionary generation 𝑔 is initialized to 1, and the initial population is obtained by random sampling referring to the literature [40]: Popul1 = {𝑋𝑖1 | 𝑖 = 1, 2, . . . , PopSize} .
(10)
Step 2 (calculate the individual fitness). The trace of interclass dispersion matrix is regarded as the fitness function, as seen 𝑔 𝑔 in (8). Firstly, let 𝑡 = 𝑥𝑖1 , 𝑠 = 𝑥𝑖2 in (8), and calculate fitness 𝑔 value fitnessX𝑖𝑔 of individual 𝑋𝑖 in the 𝑔th generation. Then similar method is applied to calculate the fitness values of other individuals in the 𝑔th generation. Finally, the fitness values of all individuals are obtained: Fitn𝑔 = {fitnessX𝑖𝑔 | 𝑖 = 1, 2, . . . , PopSize} .
(11)
Step 3 (obtain the optimal fitness and the best individual). Calculate the optimal fitness BestFitn𝑔 = Max(Fitn𝑔 ), and 𝑔 the corresponding individual is the best individual 𝑋best = 𝑔 𝑔 (𝑥best1 , 𝑥best2 ) in the population. Step 4 (determine whether the termination condition is satisfied). If the evolutionary generation 𝑔 is not greater than MaxGen, then Step 5 is performed; otherwise, the optimization process is terminated, and the optimal fitness MaxGen are obtained; BestFitnMaxGen and the best individual 𝑋best Step 9 is performed. Step 5 (select the individual for establishing probability model). In order to ensure that the probability model is sensitive to the search process, the individual who is used to construct the probability model must be able to accurately track the information of probability model. For the sake of preventing the algorithm into local optimal, the individual selection
Start
Initialize the population
Calculate the individual fitness
Calculate the optimal fitness and the optimal individual in this generation
Termination condition is satisfied
Yes
No Select the individual for establishing the probability model
Image segmentation
Establish the probability model
End
Obtain the new population according to sampling Obtain a diversity of population by replacing some of the individuals
Figure 2: Flowchart of image segmentation using two-dimensional Otsu based on estimation of distribution.
should have a certain randomness. Roulette is a proportion of random selection method. On the one hand, in order to ensure the tracking accuracy of probability model, the individual is selected according to the probability of alleles per gene bit. On the other hand, this method does not guarantee that the allele of large probability must be selected and has a certain randomness. In this paper, when the fitness value is the largest, the optimal segmentation threshold is obtained. Therefore, the roulette selection method based on fitness is adopted; that is, the probability that each individual is selected is proportional to its fitness. The specific steps are as follows: (1) Calculate the relative fitness of each individual fitnessX𝑖𝑔 / ∑ fitnessX𝑖𝑔 , denoted as 𝑝𝑘 , where 𝑘 = 1, 2, . . . , PopSize and ∑ 𝑝𝑘 = 1. (2) According to relative fitness 𝑝𝑘 , the disc is divided into PopSize copies, where the central angle of the 𝑘th fan is 2𝜋𝑝𝑘 . (3) Simulate the roulette operation, that is, to generate a random number between 0 and 1. If 𝑝1 + 𝑝2 + ⋅ ⋅ ⋅ + 𝑝𝑘−1 < 𝑟 and 𝑟 < 𝑝1 + 𝑝2 + ⋅ ⋅ ⋅ + 𝑝𝑘 , then individual 𝑔
𝑔
𝑋𝑘 is selected, denoted as 𝑋1 . (4) Repeat step (3) until the PopSize excellent individuals 𝑔 {𝑋𝑖 | 𝑖 = 1, 2, . . . , PopSize} have been obtained.
Journal of Electrical and Computer Engineering
5
Step 6 (establish the probability model). Firstly, construct the Gaussian distribution function according to the excellent individual selected by Step 5. Then, calculate the mean and standard deviation of the first variable for all individuals: 𝑔 𝑋1
𝑔
𝑋𝑖1 =∑ , PopSize
𝑔
𝜎1 = ∑
𝑔 (𝑋𝑖1
−
2 𝑔 𝑋1 )
PopSize
(12) ,
𝑔
where 𝑖 = 1, 2, . . . , PopSize. Mean 𝑋2 and standard deviation 𝑔 𝜎2 of the second variable of all individuals are calculated in a similar manner. The probability distribution function can be expressed as follows: 𝑔
𝑔
𝑔
𝑔
𝑥1 ∼ 𝑁 (𝑋1 , 𝜎1 ) , (13)
𝑥2 ∼ 𝑁 (𝑋2 , 𝜎2 ) . Step 7 (obtain the new population by sampling). The sampling method depends on the probability model used by the algorithm. Therefore, the next generation population is generated on the basis of the constructed Gaussian distribution function: 𝑔+1
Popul𝑔+1 = {𝑋𝑖
| 𝑖 = 1, 2, . . . , PopSize} .
(14) 𝑔+1
The individual of the population is denoted as X𝑖 𝑔+1 𝑔+1 (𝑥𝑖1 , 𝑥𝑖2 ),
where
𝑔+1 𝑥𝑖1
∼
𝑔 𝑔 𝑁(𝑋1 , 𝜎1 ),
𝑔+1 𝑥𝑖2
∼
𝑔 𝑔 𝑁(𝑋2 , 𝜎2 ).
=
Step 8 (establish the diverse population). In order to enhance the diversity of population and avoid the excessive effect on the population, in the first place, 𝑝 individuals are randomly removed from the current population, where 𝑝 = round(PopSize/10) and round(𝑥) represents an integer that is closest to 𝑥. Then, the optimal 𝑝 individuals in the previous population are appended to the current population to establish a diverse population. Finally, return to Step 2 and recalculate the fitness of each individual. Step 9 (image segmentation). On the basis of the optimal MaxGen MaxGen , 𝑆∗ = 𝑥best2 obtained by Step 4, threshold 𝑇∗ = 𝑥best1 the two-dimensional Otsu method is employed to segment the image.
4. Experimental Results and Analyses In order to evaluate the performance of image segmentation and the efficiency of the proposed method, a large number of industrial computed tomography (CT) images of different mechanical parts and many images from popular image segmentation dataset are used to test. Extensive experimental results are compared with the results of the following approaches, that is, Otsu, 2D Otsu [27], 2D Otsu-GA [29], 2D Otsu-FSA [30], LCK [10], LSD [11], and ME + PPD [3], quantitatively and qualitatively.
4.1. Comparisons of Segmentation on Real Image. Figure 3 shows the results of image segmentation regarding five real industrial CT images with Gaussian noise under different methods. The cylinder head, carburetor, nuts, aluminum part, and bearing are arranged from left to right; the original image, the results of the traditional two-dimensional Otsu, the results of the 2D Otsu-FSA, the results of the 2D Otsu-GA, and the results of our method are distributed from top to bottom. In order to compare objectively the performances of the above methods, the population size of genetic algorithm, fish swarm algorithm, and estimation of distribution algorithm are set to 20, and evolutionary generations (or optimization times) are set to 50. The experimental results are shown in Figure 3. For industrial CT images of the nuts and bearing with clear boundary and large target and background discrimination, the above methods can preferably segment the target and background, and the effect is preferable. However, for industrial CT images of the cylinder head, carburetor, and aluminum part with relative blurred boundary, there is a certain gap in the segmentation effects of each method. For the cylinder head image, the traditional two-dimensional Otsu is poor for the detail at the upper right corner of image, and the 2D Otsu-FSA and the 2D Otsu-GA lose the details at the upper right corner and the upper left corner of image, which is inconsistent with the original image. For the carburetor image, we can intuitively see that the detailed features at the bottom of image are lost after the traditional two-dimensional Otsu, the 2D Otsu-FSA, and the 2D Otsu-GA. For the aluminum part image, the traditional two-dimensional Otsu and the 2D Otsu-GA process incorrectly a noise at the upper right of image as a target. Though the noise is well processed by the 2D Otsu-FSA, the detailed feature (i.e., hole) above the left image is lost. The segmentation result of the 2D Otsu-GA also lost the detail, that is, the hole. It can be seen the proposed method can preferably preserve the details of original images with blurred boundary from the last line in Figure 3. 4.2. Comparisons of Computational Cost on Real Image. The computational cost of two-dimensional Otsu based on intelligent algorithm is mainly reflected in calculation of the fitness of individual. In the case of the same population size, the computational cost of different algorithms are qualitatively evaluated by comparing the evolutionary generation of population when the algorithms reach convergence state. The maximum fitness convergence curves of the aluminum part are obtained by using two-dimensional Otsu methods based on intelligent algorithm, as shown in Figures 4–6. The 2D Otsu-FSA: if the population size 𝑛 is equal to 10, the fitness is convergent until the number of iterations is about 40. If the population size 𝑛 is equal to 20, the fitness is convergent when the number of iterations is about 22. If the population size 𝑛 is equal to 30, the fitness has converged when the number of iterations is close to 12. The 2D Otsu-GA: if the population size 𝑛 is equal to 10, the fitness is convergent when the number of iterations is about 45. However, the fitness of the algorithm is obviously fluctuant in the process of convergence, which reflects the evolutionary disorder affected by variant randomness under the genetic algorithm.
Journal of Electrical and Computer Engineering
Our method
2D Otsu-GA
2D Otsu-FSA
2D Otsu
Original image
6
Cylinder head
Carburetor
Nuts
Aluminum part
Bearing
Figure 3: Segmentation effect of various methods for different images.
If the population size 𝑛 is equal to 20, the fitness is convergent when the number of iterations is about 35. If the population size 𝑛 equals 30, the fitness is convergent when the number of iterations is about 25. Our method: if the population size 𝑛 equals 10, 20, or 30, the fitness has converged when the number of iterations is only about 25, 10, or 3. In addition, the results of the proposed method are stable after convergence. According to the above experimental results and analyses, for solving the optimal threshold of two-dimensional Otsu, the estimation of distribution algorithm requires fewer population size and few number of iterations than the genetic
algorithm and the fish swarm algorithm. In other words, the estimation of distribution algorithm can effectively reduce the computational cost. Moreover, in order to compare the efficiencies of the proposed method and the existing methods, objectively and precisely, the mean time of image segmentation under different methods is counted. Table 1 illustrates the mean time of 10 segmentations for 5 industrial CT images. According to the data in Table 1, the speed of the proposed method is about 10, 5, and 3 times faster than the traditional two-dimensional Otsu, 2D Otsu-FSA, and 2D Otsu-GA, respectively.
7
×104 2.24492
×104 2.2450
2.24490
2.2449
2.24488
2.2448 Fitness
Fitness
Journal of Electrical and Computer Engineering
2.24486
2.2447
2.24484
2.2446
2.24482
2.2445
2.24480
0
5
10
15
20 25 30 Iterations
35
40
45
2.2444
50
0
5
10
15
(a) 𝑛 = 10
20 25 30 Iterations
35
40
45
50
(b) 𝑛 = 20
×10 2.24492
4
2.24490
Fitness
2.24488 2.24486 2.24484 2.24482 2.24480 2.24488
0
5
10
15
20 25 30 Iterations
35
40
45
50
(c) 𝑛 = 30
Figure 4: The highest fitness convergence curve based on 2D Otsu-FSA.
Table 1: Comparison of segmentation time under different methods (s). Image
Our method
Traditional 2D Otsu
2D Otsu-FSA
2D Otsu-GA
Cylinder head Carburetor
0.23 0.28
2.53 2.66
1.25 1.31
0.92 0.97
Nuts Aluminum part
0.24 0.30
2.58 2.71
1.27 1.39
0.94 1.02
Bearing
0.29
2.68
1.37
0.99
4.3. Comparisons of Segmentation on Image Dataset. In this section, we compare our method with Otsu, 2D Otsu, 2D Otsu-FSA, 2D Otsu-GA, ME + PPD, LCK, and LSD on a host of images that come from popular image datasets. As an example, we select a grain image and a tire image from
the general image library, a duck image and a bird image from the BSD500 image dataset, and a motorcycle image from the VOC image dataset to demonstrate the comparative results, as illustrated in Figure 7. For rice grains image, our method can preferably retain the completeness of rice grains.
8
Journal of Electrical and Computer Engineering ×104 2.24494
×104 2.24492
2.24492
2.24490
2.24490
2.24488 Fitness
Fitness
2.24488 2.24486
2.24486 2.24484
2.24484 2.24482
2.24482
2.24480
2.24480 2.24478
0
5
10
15
20 25 30 Iterations
35
40
45
50
2.24478
0
5
10
15
(a) 𝑛 = 10
20 25 30 Iterations
35
40
45
50
(b) 𝑛 = 20
×10 2.24492
4
Fitness
2.24490
2.24488
2.24486
2.24484
2.24482
0
5
10
15
20 25 30 Iterations
35
40
45
50
(c) 𝑛 = 30
Figure 5: The highest fitness convergence curve based on 2D Otsu-GA.
Especially at the bottom of the image, it can better preserve the structural characteristics of rice grains and segment the target from the background. Fortunately, LCK and LSD can also detect the target efficiently. However, these two methods require a high computational cost. With regard to the tire image segmented by the proposed method, the contour details of eight axis are clear; the edges between the inner and outer rings of the tire are favorable. Moreover, the middle four screws are very easy to identify and have only a small black background. For the duck image with simple background, each of above-mentioned methods can obtain a promising result. However, the proposed method can preferably preserve the details, such as the mouth and tail. Compared with 2D Otsu, 2D Otsu-FSA, ME + PPD, and LSD, our method can preferably extract the edges of target on the bird image. Furthermore, our method can more accurately segment out the claw comparing with Otsu, 2D Otsu-GA, ME + PPD, LCK, and LSD. For the motorcycle image with complex contour and scene, the proposed method is favorable on the
details, such as the rearview mirror and support and rear seat. ME + PPD and LCK obtain a preferable performance of the global segmentation. Nevertheless, LCK is time-consuming. The computational costs of the above methods on the five images in Table 2 are also measured. From this table, we can see that the computational cost of our method is lower than the other methods except Otsu. However, Otsu’s segmentation results are not very good.
5. Conclusion In this paper, we present a fast image segmentation method using two-dimensional Otsu based on estimation of distribution algorithm. The proposed method can preferably preserve the edges and details of the object because the guided filtering template is replaced with the mean filtering template. Furthermore, compared with other existing image segmentation methods, our method has desirable
Journal of Electrical and Computer Engineering
9
×104 2.2449
×104 2.24495 2.24490
2.2448
2.24485 2.24480 Fitness
Fitness
2.2447 2.2446
2.24475 2.24470
2.2445
2.24465 2.2444 2.2443
2.24460 0
5
10
15
20 25 30 Iterations
35
40
45
50
2.24455
0
5
10
15
(a) 𝑛 = 10
20 25 30 Iterations
35
40
45
50
(b) 𝑛 = 20
×104 2.24495 2.24490 2.24485
Fitness
2.24480 2.24475 2.24470 2.24465 2.24460 2.24455
0
5
10
15
20 25 30 Iterations
35
40
45
50
(c) 𝑛 = 30
Figure 6: The highest fitness convergence curve of our method.
segmentation performance and computational cost for image with simple scene. However, similar to other threshold-based image segmentation methods, our method is preferable for the images with the same gray scale range; it has a limitation to the object with large gray scale distribution. In addition,
the actual segmentation effect of our method is not perfect in complex scene. In the future, we plan to preprocess the object so that our segmentation method can perform well for special objects as well as handle more complex images.
10
Journal of Electrical and Computer Engineering
Original
Otsu
2D Otsu
2D Otsu-FSA
2D Otsu-GA
ME + PPD
LCK
LSD
Our
Rice grains
Tire
Duck
Bird
Figure 7: Comparisons of image segmentation under various methods.
Motorcycle
Journal of Electrical and Computer Engineering
Conflicts of Interest The authors declare that they have no conflicts of interest.
Acknowledgments This paper is supported partly by Chongqing Natural Science Foundation of China (Grant no. cstc2016jcyjA0353) and National Key Scientific Instrument and Equipment Development Projects of China (Grant no. 2013YQ030629).
References [1] Y. J. Zhang, Image Engineering, CN: Tinghua University Press, Beijing, China, 3rd edition, 2013. [2] W. Khan, “A survey: image segmentation techniques,” International Journal of Future Computer and Communication, vol. 3, no. 2, pp. 89–93, 2014. [3] D. Pandey, X. Yin, H. Wang, and Y. Zhang, “Accurate vessel segmentation using maximum entropy incorporating line detection and phase-preserving denoising,” Computer Vision and Image Understanding, vol. 155, pp. 162–172, 2017. [4] D. Zhou and S. Tabbone, “A study of edge detection techniques for segmentation computing approaches,” International Journal of Computer Applications, vol. 1, pp. 35–41, 2010. [5] T. Zuva, O. Olugbara, S. O. Ojo et al., “Image segmentation, available techniques, developments and open issues,” Canadian Journal on Image Processing and Computer Vision, vol. 2, no. 3, pp. 20–29, 2011. [6] B. Peng, L. Zhang, and D. Zhang, “A survey of graph theoretical approaches to image segmentation,” Pattern Recognition, vol. 46, no. 3, pp. 1020–1038, 2013. [7] D. G´omez, J. Y´an˜ ez, C. Guada, J. Tinguaro Rodr´ıguez, J. Montero, and E. Zarrazola, “Fuzzy image segmentation based upon hierarchical clustering,” Knowledge-Based Systems, vol. 87, pp. 26–37, 2015. [8] D. Tao, X. Li, X. Wu, and S. J. Maybank, “General tensor discriminant analysis and Gabor features for gait recognition,” IEEE Transactions on Pattern Analysis and Machine Intelligence, vol. 29, no. 10, pp. 1700–1715, 2007. [9] D. Tao, X. Tang, X. Li, and X. Wu, “Asymmetric bagging and random subspace for support vector machines-based relevance feedback in image retrieval,” IEEE Transactions on Pattern Analysis and Machine Intelligence, vol. 28, no. 7, pp. 1088–1099, 2006. [10] L. Wang and C. Pan, “Robust level set image segmentation via a local correntropy-based K-means clustering,” Pattern Recognition, vol. 47, no. 5, pp. 1917–1925, 2014. [11] L. Wang, H. Wu, and C. Pan, “Region-based image segmentation with local signed difference energy,” Pattern Recognition Letters, vol. 34, no. 6, pp. 637–645, 2013. [12] T. Liu, D. Tao, and D. Xu, “Dimensionality-dependent generalization bounds for k-dimensional coding schemes,” Neural Computation, vol. 28, no. 10, pp. 2213–2249, 2016. [13] T. L. Liu, Q. Yang, and D. C. Tao, “Understanding how feature structure transfers in transfer learning,” in Proceedings of the Twenty-Sixth International Joint Conference on Artificial Intelligence, pp. 2365–2371, Melbourne, Australia, 2016. [14] D. C. Tao, X. Li, X. D. Wu, and S. J. Maybank, “Maybank: geometric mean for subspace selection,” IEEE Transactions on Pattern Analysis and Machine Intelligence, vol. 31, no. 2, pp. 260– 274, 2009.
11 [15] R. Wang, T. Liu, and D. Tao, “Multiclass learning with partially corrupted labels,” IEEE Transactions on Neural Networks and Learning Systems, vol. 99, pp. 1–13, 2017. [16] T. Liu, D. Tao, M. Song, and S. J. Maybank, “Algorithmdependent generalization bounds for multi-task learning,” IEEE Transactions on Pattern Analysis and Machine Intelligence, vol. 39, no. 2, article A4, pp. 227–241, 2017. [17] Y.-T. Chen, X. Liu, and M.-H. Yang, “Multi-instance object segmentation with occlusion handling,” in Proceedings of the IEEE Conference on Computer Vision and Pattern Recognition, CVPR 2015, pp. 3470–3478, usa, June 2015. [18] T. Liu and D. Tao, “Classification with Noisy Labels by Importance Reweighting,” IEEE Transactions on Pattern Analysis and Machine Intelligence, vol. 38, no. 3, pp. 447–461, 2016. [19] J. Dai, K. He, and J. Sun, “Instance-aware semantic segmentation via multi-task network cascades,” in Proceedings of the IEEE Conference on Computer Vision and Pattern Recognition (CVPR ’16), pp. 3150–3158, Las Vegas, Nev, USA, 2016. [20] K. Chen, F. Chen, M. Dai, Z.-S. Zhang, and J.-F. Shi, “Fast image segmentation with multilevel threshold of two-dimensional entropy based on firefly algorithm,” Optics and Precision Engineering, vol. 22, no. 2, pp. 517–523, 2014. [21] X.-C. Yuan, L.-S. Wu, and H.-W. Chen, “Rail image segmentation based on Otsu threshold method,” Guangxue Jingmi Gongcheng/Optics and Precision Engineering, vol. 24, no. 7, pp. 1772–1781, 2016. [22] M. Sezgin and B. Sankur, “Survey over image thresholding techniques and quantitative performance evaluation,” Journal of Electronic Imaging, vol. 13, no. 1, pp. 146–168, 2004. [23] P. J. Herrera, G. Pajares, and M. Guijarro, “A segmentation method using Otsu and fuzzy k-Means for stereovision matching in hemispherical images from forest environments,” Applied Soft Computing Journal, vol. 11, no. 8, pp. 4738–4747, 2011. [24] B. F. Buxton, H. Abdallahi, D. Fernandez-Reyes, and W. Jarra, “Development of an extension of the otsu algorithm for multidimensional image segmentation of thin-film blood slides,” in Proceedings of the International Conference on Computing: Theory and Applications, ICCTA ’07, pp. 552–561, Kolkata, India, 2007. [25] Q. B. Truong and B. R. Lee, “Automatic multi-thresholds selection for image segmentation based on evolutionary approach,” International Journal of Control, Automation and Systems, vol. 11, no. 4, pp. 834–844, 2013. [26] X. Y. Xu, E. M. Song, and L. H. Jin, “Characteristic analysis of threshold based on otsu criterion,” Acta Electronica Sinica, vol. 37, no. 12, pp. 2716–2719, 2009. [27] J. Z. H. Liu and W. Q. Li, “The automatic thresholding of gray-level pictures via two-dimensional OTSU method,” Acta Automatica Sinica, vol. 19, no. 1, pp. 101–105, 1993. [28] J. Sun, “Improved 2D maximum between-cluster variance algorithm and its application to cucumber target segmentation,” Transactions of the Chinese Society of Agricultural Engineering, vol. 25, no. 10, pp. 176–181, 2009. [29] H.-G. Deng, R.-L. Wu, and Z.-R. Lai, “Image segmentation of drosophila’s compound eyes via two-dimensional OTSU thresholding on the basis of AGA,” in Proceedings of the 2nd International Congress on Image and Signal Processing, CISP ’09, pp. 1–5, Tianjin, China, 2009. [30] Z. Pan and Y. Q. Wu, “The two-dimensional otsu thresholding based on fish swarm algorithm,” Acta Optica Sinica, vol. 29, no. 8, pp. 2115–2121, 2009.
12 [31] Y. G. Tang, D. Liu, and X. P. Guan, “Fast image segmentation based on particle swarm optimization and two-dimension Otsu method,” Control and Decision, vol. 22, no. 2, pp. 202–205, 2007. [32] W. Y. Guo, X. F. Wang, and X. Z. Xia, “Two-dimensional Otsu’s thresholding segmentation method based on grid box filter,” Optik, vol. 125, no. 18, pp. 5234–5240, 2014. [33] F. Sun, H. Wang, and J. Fan, “2D otsu segmentation algorithm based on simulated annealing genetic algorithm for iced-cable images,” in Proceedings of the 2009 International Forum on Information Technology and Applications, IFITA ’09, pp. 600– 602, Chengdu, China, 2009. [34] J. L. Fan and F. Zhao, “Two-dimensional Otsus curve thresholding segmentation method for gray-Level images,” Acta Electronica Sinica, vol. 40, no. 4, pp. 751–755, 2012. [35] Y. Q. Wu, Z. H. Pan, and W. Y. Wu, “Image thresholding based on two-dimensional histogram oblique segmentation and its fast recurring algorithm,” Journal on Communications, vol. 29, no. 4, pp. 77–84, 2013. [36] X. M. Zhang, Y. J. Sun, and Y. B. Zheng, “Precise two-dimensional otsu’s image segmentation and its fast recursive realization,” Acta Electronica Sinica, vol. 39, no. 8, pp. 1778–1784, 2011. [37] S. Cao, F. CH. Sun, and L. H. Hu, “Departure airctaft sequence optimization using EDA,” Journal of Tsinghua University (Science & Technology), vol. 52, no. 1, pp. 66–71, 2012. [38] K. He, J. Sun, and X. Tang, “Guided image filtering,” IEEE Transactions on Pattern Analysis and Machine Intelligence, vol. 35, no. 6, pp. 1397–1409, 2013. [39] S. Y. Wang, L. Wang, and C. Fang, “Advances in estimation of distribution algorithms,” Control and Decision, vol. 27, no. 7, pp. 961–966, 2012. [40] S. D. Zhou and Z. Q. Sun, “A survey on estimation of distribution algorithms,” Acta Automatica Sinica. Zidonghua Xuebao, vol. 33, no. 2, pp. 113–124, 2007.