imaging," in Handbook of Medical Imaging. Volume1. Physics and. Psychophysics, vol. 1, H. L. K. Jacob Beutel, Richard L. Metter, Ed. Bellingham, WA, USA.
Fast Interpolation Algorithms for Real-Time Three-Dimensional Cardiac Ultrasound 1
Qi Duan1, Elsa Angelini1, Ting Song1, Andrew Laine1
Department of Biomedical Engineering, Columbia University, New York, NY, USA
Abstract— Real-time three-dimensional (RT3D) ultrasound technique based on matrix phased array transducers is likely to become predominant for dynamic screening in cardiac and obstetric practice. With these transducers large data volumes are acquired in spherical coordinates and require resampling to be visualized in Cartesian coordinates. A fast 3D resampling method was implemented and five interpolation kernels tested on cardiac RT3D data. Downsizing and smoothing of sampling artifacts were integrated in the resampling process for improvement of the reconstructed data visual quality. Keywords— Data resampling, RT3D echocardiography, interpolation kernel.
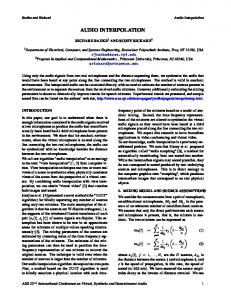
Figure 1: 2D data resampling with backward mapping from radial grid coordinates (r,θ) to Cartesian grid coordinates (x,y).
ultrasound,
(3) Data sampling assigns values at Cartesian grid point locations.
I. INTRODUCTION
II. METHODOLOGY
Ultrasound is a fast and safe imaging modality particularly convenient for cardiac imaging. In order to accurately visualize the beating heart, true real-time 3D ultrasound systems can capture the 3D heart anatomy at several time frames over the cardiac cycle without time averaging or EKG gating [1]. In this work, we focused on interpolation of real-time 3D ultrasound data acquired with a 2.5 MHz RT3D Volumetrics transducer [2] that uses a matrix phased array of elements with beam steering controlled along both elevation and azimuth angles. The system transmits 16 lines for each spanning direction and receives 16 lines per transmit direction. Acquisition is performed at regular depths leading to a final pyramidal geometry with 63°×63° angular width and up to 16cm in height. Resampling is required for visualization of the RT3D data in Cartesian coordinates. The resampling process is comprised of three steps: (1) coordinate transformation, (2) data interpolation on continuous values, (3) data resampling on new grid as illustrated in Figure 1 for backward mapping. (1) For output grid points, coordinate transformation is performed with standard formula to convert Cartesian to spherical coordinates. (2) Data interpolation extrapolates the ultrasound values at continuous point locations via convolution with and an interpolation kernel of finite support. Theoretically, a band-limited signal sampled at a rate higher than the Nyquist frequency can be reconstructed perfectly via convolution with the sinc function. In digital signal processing, only approximations of this function can be implemented for interpolation.
A.
Data Acquisition
For each time frame, RT3D ultrasound data is stored in 8-bits integer matrices of size (64×64×N), where N in the number of slices acquired along the axial dimension of the transducer and has a maximum value of 512. Each volume is acquired in 70ms, which gives an average of 14 frames per cardiac cycle at a depth setting of 12cm. In terms of data size, each time frame represents about 2Mb and an entire exam for one cardiac cycle represents 29Mb. B.
Coordinate Transformation
When processing large data volumes, forward mapping that maps all input coordinate points on the output grid prior to interpolation is quite inefficient and leads to high computational times. Backward mapping that maps the output grid points back inside the input grid and performs interpolation inside the input grid greatly reduces the computational cost associated with the interpolation and was selected for our implementation. Indeed, after mapping Cartesian to spherical coordinates, the input points sit on an integer grid points which simplifies the coordinate transformation problem into a pure interpolation. C.
Data Interpolation
Given an interpolation kernel h of support size K, data value at any Cartesian grid points is computed based on its nearest K3 neighbor points on the spherical grid. Interpolation of a signal f at location x from known values at K neighboring locations { xk }k = 0,1,..., K is computed via convolution with the interpolation kernel as:
0-7803-7789-3/03/$17.00 ©2003 IEEE
1192
EMBC 2003
The parameter a controls the width of the main and secondary lobes and is equal to the slope of the shape at x=1.
K −1
f ( x) = ∑ f ( xk )h( x − xk ) .
(1)
k =0
The kernels therefore control the accuracy and computational cost of the interpolation algorithm and condition the efficiency of the method. From a theoretical point of view, the kernel should approximate the sinc function. From a physics point of view, the kernel should approximate the point-spread function (PSF) of the acquisition system to be able to mimic the data generation process. Simulation and measurements of the PSF for the RT3D Volumetrics© transducer have been studied in [2]. The PSF shape is characterized by a main center lobe and side lobes with high attenuation (15dB to 20dB) and no grating lobe effects. We tested in this work five interpolation kernels of different orders, shapes and complexity including: (1) Nearest neighbor, (2) Linear, (3) Cubic, (4) Hamming windowed sinc function, (5) Gaussian function. The five kernels are described in the following sections and their 1D profile are plotted in Figure 2. C.1
C.4
The windowed sinc kernel is defined as: h ( x ) = w ( x ) × sinc ( x ) ,
C.5
Gaussian Kernel
The Gaussian kernel is defined as: 2 2 1 Gauss ( x) = e − x / 2σ , (7) 2π σ where σ is the standard variation of the kernel that controls the width of its support. This kernel will apply some smoothing to the data and does not perform flat area perfect reconstruction due to the absence of negative side lobes.
Nearest Neighbor Kernel
2
2
2
1.5
1.5
1.5
1
1
1
0.5
0.5
0.5
0
-0.5 -2
0
-1.5
-1
-0.5
0
(a)
0.5
1
1.5
2
-0.5 -2
0
-1.5
-1
-0.5
0
(b)
0.5
1
1.5
2
-0.5 -2
2
2
2
1.5
1.5
1.5
1
1
1
0.5
0.5
0.5
0
-0.5 -2
0
-1.5
-1
-0.5
0
(d)
0.5
1
1.5
2
-0.5 -2
-1.5
-1
-0.5
-1.5
-1
-0.5
0
0.5
1
1.5
2
0
0.5
1
1.5
2
(c)
0
-1.5
-1
-0.5
0
(e)
0.5
1
1.5
2
-0.5 -2
1
.
5
(f)
Figure 2: 1D profiles of interpolation kernels on interval [-2 2]. (a) nearest neighbor, (b) linear, (c) cubic (a=-0.5), (d) Hamming windowed sinc, (e) Gaussian (σ = 0.5) (f) theoretically optimal sinc kernel.
Linear Kernel
This first-order kernel performs linear interpolation between adjacent points of the input data along each dimension and is defined as: 1− | x | 0 ≤| x |< 1 h( x ) = . (3) 1 ≤| x | 0 Linear kernels are popular for reconstruction as they offer a good tradeoff between image quality and computational cost. C.3
(5)
The Hamming window is defined as: 2π x K −1 | x |< α + (1 − α ) cos (6) w( x ) = K −1 2 , 0 otherwise where K is the size of the kernel support (i.e. the number of samples in the windowing function) and α=0.54.
This zero-order kernel provides the simplest and fastest interpolation method. Each output pixel is assigned the value of the nearest sample point in the input data. The nearest neighbor kernel is defined as: 1 − 0.5 ≤ x ≤ 0.5 h( x ) = . (2) 0 otherwise The frequency response of this kernel is the sinc function which has a poor localization and passband selectivity. This property typically leads to low-quality interpolated data with blocking effects for images with high frequency contents such as edges or high noise level. C.2
Hamming windowed sinc kernel
D.
Optimization of Computation Speed
To achieve fast computation speed, we performed 3D convolution with separable symmetric 1D interpolation kernels [3]. Interpolation with true 3D kernels has a complexity of K3×(M×N×P) while implementation with 1D kernels reduces the complexity to (K2+K+1)×(M×N×P) for an output grid of size [M N P]. Further speed improvement was achieved via quantization of the normalized distance values (x-xk) in Equation (1) into 1024 equidistant bins in the interval [0 1]. Values of the 1D kernels were pre-computed at these quantized bins and stored into lookup tables of size (K1)/2×1024 which were then accessed during the interpolation process.
Cubic Kernel
The single-parameter cubic kernel is a third-order polynomial function that provides an efficient approximation of the theoretically optimal sinc function. The kernel is composed of cubic piecewise polynomials defined as: (a + 2) | x |3 −(a + 3) | x |2 +1 0 ≤| x |< 1 h( x) = a | x |3 −5a | x |2 +8a | x | −4a 1 ≤| x |< 2 . (4) 0 2 ≤| x |
1193
(1) overall image quality and integrity with respect to the ultrasound ’standard’ appearance. (2) spatial resolution at the apex with good contrast for endocardial localization. (3) contrast of myocardial tissue versus blood pool and homogeneity of the myocardium tissue appearance, (4) preservation of image quality with downsizing, (5) attenuation of block artifacts in the azimuth direction due to the design of the receive mode array transducer limited with linear geometry [5]. Based on these criteria, the Hamming windowed sinc kernel appeared superior. Point number 5 is related to the block artifacts, inherent to the design of the phased-array transducer, that corrupt the long-axis slices in the azimuth planes (displayed in the top row of each quadrant in Figure 3) for scale 1 and 2. The ability of the Gaussian kernel to reconstruct smoothed data with good preservation of the anatomical features suggested the combination of this kernel with the Hamming windowed sinc function to remove the azimuth block artifacts. We tested this approach by pre-filtering the spherical data with a 1D Gaussian kernel along the azimuth dimension and then reconstructing the Cartesian volume with the Hamming windowed sinc function. Results are displayed in Figure 3 for two long-axis slices reconstructed at scale 1 and 2. We observed a great improvement in the quality of the reconstructed data with the pre-filtering with an efficient removal of the blocky artifacts and an enhancement of the myocardium tissue appearance that enables clearer localization of anatomical structures such as the apex location and the mitral valves contours.
III. RESULTS Our interpolation method was applied on one ultrasound volume acquired with a RT3D Volumetrics© transducer. The original spherical volume size was (64×64×438). The highest resolution of the spherical data is in the axial direction with a slice separation of 0.308mm. Reconstruction on a Cartesian grid was therefore initially performed for voxels of sizes 0.308 producing Cartesian volumes of size mm3 (455×455×442). These volumes represent a data size of 90Mb for a 8-bits integers encoding which requires 1.3Gb of storage size for the set of 14 volumes recorded for one cardiac cycle! In this situation, it is desirable to downsize the data volumes prior to processing with complex algorithms such as denoising and segmentation when performed in 3D or 4D (3D+Time). Downsizing can be performed at the same time than reconstruction by defining a coarser Cartesian grid. We investigated the performance of each kernel for interpolation with downsizing by a factor of 2 and 4, generating volumes of size (228×228×221) and (114×114×111). The interpolation kernel support size K was set to 3 for the nearest neighbor and linear case and to 5 for the other cases. The parameter of the cubic interpolation kernel was set to a=-0.5, which is the optimal value for minimization of the mean square radiometric error for band limited images with low frequency information [4]. Even though such conditions are not verified for RT3D ultrasound data due to the presence of speckle noise, this value offers a good tradeoff for visual quality between image undersampling and over smoothing. The sigma for the Gaussian kernel was set to σ=1. Results for the five interpolation kernels are displayed in Figure 3 on orthogonal short and long axis views The reconstructed results showed overall similarities in terms of visual data quality. A fine inspection through the volumes led to the identification of the following limitations or advantages for each of the kernels: a) Block artifacts with the nearest neighbor kernel. b) Deterioration of contrast and blurring of endocardial borders with linear interpolation. c) Deterioration of contrast as scale increases with cubic interpolation. d) Stable behavior of the Hamming windowed sinc function with beneficial smoothing of the data while preserving the localization of spatial features. e) Smoothing of the data with Gaussian kernel at higher scales. The smoothing capabilities of the kernel could nevertheless be suitable to assist segmentation or 3D volume rendering while eliminating the need for prior denoising of the data. A rigorous evaluation of the interpolation kernels was performed with the following clinical objectives in mind:
IV. CONCLUSION This paper presented results on the performance of five interpolation kernels for fast volume resampling of RT3D ultrasound data acquired with a Volumetrics© transducer. The use of look up tables and 1D interpolation kernels enabled fast reconstruction of Cartesian volumes from the spherical data recorded by the transducer. The performance of the kernels was tested for reconstruction of a cardiac data set on different Cartesian grid sizes to handle downsizing of the data. The Hamming windowed sinc function was identified as the best interpolation kernel with respect to specific visual quality criteria. We also tested resampling of the data with prefiltering of the spherical data in the azimuth dimension to remove block artifacts inherent to the transducer design. Results with this pre-filtering provided higher quality reconstruction with efficient removal of the artifacts and better contrast of the myocardium tissue. The great improvement in the quality of the reconstructed data when applying pre-filtering suggests that fast an efficient denoising of RT3D ultrasound can be performed in the spherical domain. This approach was applied to RT3D ultrasound in [6] and is also investigated by other groups on 3D ultrasound [7].
1194
Scale 1
(a)
(b)
(c)
Scale 2
(d)
(a)
(e)
(b)
Scale 4
(a)
(b)
(c)
(c)
Scale 1
(d)
(d)
(e)
Scale 2
(e)
(d-1)
(ds-1)
(d-2)
(ds-2)
Figure 3: Interpolation of RT3D data with: (a) nearest neighbor, (b) linear, (c) cubic (σ=-.0.5), (d) Hamming windowed sinc function, (e) Gaussian (σ=0.5) for scale 1,2, and 4. Lower right quadrant displays results for interpolation with Hamming windowed sinc kernel on original spherical data (d-1)~(d-2) and spherical data smoothed with a Gaussian kernel (σ=2, K=3) in the azimuth direction (ds-1)~(ds-2). steering," IEEE Transactions on Ultrasonics, Ferroelectrics, and Frequency Control, vol. 2, 1991. [3] R. S. Ferguson, Practical algorithms for 3D computer graphics. Natic, Mass, 2001. [4] S. K. Park, "Image reconstruction by parametric cubic convolution," Computer Vision, Graphics and Image Processing, vol. 23, pp. 258-272, 1982. [5] S. W. Smith and O. T. Von Ramm, "High-speed ultrasound volumetric imaging system-part 2: Parallel processing and image display," IEEE Transactions on Ultrasonics, Ferroelectrics, and Frequency Control, vol. 2, 1991. [6] E. Angelini, A. Laine, S. Takuma, J. Holmes, and S. Homma, "LV volume quantification via spatio-temporal analysis of real-time 3D echocardiography," IEEE Transactions on Medical Imaging, vol. 20, pp. 457-469, 2001. [7] J. Montagnat, M. Sermesant, and H. Delingette, "Anisotropic filtering for model-based segmentation of 4D cylindrical echocardiographic images," Pattern Recognition Letters, vol. 24, pp. 815-828, 2003. [8] G. Stetten, "Automated Identification and Measurement of Cardiac Anatomy via Statistical Analysis of Medial Primitives," in Department of Biomedical Engineering. Chapel Hill: University of North Carolina, 1999.
Its main advantage is the use of smaller size of the spherical data sets when compared to their Cartesian representation allowing fast computation speed critical for real-time display. Future work will investigate potential benefits in adapting the interpolation kernel size to the spatial density of the spherical data that varies along the axial dimension. We are also interested in extending our resampling method to perform gradient computation in the spherical domain as studied in [8]. Finally, we would also like to test the algorithm on new real-time 3D ultrasound machines, pending that we can have access to the spherical data. REFERENCES [1] A. Fenster and D. B. Downey, "Three-dimensional ultrasound imaging," in Handbook of Medical Imaging. Volume1. Physics and Psychophysics, vol. 1, H. L. K. Jacob Beutel, Richard L. Metter, Ed. Bellingham, WA, USA.: SPIE- The International Society of Optical Engineering, 2000, pp. 463-510. [2] S. W. Smith and O. T. Von Ramm, "High-speed ultrasound volumetric imaging system-part 1: Transducer design and beam
1195