Kai Yuâ . Shenghuo Zhuâ . John Laffertyâ¡. Yihong Gongâ .... or by y â¼ N(µ, Σ); E(·) denotes the expectation of ran- dom variables such that E(y) = µ and E[(y ...
Fast Nonparametric Matrix Factorization for Large-scale Collaborative Filtering Kai Yu†
Shenghuo Zhu†
John Lafferty‡
Yihong Gong†
NEC Laboratories America, Cupertino, CA 95014, USA † School of Computer Science, Carnegie Mellon University, Pittsburgh, PA 15213, USA ‡
ABSTRACT
Keywords
With the sheer growth of online user data, it becomes challenging to develop preference learning algorithms that are sufficiently flexible in modeling but also affordable in computation. In this paper we develop nonparametric matrix factorization methods by allowing the latent factors of two low-rank matrix factorization methods, the singular value decomposition (SVD) and probabilistic principal component analysis (pPCA), to be data-driven, with the dimensionality increasing with data size. We show that the formulations of the two nonparametric models are very similar, and their optimizations share similar procedures. Compared to traditional parametric low-rank methods, nonparametric models are appealing for their flexibility in modeling complex data dependencies. However, this modeling advantage comes at a computational price — it is highly challenging to scale them to large-scale problems, hampering their application to applications such as collaborative filtering. In this paper we introduce novel optimization algorithms, which are simple to implement, which allow learning both nonparametric matrix factorization models to be highly efficient on large-scale problems. Our experiments on EachMovie and Netflix, the two largest public benchmarks to date, demonstrate that the nonparametric models make more accurate predictions of user ratings, and are computationally comparable or sometimes even faster in training, in comparison with previous state-of-the-art parametric matrix factorization models.
Nonparametric Models, Matrix Factorization, Collaborative Filtering
Categories and Subject Descriptors H.3 [Information Storage and Retrieval]: Information Search and Retrieval
General Terms Algorithms, Theory, Performance
Permission to make digital or hard copies of all or part of this work for personal or classroom use is granted without fee provided that copies are not made or distributed for profit or commercial advantage and that copies bear this notice and the full citation on the first page. To copy otherwise, to republish, to post on servers or to redistribute to lists, requires prior specific permission and/or a fee. SIGIR’09, July 19-23 2009, Boston. Copyright 2009 ACM X-XXXXX-XX-X/XX/XX ...$5.00.
1.
INTRODUCTION
Recent advances in collaborative filtering have been paralleled by the increasing popularity of low-rank matrix factorization methods. To discover the rich structure of a very large, sparse rating matrix, empirical studies show that the number of factors should be quite large [10]. Inspired by the success of kernel methods [11], which generalize finitedimensional linear models to infinite-dimensional functions in a RKHS, it is natural to ask — why do we restrict the number of factors in advance? Kernel methods enable the use of infinite dimensional feature spaces; however, using kernel methods for low-rank factorization problems is hampered by the large scale of real-world data. To the best of our knowledge, it has only been attempted on relatvely small problems [12]. Nonparametric models differ from parametric models in the sense that the model dimensionality is not specified a priori, but is instead determined from data. The term “nonparametric” is not meant to imply that such models completely lack parameters but that the number and nature of the parameters are flexible and not fixed in advance. Recent years has witnessed the successful development of such nonparametric methods as kernelized support vector machines (SVMs) [11], Gaussian processes (GPs) [7], and Dirichlet processes (DP) in modeling complex data dependencies. On the other hand, applying these models to large-scale data is always challenging. To date, optimization for large scale nonparametric models like kernel systems remains an active research area. Since collaborative filtering problems usually involve an even greater scale of observational data than classification/regression problems, fast nonparametric methods for collaborative filtering is a relatively untouched area. In this paper we investigate nonparametric matrix factorization models, and study together two particular examples, the singular value decomposition (SVD) and probabilistic principal component analysis (pPCA) [14, 9]. Their nonparametric counterparts in fact both have simple and similar formulations, which we call by nonparametric SVD (NSVD) and nonparametric pPCA (NPCA), respectively. By effectively exploiting data sparsity and organizing the computation, we show that learning with such models is in fact efficient on large-scale sparse matrices. Interestingly, although learning probabilistic models is usually considered to be slow, our methods make NPCA as fast as its non-
probabilistic counterpart NSVD. We applied the two proposed algorithms to the EachMovie data matrix of size 74, 424 × 1, 648 (users × movies) and the Netflix data matrix of size 480, 189 × 17, 770, the two largest public benchmarks to date. Our results are, in term of both efficiency and accuracy, comparable or superior to the stateof-the-art performance achieved by low-rank matrix factorization methods.
2.
LOW-RANK MATRIX FACTORIZATION
2.1
Notation
We use uppercase letters to denote matrices and lowercase letters to denote vectors, which are by default column vectors. For example, Y ∈ RM ×N is an matrix, its (i, j)-th element is Yi,j , and its i-th row is represented by an N × 1 vector yi . The transpose, trace, and determinant of Y are denoted by Y > , tr(Y ), and det(Y ), respectively, and I denotes the identity matrix with an appropriate dimensionality. Moreover, kyk is the vector `2 -norm, kY kF denotes the Frobenius norm, and kY k∗ the trace norm, which is given by the sum of the singular values of Y . We denote a multi-variate Gaussian distribution of a vector y with mean µ and covariance matrix Σ by N (y; µ, Σ), or by y ∼ N (µ, Σ); E(·) denotes the expectation of random variables such that E(y) = µ and E[(y − µ)(y − µ)> ] = Cov(y) = Σ. If Y contains missing values, O denotes the indices of observed elements of Y , and |O| the number of observed ele2 is ments. (i, j) ∈ O if Yi,j is observed, (Y )2O = (i,j)∈O Yi,j the sum of the square of all observed of Y . We use Oi to denote the indices of non-missing elements of the i-th row yi . For example, if yi ’s elements are all missing except the 1st and the 3rd elements, then:
P
However when Y contains a large number of missing values, a modified SVD seeks to approximate those known elements of Y according to min
U ∈RM ×L ,V ∈RN ×L
(Y − U V > )2O + γ1 kU k2F + γ2 kV k2F
(2)
where γ1 , γ2 > 0, and the two regularization terms kU k2F and kV k2F are added to avoid overfitting. Unfortunately, the optimization problem is non-convex. Gradient based approaches can be applied to find a local minimum. This algorithm is perhaps one of the most popular methods applied to collaborative filtering, e.g., [4, 5, 13].
2.2.2
Probabilistic Principle Component Analysis
Probabilistic PCA [14, 9] assumes that each element of Y is a noisy outcome of a linear transformation Yi,j = u> i vj + ei,j , (i, j) ∈ O
(3)
M ×L
where U = [ui ] ∈ R are the latent variables following a prior distribution ui ∼ N (0, I), i = 1, . . . , M , and ei,j ∼ N (0, λ) is independent Gaussian noise. The learning can be done by maximizing the marginalized likelihood of observations using an Expectation-Maximization (EM) algorithm, which iteratively computes the sufficient statistics of p(ui |V, λ), i = 1, . . . , M in the E-step, and then updates V and λ in the M-step. Note that the original formulation includes a mean of yi ; here we assume that data are centered for simplicity. Related probabilistic matrix factorizations have been applied in collaborative filtering, e.g., [6, 10].
3.
NONPARAMETRIC MATRIX FACTORIZATION
• Oi = [1, 3]> and yOi = [Yi,1 , Yi,3 ]> ;
3.1
• If K is a square matrix, K:,Oi denotes a sub matrix formed by the 1st column and 3rd column of K;
One way to construct a nonparametric matrix factorization model is to relax the cardinality constraint such that the approximating matrix U V > is full-rank; the following simple result then holds.
• KOi is a sub square matrix of K:,Oi , further obtained by keeping its 1st & 3rd rows.
2.2
Collaborative Filtering by Matrix Factorization
In this paper we consider an M × N rating matrix Y describing M users’ numerical ratings on N items. A lowrank matrix factorization approach seeks to approximate Y by a multiplication of low-rank factors, namely Y ≈ UV >
(1)
where U is an M × L matrix and V an N × L matrix, with L < min(M, N ). Throughout this paper we make the assumption M > N , without loss of generality. Since each user rates only a small portion of the items, Y is usually extremely sparse. Collaborative filtering can be seen as a matrix completion problem, where the low-rank factors learned from observed elements are used to fill in unobserved elements of the same matrix.
2.2.1
Singular Value Decomposition
Traditionally, the SVD is derived in terms of approximating a fully observed matrix Y by minimizing kY − U V > kF .
Nonparametric SVD
Proposition 1. If U and V are both full-rank, the problem (2) is equivalent to min
X,K�0
(Y − X)2O + γ1 tr(XK −1 X > ) + γ2 tr(K)
(4)
Proof: In solving the problem (2), if we fix V but minimize the cost w.r.t. U , the sub optimization problem becomes standard ridge regression min (Y − U V > )2O + γ1 kU k2F .
U ∈RM ×L
(5)
By the representer theorem, we know the solution must satisfy U = AV , A ∈ RM ×N . Plugging this first-order condition into the cost (2) and letting X = U V > and K = V V > , because K � 0, we obtain (4).1 1
In a similar way, we can derive the equivalence to minX,Σ�0 (Y − X)2O + γ2 tr(X > Σ−1 X) + γ1 tr(Σ) as well. Though we get two equivalent formulations, in the remainder of this paper we will mostly focus on problem (4), because the kernel matrix K is smaller than Σ (i.e., M > N ). An earlier version of this result has appeared in [17].
By setting the partial derivatives of the cost (4) w.r.t. K to be zero, we obtain the optimum condition K=
p
1
γ1 /γ2 (XX > ) 2 .
Plugging the above condition back into (4), we obtain the equivalence to a convex learning problem known as maxmargin matrix factorization [12] √ min (Y − X)2O + 2 γ1 γ2 kXk∗ (6)
Let K = V V > , and relax the rank constraint such that K is a positive-definite kernel matrix. Then the pPCA model (3) is generalized to a simple generative model yi = xi + ei , i = 1, . . . , M where ei = [ei,1 , . . . , ei,N ] and xi ∼ N (0, K), ei ∼ N (0, λI).
X∈RM ×N
using the trace norm. Because of the convexity, the global optimum can be reached by any algorithm that seeks a local optimum. The optimization of (6) resorts to semidefinite programming that can handle only small matrices [12]. Our result will show that, in contrast, (4) can be applied to much larger-scale collaborative filtering problems. Since (6) implies a parameter redundancy in γ1 and γ2 , in the following we let γ = γ1 = γ2 . We first suggest an EM-like coordinate descent algorithm by alternatively updating X and K; conveniently, both updates have analytical solutions:2 • E-step, update X: Given the current K, update each row of X independently by solving a standard ker−1 xi ], nel regression problem minxi [(yi − xi )2O + γx> i K which leads to xi ← K:,Oi (KOi + γI)−1 yOi , i = 1, . . . , M,
(7)
where K:,Oi ∈ RN ×|Oi | and KOi ∈ R|Oi |×|Oi | . Note that |Oi | is usually a small number since each user does not rate many items. • M-step, update K: Given the current X, update K according to √ √ (8) K ← X > X = Q SQ>
The model describes a latent process X, and an observational process Y , whose marginal probability p(Y |K, λ) is
Z
p(Y, X|K, λ)dX =
min
X,K�0
and covariance > > E(xi x> = V V >. i ) = V E(ui ui )V 2 Note that the two optimization steps here are different from the standard EM algorithm for learning probabilistic models. In this paper we call them by E-step and M-step, mainly for reference conveniences and showing the analogy with another EM algorithm that is introduced later.
(10)
(Y − X)2O + λtr(XK −1 X > ) + M λ log det(K) (11)
which appears to be similar to the SVD formulation problem (4). The major difference is that (11) employs the logdeterminant as a low-complexity penalty, instead of using the trace norm. However (11) is not a probabilistic way to deal with uncertainties and missing data. A more principled approach requires integrating out all of the missing elements, and aims to maximize the marginalized likelihood (10) conditioned on the observed elements. This is done by a canonical expectation-maximization (EM) algorithm: • E-step: Compute the sufficient statistics of the posterior distribution p(xi |yOi , K, λ), i = 1, . . . , M , E(xi ) = K:,Oi (KOi + λI)−1 yOi −1
Cov(xi ) = K − K:,Oi (KOi + λI)
(12) KOi ,:
(13)
• M-step: Based on the results of the last E-step, update the parameters K← λ←
Nonparametric pPCA
E(xi ) = V E(ui ) = 0,
N (yOi ; 0, KOi + λI).
As we can see, pPCA in fact assumes that each row of Y is an i.i.d. sample drawn from a Gaussian distribution with covariance K + λI. If we consider maximizing the joint likelihood p(Y, X|K, λ) with respect to X and K, we obtain an optimization problem
Implementation of the algorithm requires only basic matrix computations. The kernel regression step (7) suggests, however, the possibility that when working with “infinite dimensions,” the so-called “kernel trick” [11] can be applied to exploit the data sparsity. In fact, there is an even greater opportunity to improve efficiency, as we shall discuss in Section 4.
For the pPCA model (3) in the limit of “infinite factor dimensions,” it is infeasible to directly handle either ui or vj , but we can work on xi = [Xi,1 , . . . , Xi,N ]> , where Xi,j = u> i vj . It is easy to see that xi follows an N -dimensional Gaussian distribution with mean
M Y i=1
where Q and S are the results of the standard eigen√ value decomposition X > X = QSQ> , and S is a diagonal matrix formed by the square roots of the eigenvalues.
3.2
(9)
1 M 1 |O|
M h X
Cov(xi ) + E(xi )E(xi )>
X n
i
i=1
Ci,j + [Yi,j − E(Xi,j )]2
(14)
o
(15)
(i,j)∈O
where Ci,j is the j-th diagonal element of Cov(xi ), i.e., the posterior variance of Xi,j . The EM algorithm appears to be similar to the coordinate descent in Section 3.1, because both involve a kernel regression step, (7) and (12). Due to the additional computation of the posterior covariance of xi by (13), the E-step is actually identical to Gaussian process regression [7]. The iterative optimization is non-convex, and converges to a local optimum.
4.
LARGE-SCALE IMPLEMENTATION
For notational convenience, we refer to the two algorithms NSVD (nonparametric SVD) and NPCA (nonparametric
pPCA), and describe their large-scale implementations in this section. The two EM algorithms share a few common computational aspects: (1) Instead of estimating the latent factors U and V , they work on an approximating matrix X; (2) the major computational burden is the E-step, which has to go over all the M users; (3) in both cases, the E-step is decomposed into independent updates of xi , i = 1, . . . , M ; (4) for each update of xi , the kernel trick is applied to exploit the sparsity of Y . Though the last two properties ease the computation, a naive implementation is still too expensive on large-scale data. For example, on the Netflix problem, a single E-step will consume over 40 hours using NSVD3 . Even worse, since NPCA takes into account the distribution of X and computes its second order statistics by (13), it costs an additional 4,000 hours in a single E-step. In the following, we show that the computational cost of (7) or (12) can be significantly reduced, and the overhead caused by (13) can be almost completely avoided. As a result, NSVD is as fast as low-rank matrix factorization methods, while NPCA is as fast as its non-probabilistic counterpart – NSVD.
4.1
Fast NSVD
We first reduce the computational cost of (7), which is the bottleneck of NSVD. The computation can be re-written as xi = Kzi , where K is the N × N full kernel matrix, and zi ∈ RN is a vector of zeros, excepts those elements at positions Oi , whose values are assigned by
The re-formulation of (7) suggests that (8) can be realized without explicitly computing X, since X X=K
M X
!
zi zi>
K
P
Algorithm 1 NSVD Require: Y , γ > 0, itermax ; 1: allocate K ∈ RN ×N , B ∈ RN ×N ; 2: initialize iter = 0, K = I, R = N ; 3: repeat 4: iter ← iter + 1; 5: reset B, i; 6: repeat 7: i ← i + 1; 8: t = (KOi + γI)−1 yOi ; 9: BOi ← BOi + tt> ; 10: until i = M ; 11: [Q, S] = EigenDecomposition(KBK, rank = R); 12: S ← Sqrt(S); R 13: R ← min K, subject to K m=1 Sm ≥ m=1 Sm ; 14: S ← Truncate(S, R); 15: K ← QSQ> ; 16: until iter = itermax 17: return K;
P
4.2
zOi = (KOi + γI)−1 yOi .
>
KBK = QS(QBQ)SQ> , and store the resulting matrix in the memory used for K. So the largest memory consumption happens during the inner loop, where we need to store two N × N matrices B and K, with totally N (N − 1) memory cost. The major computation is also the inner loop, 3 After obtainwhich is O( M i=1 |Oi | ) where |Oi | � N . ing K, the prediction on a missing element at (i, j) is by Xi,j = Kj,Oi (KOi + λI)−1 yOi .
⇒
v ! u M u X t > zi zi K. K← K i=1
(16)
i=1
The above analysis suggests that, for every row i, we can save the multiplication of an N × |Oi | matrix K:,Oi with a vector zOi of length |Oi |, and the N 2 multiplication xi x> i (i.e., replaced by the smaller |Oi |2 multiplication zOi zO>i ). 2 2 In total we get a reduction of N M i=1 |Oi | + N M multiplication operations. On the Netflix data, this means a reduction of over 40 hours for one E-step, and the resulting computation takes less than 4 hours. The next major computation is the eigenvalue decomposition required by (8). Since the trace norm regularizer is a rank minimization heuristic, after some steps if K is rank R, based on (16) we know that the next K has a rank no more than R. Thus at each iteration we check the rank R of K and at the next iteration compute only the leading R eigenvalues of K. The pseudo code is described by Algorithm 1. We omit some fine details to keep the description compact, including that (1) we check if the predictions deteriorate on a small set of validation elements and quit the program if that happens; (2) we keep Q and S to compute the step (11) via
P
3 Throughout this paper, computation time is estimated on a PC with a 2.66 GHz CPU and 3.0G memory.
P
Fast NPCA
Compared to the non-probabilistic NSVD, the E-step of NPCA has one additional step (13) to compute an N × N posterior covariance matrix for every i = 1 . . . , M . It turns out the overhead is almost avoidable. Let B be an N × N matrix whose elements are initialized as zeros, then we use it to collect the local information by BOi ← BOi − Gi + zOi zO>i , for i = 1, . . . , M
(17)
−1
where Gi = (KOi + λI) and zOi = Gi · yOi . Given above, the M-step (14) can be realized by K←K+
1 KBK. M
(18)
Therefore there is no need to explicitly perform (13) to compute an N ×N posterior covariance matrix for every i, which M 2 2 saves N M i=1 |Oi | + N i=1 |Oi | multiplications. On the Netflix problem, this reduces over 4, 000 hours for one Estep. The pseudo code is given in Algorithm 2. We note that, since the optimization is non-convex, we initialize K by an item-item correlation matrix based on the incomplete Y (see Section 6.3). Comparing Algorithm 2 with Algorithm 1, we find the remaining computation overhead of the probabilistic approach lies in the steps 10 and 11 that collect local uncertainty information for preparing to update the noise variance λ, which M 2 3 costs additional i=1 (2|Oi | + 2|Oi | ) multiplications for each E-step. In order to further speed-up the algorithm, we propose to simplify NPCA. The essential modeling assumption of (9) is that Y is a collection of rows yi independently and identically following a Gaussian distribution N (0, K + λI). Then our idea is, rather than modeling the noise and signal separately, we merge them by K ← K + λI
P
P
P
Algorithm 2 NPCA Require: Y , itermax ; 1: allocate K ∈ RN ×N , B ∈ RN ×N ; 2: initialize iter = 0, K; 3: repeat 4: iter ← iter + 1; 5: reset B, Er = 0, i = 0; 6: repeat 7: i ← i + 1; 8: G = (KOi + λI)−1 ; 9: t = G · yOi ; 10: Er ← Er + j∈Oi (Yi,j − Kj,Oi t)2 ; 11: Er ← Er + j∈Oi (Kj,j − Kj,Oi GKOi ,j ); 12: BOi ← BOi − G + tt> ; 13: until i = M ; 1 14: K←K+M KBK; 1 15: λ ← |O| Er; 16: until iter = itermax 17: return K, λ;
Algorithm 3 Fast NPCA Require: Y , itermax ; 1: allocate K ∈ RN ×N , B ∈ RN ×N , b ∈ RN , µ ∈ RN ; 2: initialize iter = 0, K; 3: repeat 4: iter ← iter + 1; 5: reset B, b, i = 0; 6: repeat 7: i ← i + 1; 8: G = KO−1 ; i 9: t = G(yOi − µOi ); 10: bOi ← bOi + t; 11: BOi ← BOi − G + tt> ; 12: until i = M ; 1 13: K←K+M KBK; 1 14: µ ← µ + M b; 15: until iter = itermax 16: return K, µ;
P P
5. and directly deal with the covariance of the noisy observations yi , i = 1, . . . , M . The obtained model is conceptually simple Yi,j ∼ δ(Xi,j ), where xi ∼ N (0, K),
(19)
and δ(Xi,j ) is the distribution with a probability one if Yi,j = Xi,j and zero otherwise. In fact, the simplified model (19) is equivalent to the original model (9) that separately handles signals and Gaussian noises. This is because that in (9) there is no prior either on the covariance K or on the noise variance λ, and thus both models can be seen as an maximum-likelihood estimator (MLE) of the free-form covariance of the noisy observations. Though it should be straightforward to assign priors or regularization on K and λ, we present only the non-regularized approach here for keeping the simplicity. Due to the fact that M is typically very large, the MLE estimator works well in our experiments. For model (9) the EM algorithm is the following: • E-step: E(xi ) = K:,Oi (KOi )−1 (yOi − µOi ) Cov(xi ) = K − K:,Oi (KOi )−1 KOi ,: • M-step: K←
1 M
M h X i=1
µ←µ+
1 M
Cov(xi ) + E(xi )E(xi )>
M X
i
E(xi )
i=1
The implementation is summarized by Algorithm 3. The computation at the E-step has only minor differences from that of the non-probabilistic Algorithm 1. Compared with Algorithm 2, in one E-step, the new version saves about 11.7 hours on the Netflix data, and ends up with only 4 hours. The memory cost is also the same as Algorithm 1, which is N (N − 1) for storing K and B. The prediction is made by computing the expectation E(Yi,j ) = Kj,Oi (KOi )−1 (yOi − µOi )+µj . Due to its remarkable simplicity, we mainly apply the faster version of NPCA in the experiments.
RELATED WORK
Low-rank matrix factorization algorithms for collaborative filtering can be roughly grouped into non-probabilistic [4, 1, 5, 13] and probabilistic approaches [6, 10, 18]. In the recent Netflix competition, low-rank matrix factorization was extremely popular among the top participants, e.g. [5, 13, 10, 15, 18, 2]. Non-probabilistic nonparametric matrix factorization under the trace norm regularization was introduced in [12]. The optimization was cast as a canonical semidefinite programming (SDP) problem, which has a poor efficiency and scalability. In [12], the algorithm was applied to handle only a small 100 × 100 matrix. To improve its efficiency and scalability, a faster approximation was subsequently proposed in [8], which was in fact a parametric (non-convex) low-rank method, similar to the formulation of SVD (2). Recently, theoretical analysis of matrix completion under trace norm regularization is becoming an active research area, e.g., [3]. The probabilistic NPCA is a nonparametric generalization of the well-known parametric pPCA [14, 9]. Although the dimensionality of latent factors goes to potentially infinity, the resultant nonparametric model, (9) or (19), is conceptually simple — it is the maximum likelihood estimator of a (very!) high-dimensional Gaussian from incomplete data, a topic related to the recent development in nonparametric Gaussian process regression [7]. Though this model is more powerful in explaining data, it also demands much more computation. As a consequence, despite the fact that parametric matrix factorization has made a huge success in building modern recommender systems, probabilistic nonparametric models like NPCA have never been paid enough attention in collaborative filtering research and practice. We note that a further development of NPCA is introduced in [16], where the nonparametric random effects model (NREM) can be seen as a Bayesian version of NPCA that additionally utilizes row-specific and column-specific attributes in a multi-task learning setting.
6. 6.1
EMPIRICAL STUDY Experiments on EachMovie Data
We carry out a series of experiments on the entire EachMovie data set, which includes 74424 users’ 2811718 distinct
Table 1: RMSE of matrix factorization methods in the EachMovie experiment Method SVD (d=20) SVD (d=40) NSVD pPCA (d=20) pPCA (d=40) NPCA
RMSE 1.1636 ± 0.0006 1.1552 ± 0.0006 1.1323 ± 0.0002 1.1044 ± 0.0002 1.1013 ± 0.0003 1.0795 ± 0.0003
Table 2: Runtime performances of matrix factorization methods in the EachMovie experiment Method SVD (d=20) SVD (d=40) NSVD pPCA (d=20) pPCA (d=40) NPCA
Run Time 6120 sec. 8892 sec. 255 sec. 545 sec. 1534 sec. 2128 sec.
Iterations 500 500 5 30 30 30
numeric ratings {1, 2, 3, 4, 5, 6} on 1648 movies. This is a very sparse matrix since 97.17% of the elements are missing. In our first setting, we randomly select 80% of each user’s ratings for training and use the remaining 20% as test cases. The random selection is repeated 20 times independently. We focus on two groups of algorithms: 1. SVDs: Low-rank SVDs with 20 and 40 dimensions, plus the NSVD described in Algorithm 1. The two lowrank models, defined by (2), are optimized by conjugate gradient methods. The stopping criterion is based on the performance on a small hold-out set of the training elements. For each algorithm, the regularization parameter γ is chosen from {1, 5, 10, 20, 50, 100} based on the performance on the first train/test partition. 2. PCAs: Low-rank pPCAs with 20 and 40 dimensions, plus the NPCA described in Algorithm 3. For these three methods the stopping criterion is also based on the hold-out set, plus that the total number of EM iterations should not exceed 30. We note that these PCA algorithms have no regularization parameters to tune. The mean and standard error of RMSE (root-mean-square error) averaged over all the 20 trials are listed in Table 1. We can see that for either of the two categories, SVD and pPCA, the nonparametric version consistently outperforms the lowrank counterparts. Second, the probabilistic PCAs consistently outperforms those SVD methods. Over all, NPCA is the winner among all the methods. We implement all the algorithms using C++. The average run time results are reported by Table 2. SVD using conjugate gradients converges very slowly. As analyzed before, NSVD and NPCA have almost the same computational cost for a single EM iteration, but NSVD usually stops after 5 iterations due to the detected overfitting, while NPCA often goes through 30 iterations. We observe that the performance of NPCA on the holdout set saturates after some iterations,
Table 3: Comparison with state-of-the-art methods in the literature, in terms of NMAE Method URP [8] Attitude [8] FMMMF [8] MMMF-A100 [4] NSVD NPCA
Weak NMAE 0.4422 ± 0.0008 0.4520 ± 0.0016 0.4397 ± 0.0016 0.4287 ± 0.0020 0.4548 ± 0.0005 0.4257 ± 0.0005
Strong NMAE 0.4557 ± 0.0008 0.4550 ± 0.0023 0.4341 ± 0.0023 0.4300 ± 0.0031 0.4517 ± 0.0008 0.4255 ± 0.0011
Table 4: Comparison with state-of-the-art methods in the literature in terms of runtime speed Method FMMMF [8] MMMF-A100 [4] NSVD NPCA
Run Time 15 hours 7 hours 0.09 hours 0.69 hours
and deteriorates very little as more iterations performed (see Figure 2), which indicates overfitting is perhaps not a big issue for NPCA. We conjecture that NPCA is immune to overfitting, as long as M � N , which is often the case in applications. In our second setting, in order to directly compare with several state-of-the-art results on EachMovie, we follow [8, 4], where 36,656 users with no less than 20 ratings are used; for each user, one rating is randomly withdrawn for testing and the remaining ratings are used for training; in each random trial, 30,000 random users are selected for training, and a performance of “weak generalization” is evaluated on the training users’ withdrawn ratings; then the learned model is used to make predictions on the rest 6,656 users, and the so-called “strong generalization” is evaluated. For more details please refer to [8]. We repeat this experiment randomly for 20 times in testing each method. Following the performance metric by [8, 4], we report the average NMAE (i.e., mean absolute error normalized by 1.944) in Table 3, where FMMMF is the fast max-margin matrix factorization, and MMMF-A100 is an ensemble of 100 MMMF models with different random seeds for initialization. The runtime speed is reported in Table 4, which shows both nonparametric models work very well in terms of speed. We note that FMMMF and MMMF-A100 both aim to directly minimize the NMAE loss, while NPCA works on square loss. This perhaps explains why NSVD does not give low NMAE. On the other hand, NPCA applies square loss too, but it results in the lowest NMAE in Table 3.
Table 5: RMSE of various matrix factorization methods on the Netflix test set Method Baseline VB [6] SVD [5] BPMF [10] NSVD NPCA
RMSE 0.9514 0.9141 0.920 0.8954 0.9216 0.8926
Table 6: Influence of Initialization of K on NPCA Initialization Option 1. Identity Matrix 2. Emp. Covariance + Identity Mat. 3. Emp. Cov. + Identity Mat. + Bias
6.2
RMSE 1.0873 ± 0.0003 1.0817 ± 0.0003 1.0795 ± 0.0003
Netflix Problem
The Netflix data are collected representing the distribution of ratings Netflix.com obtained during a period of 19982005. The released training data consists of 100,480,507 ratings from 480,189 users on 17,770 movies. In addition, Netflix also provides a set of validation data with 1,408,395 ratings. Therefore there are 98.81% of elements are missing in the rating matrix. In order to evaluate the prediction accuracy, there is a test set containing 2,817,131 ratings whose values are withheld and unknown for all the participants. In order to assess the RMSE on the test set, participants need to submit their results to Netflix. Since results are evaluated on exactly the same test data, it offers an excellent platform to compare different algorithms. We run the Algorithms 1 and 3 on the training data plus a random set of 95% of the validation data, the remaining 5% of the validation data are used for the stopping criterion. In the following Table 5 we report the results obtained by the two models, and quote some state-of-the-art results reported in the literature by matrix-factorization methods. We note that people reported superior results by combining heterogenous models of different nature, e.g. [2]. In this paper we only compare with those achieved by single models. In the table, the Baseline result is made by Netflix’s own algorithm. BPMF is Bayesian probabilistic matrix factorization using MCMC [10], which produces so far the stateof-the-art accuracy by low-rank methods. NPCA achieves an even better result than BPMF, improving the accuracy by 6.18% from the baseline. NSVD does not perform very well on this data set, we suspect more work should be done on fine-tuning the regularization parameter. However this contrasts the advantage of NPCA that has no parameter to tune. In terms of run-time efficiency, both algorithms use about 5 hours per iteration. The NPCA result is obtained by 30 iterations. In contrast, BPMF (with 300 dimensions) takes several hundreds of iterations, 200 minutes per iteration, to burn in, and then needs other hundreds of iterations to compute the average.
6.3
Further Investigation on NPCA
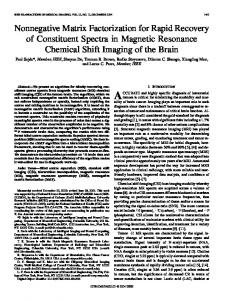
NPCA performs very well in all of our experiments. In this section we present a closer look at some empirical behaviors of this model. First, as the optimization is non-convex, we would exam how initialization of K can influence the outcome of the model. We initialize K in the following way K = a · C emp + b · I + c where I is the N × N identity matrix, [a, b, c] linear weights taking values from [0, 1], and C emp ∈ RN ×N a rough empirical covariance calculated from the training data, emp Cj,j 0 =
pM Mσ0 σ σ 2
j
j0
j
M X
j 0 i=1
(xi,j − µj )(xi,j 0 − µj 0 )
Figure 1: RMSEs obtained from initializing K via various ways of combining empirical covariance and identity matrix. The bar shows the relationship between gray level and RMSE. where σ0 and σj are the standard deviations estimated, respectively, from ratings on all the items and those on item j, Mj is the number of observed ratings for item j, and µj is the average of ratings on item j. Furthermore, we let xi,j = µj if it is missing. Following the same setting of Table 1, the performances of the following three initialization options are reported in Table 6: (1) using identity matrix only; (2) combining empirical covariance and identity matrix; (3) combining empirical covariance, identity matrix, and bias, where in each case the configuration of [a, b, c] is determined based on the first of the totally 20 training/test partitions. Table 6 shows that different initialization options lead to slightly different results, but all are better than those of competitive methods reported in Table 1. In Figure 1 we visualize the sensitivity of RMSE under various a and b with fixed c = 0.5. The result is based on the first partition only. We find that the performance is almost insensitive to c (the evidence is not provided here due to space limitation). Based on this figure we choose a = 0.3, b = 0.5, and c = 0.5 in the initialization option 3 in Table 6, which also leads to the result in Table 1. Since all the above results are obtained by limiting the maximum number of EM iterations to be 30, one may ask whether the superior performance is attributed to an implicit regularization imposed by early stopping. In Figure 2 we demonstrate that, as the iterations go further, very little drop of accuracy is observed under various initialization conditions. Interestingly, it seems the major effect of a better initialization is the faster convergence. Another interesting and important aspect of NPCA is its ability to output not only the mean but also the uncertainty of predictions. It follows the E-step that the predictive standard deviation is calculated by Std(xi,j ) =
p
Kj,j − Kj,Oi (KOi )−1 KOi ,j
We collect all the predictions whose uncertainty calculated by the above falls in to [s − 0.05, s + 0.05], and measure the standard deviation of their prediction residuals. Since 99.9% of the predictive standard deviations are in [0.7, 1.6], we let s ∈ {0.7, 0.8, . . . , 1.6}. The obtained results are shown in Figure 3, which indicates that NPCA can give excellent assessment on the uncertainty of predictions. We believe this
8.
Figure 2: The convergence of RMSEs on test set over EM iterations
Figure 3: Standard deviations of prediction residuals vs. standard deviations predicted by NPCA
aspect should be further exploited in future development of recommender systems.
7.
CONCLUSION
In this paper we proposed nonparametric matrix factorization models for solving large-scale collaborative filtering problems. We considered two examples, singular value decomposition (SVD) and probabilistic principal component analysis (pPCA). This is perhaps the first work showing that nonparametric models are in fact very practical on very large-scale data containing 100 millions of ratings. Moreover, though probabilistic approaches are usually believed not as efficient as non-probabilistic methods, we managed to make NPCA as fast as its non-probabilistic counterpart. In terms of the predictive accuracy, we observed that nonparametric models often outperformed the low-rank methods, and probabilistic models delivered more accurate results than non-probabilistic models. Furthermore, the computation tricks can be used for speeding up not only nonparametric models, but also large-dimensional matrix factorization on large-scale sparse matrices.
Acknowledgement We thank Dr. Dennis DeCoste for a fruitful discussion, and the reviewers for constructive comments.
REFERENCES
[1] J. Abernethy, F. Bach, T. Evgeniou, and J.-P. Vert. Low-rank matrix factorization with attributes. Technical report, Ecole des Mines de Paris, 2006. [2] R. M. Bell, Y. Koren, and C. Volinsky. The BellKor solution to the Netflix prize. Technical report, AT&T Labs, 2007. [3] E. J. Cand`es and T. Tao. The power of convex relaxation: Near-optimal matrix completion. Submitted for publication, 2009. [4] D. DeCoste. Collaborative prediction using ensembles of maximum margin matrix factorization. In The 23rd International Conference on Machine Learning (ICML), 2006. [5] M. Kurucz, A. A. Benczur, and K. Csalogany. Methods for large scale SVD with missing values. In Proceedings of KDD Cup and Workshop, 2007. [6] Y. J. Lim and Y. W. Teh. Variational Bayesian approach to movie rating prediction. In Proceedings of KDD Cup and Workshop, 2007. [7] C. E. Rasmussen and C. K. I. Williams. Gaussian Processes for Machine Learning. The MIT Press, 2006. [8] J. D. M. Rennie and N. Srebro. Fast maximum margin matrix factorization for collaborative prediction. In The 22nd International Conference on Machine Learning (ICML), 2005. [9] S. Roweis and Z. Ghahramani. A unifying review of linear Gaussian models. Neural Computaion, 11:305–345, 1999. [10] R. Salakhutdinov and A. Mnih. Bayesian probabilistic matrix factorization using Markov chain Monte Carlo. In The 25th International Conference on Machine Learning (ICML), 2008. [11] B. Sch¨ olkopf and A. J. Smola. Learning with Kernels. MIT Press, 2002. [12] N. Srebro, J. D. M. Rennie, and T. S. Jaakola. Maximum-margin matrix factorization. In Advances in Neural Information Processing Systems 18 (NIPS), 2005. [13] G. Takacs, I. Pilaszy, B. Nemeth, and D. Tikk. On the gravity recommendation system. In Proceedings of KDD Cup and Workshop, 2007. [14] M. E. Tipping and C. M. Bishop. Probabilistic principal component analysis. Journal of the Royal Statisitical Scoiety, B(61):611–622, 1999. [15] M. Wu. Collaborative filtering via ensembles of matrix factorizations. In Proceedings of KDD Cup and Workshop, 2007. [16] K. Yu, J. Lafferty, S. Zhu, and Y. Gong. Large-scale collaborative prediction using a nonparametric random effects model. In The 25th International Conference on Machine Learning (ICML), 2009. [17] K. Yu and V. Tresp. Learning to learn and collaborative filtering. In NIPS workshop on “Inductive Transfer: 10 Years Later”, 2005. [18] Y. Zhang and J. Koren. Efficient Bayesian hierarchical user modeling for recommendation systems. In The 30th ACM SIGIR Conference, 2007.