IEEE Trans. on Image Processing, 2014, 23(12), pp. 5274–5283 1
Fast Ordering Algorithm for Exact Histogram Specification Mila Nikolova (Senior Member IEEE), and Gabriele Steidl
Abstract—This paper provides a fast algorithm to order in a meaningful, strict way the integer gray values in digital (quantized) images. It can be used in any exact histogram specification based application. Our algorithm relies on the ordering procedure based on the specialized variational approach proposed in [1]. This variational method was shown to be superior to all other state-of-the art ordering algorithms in terms of faithful total strict ordering but not in speed. Indeed, the relevant functionals are in general difficult to minimize because their gradient is nearly flat over vast regions. In this paper we propose a simple and fast fixed point algorithm to minimize these functionals. The fast convergence of our algorithm results from known analytical properties of the model. Our algorithm is equivalent to an iterative nonlinear filtering. Further we show that a particular form of the variational model gives rise to much faster convergence than other alternative forms. We demonstrate that only a few iterations of this filter yield almost the same pixel ordering as the minimizer. Thus we apply only few iteration steps to obtain images whose pixels can be ordered in a strict and faithful way. Numerical experiments confirm that our algorithm outperforms by far its main competitors. Index Terms—Exact histogram specification, strict ordering, variational methods, fully smoothed L1 -TV models, nonlinear filtering, fast convex minimization
I. I NTRODUCTION Histogram processing is a technique with numerous applications, e.g., in image normalization and enhancement, object recognition, and invisible watermarking, [2]–[5]. The goal of exact histogram specification (HS) is to transform an input image into an output image having a prescribed histogram. For a uniform target histogram we speak about histogram equalization (HE). Consider digital (i.e. quantized) M × N images f with L gray values Q := {q1 , · · · , qL }.. For 8-bit images we have L = 256 and Q = {0, · · · , 255}. We reorder the image columnwise into a vector of size n := M N and address the pixels by the index set In := {1, · · · , n}. The histogram of f , denoted by hf , is given by hf [qk ] = ♯ {i ∈ In | f [i] = qk }, k = 1, . . . , L, where ♯ stands for cardinality. In theory, histogram specification uses the relation between the cumulative density function of an arbitrary distributed continuous random variable and a uniformly distributed one, see [3]. However, for digital images we are confronted with a large Copyright (c) 2013 IEEE. Personal use of this material is permitted. M. Nikolova is with the CMLA - CNRS, ENS Cachan, 61 av. President Wilson, 94235 Cachan Cedex, France (email:
[email protected]). Her work was supported by the “FMJH Program Gaspard Monge in optimization and operation research”, and by the support to this program from EDF. G. Steidl is with the Dept. of Mathematics, University of Kaiserslautern, Paul Ehrlich Str. 31, 67663 Kaiserslautern, Germany (email:
[email protected]).
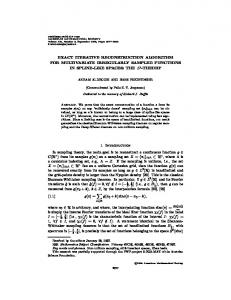
number of n discrete variables taking only L possible values (i.e., n ≫ L). Then the target histogram can almost never be satisfied exactly. Histogram specification is an ill-posed problem for digital images. The Matlab function histeq is expected to produce HE but it usually fails. The importance of a meaningful strict ordering of pixels prior to histogram specification is illustrated in Fig. 1; see the comments in the caption. In this paper we focus on exact histogram specification to a target histogram b h = (b h1 , . . . , b hL ) for the gray values P = {0, . . . , L − 1}. If the pixels values of our image are pairwise different so that they can be strictly ascending ordered, exact histogram specification can be easily done by dividing the corresponding ordered list of indices into L groups and assigning gray value 0 to the first b h1 pixels, gray value 1 to the second b h2 pixels and so on until gray value L−1 is assigned to the last b hL pixels. This simple procedure yields good results if one has a meaningful strict ordering of all pixels in the input image. Fig. 1 demonstrates the importance of ordering for histogram equalization. Research on this problem has been conducted for four decades already [7]. State-of-the-art methods are - the local mean ordering (LM) of Coltuc, Bolon and Chassery [8], - the wavelet-based ordering (WA) of Wan and Shi [9], - the variational approach (VA) of Nikolova, Wen and Chan [1] based on the minimization of a fully smoothed ℓ1 -TV functional. The first two methods extract for any pixel f [i] in the input image K auxiliary informations, say κk [i], k ∈ IK , where κ1 := f . Then an ascending order “≺ ” for all pixels could ideally be obtained using the rule i≺j and
if
κs [i] < κs [j] for some s ∈ IK
κk [i] = κk [j] for all 1 ≤ k < s.
(1)
The third method uses an iterative procedure to find the minimizer of a specially designed functional related to f which components can be ordered in a strict way. The numerical results in [1] have shown that VA clearly outperforms LM and WA in terms of quality of the ordering and memory requirements. However, the minimizer was computed by the Polak-Ribi´ere algorithm and the whole ordering algorithm was slower than LM and WA. Contributions. We propose a simple fixed point algorithm that attains the minimizer of fully smoothed ℓ1 -TV functionals with remarkable speed and precision. In this algorithm all needed derivative and inverse functions can be given in
2
512
512 512
512
HE by histeq
original image 64
64
512
64
64
512 449 512
0
HE ours
64
512 449 512
HE by sort
255
64
512 449 512
0
64
255
449 512
0
255
64
Fig. 1. A meaningful strict ordering is indeed crucial for histogram equalization (HE). First row: The pixels of a completely black image (left) are strictly ordered using the Matlab routine sort which sorts equal pixels columnwise ascending. The resultant HE image (right) is perfectly equalized and becomes lighter from left to right. Second row: The original image ’sand’ (http://sipi.usc.edu/database/) of size 512 × 512 and different equalizations: Matlab histeq, Matlab sort and our sorting algorithm preceding the HE step (last two images). The third image still has the lighting effects from left to right. Third row: The corresponding histograms. Fourth row: Zooms of the images in the second row (rows from 1 to 64 and columns from 449 to 512). It can be seen that the texture generated by our HE algorithm is more regular and looks more natural than the other ones.
an explicit form, so our minimization scheme amounts to a particular nonlinear filter. Convergence and parameter selection are explained based on new theoretical results and on few relevant facts from [1] and [11]. The √ classical smooth approximation of the ℓ1 norm is θ1 (t) = t2 + α for α ' 0; it was used in [1] together with the Polak-Ribi´ere algorithm, and in the conference paper [10]. Noticing that the derivatives and the inverses for θ1 are slow to compute, we looked for other approximations where these functions are easy to compute: see θ2 in Tab. I. We demonstrate that in our context, both approximations yield the same minimizer, up to negligible errors. Using θ2 instead of θ1 in the fixed point algorithm reduces the running time by 20 %. We observed that for nearly all images, a meaningful strict ordering of all pixels is obtained only after a very small number of iterations. Consequently, we use only few (e.g. 3 to 5) iterations with our nonlinear filter to get the information needed for a meaningful strict ordering. All these facts decrease the running time from paper [1] by a factor between 50 and 30! In contrast to the LM and the WA methods that extract the ordering based on K images, our algorithm requires just a single ordering of one image. Numerical tests confirm that our new algorithm, involving the function θ2 and the needed small number of iterations, outperforms by far all other relevant ordering methods in terms of quality and speed.
e.g., image normalization and image enhancement, among others. We have used our algorithm successfully for hue and range preserving HS based color image enhancement in [2].
As already pointed out, one can design fast HS methods based on our ordering algorithm. Therefore, the present paper provides the background for any exact HS based application,
We will apply forward differences to the rows and columns of images, i.e., with respect to the horizontal and vertical directions. Since we consider N × M images columnwise
Outline. In Section II we review the specialized variational approach and some of its properties proved in [1], [11] which are relevant to this work. In Section III, we propose a simple fixed point algorithm to find a minimizer of our functional. The reasons for its efficiency and effectiveness are explained. Section IV provides numerical examples. We compare speed and accuracy in the sense of a faithful total strict ordering of our algorithm with state-of-the art algorithms and provide a histogram equalization inversion comparison. Experiments clearly demonstrate that only few iterations of our algorithm are necessary to obtain promising ordering results. Conclusions are given in Section V. II. T HE FULLY SMOOTHED ℓ1 −TV
MODEL
Let DN denote the forward difference matrix −1 1 −1 1 DN := ∈ RN −1,N . .. . −1 1
3
reordered into vectors of length n = M N , the forward difference operator applied to these images reads as ( ) IM ⊗ D N G := ∈ Rr,n , D M ⊗ IN where IN is the N × N identity matrix, ⊗ denotes the Kronecker product and r = 2M N − M − N . We consider functionals of the form J(u, f ) := Ψ(u, f ) + βΦ(u), ∑
with Ψ(u, f ) :=
i∈I ∑n
Φ(u) :=
β>0
(3)
j∈Ir
Here (Gu)[j] denotes the jth component of the vector Gu ∈ Rr . One could additionally use diagonal differences to improve the rotation invariance of Φ(u). However, our experiments have shown that the simple forward differences in horizontal and vertical directions are enough to enable the minimizer of J to give rise to a prompt sorting. Following [1], the essence for achieving a strict ordering is that the functions ψ(·) := ψ(·, α1 ) and φ(·) := φ(·, α2 ) belong to a family of functions θ(·, α) : R → R, α > 0, satisfying the requirements in assumptions H1 and H2 described next. The rationale for these choices was extensively discussed in [1]. For simplicity, the parameters α1 and α2 are omitted when they are not explicitly involved in our derivations. Assumptions. In the following, we systematically denote d d2 θ(t, α) and θ′′ (t, α) := 2 θ(t, α). dt dt H1 For any fixed α > 0 the function t 7→ θ(t, α) is in C 2 (R) and even, i.e., θ(−t, α) = θ(t, α) for all t ∈ R. Its derivative θ′ (t, α) is strictly increasing with limt→∞ θ′ (t, α) = 1, where the upper bound is set to 1 just for definiteness. The second derivative θ′′ (t, α) is decreasing on [0, +∞). H2 For fixed t > 0, the function α 7→ θ(t, α) is strictly decreasing on (0, +∞) with θ′ (t, α) :=
lim θ′ (t, α) = 1
α→0
and
lim θ′ (t, α) = 0 .
α→∞
Under these assumptions ψ and φ are smooth convex approximations of the absolute value function. Hence the functional J(·, f ) in (2)-(3) amounts to a fully smoothed ℓ1 -TV model. ¿From H1 it follows that θ′ (t, α) is odd and has an inverse function ξ(t, α) := (θ′ )−1 (t, α). (4) Clearly, t 7→ ξ(t, α) is also odd and strictly increasing on (−1, 1). Moreover, since θ′′ (t, α) is positive and decreasing on [0, +∞), the function ξ is differentiable and ξ ′ (t, α) =
1 > 0. θ′′ (ξ(t))
θ2
θ′
θ t2
+α ( |t| − α log 1 +
|t| α
)
√
t
t2 +α t α+|t|
ξ = (θ ′ )−1 √ α t 1−t 2 αt 1−|t|
TABLE I C HOICES FOR θ(·, α) TOGETHER WITH THE USED INVERSE FUNCTIONS .
ξ′
(
√
√
α
1−t2 )3 α (1−|t|)2
DERIVATIVES AND
(2)
ψ(u[i] − f [i]), φ ((Gu)[j]).
θ1
√
(5)
So t 7→ ξ ′ (t, α) is also increasing on (0, 1). There are many possible choices of functions θ meeting H1 and H2, see [1]. In our numerical tests we use the functions θ = ψ = φ with α1 = α2 = α given in the following table:
Since J(·, f ) is a strictly convex, coercive functional it has a unique minimizer u b ∈ Rn . The next theorems summarize several properties of this minimizer which are important for our faithful and fast sorting algorithm. The first theorem proven in [1, Theorem 1] ensures that the entries of the minimizer differ in general pairwise from each other so that u b provides an auxiliary information for ordering the pixels of f . Theorem 1. (Strict ordering information) Let ψ and φ fulfill H1 and H2. Then there exists a dense open subset Kn of Rn such that for any f ∈ Kn the minimizer u b of J(·, f ) satisfies u b[i] ̸= u b[j],
∀ i, j ∈ In , i ̸= j,
u b[i] ̸= f [i],
∀ i ∈ In .
(6)
The fact that Kn is dense and open in Rn means that the property in (6) is generically true. This result is much stronger than saying that (6) holds true almost everywhere on Rn . 1 So the minimizers u b that fail (6) are quite rare. The second theorem provides an estimate of ∥f − u b∥∞ which has been proven by the authors in [11, Theorems 1 and 2]. Theorem 2. (Distance of u b from f ) Let ψ and φ fulfill H1 and H2 and let β < 14 . Then, for any f ∈ Rn , the minimizer u b of J(·, f ) satisfies ( ) ( ) ∥b u − f ∥∞ ≤ (ψ ′ )−1 4β, α1 = ξ 4β, α1 , (7) where ξ := (ψ ′ )−1 . Further it holds ( ) ∥b u − f ∥∞ ↗ ξ 4β, α1 as α2 ↘ 0 (8) ) { ( if ν(f := max )} i∈I min f{[i] − f [i − 1] , f [i] − f [i − M ] > 2ξ 4β, α1 , where I := i ∈ int I : (f [i] − f [i − 1])(|f [i] − n } f [i − M ]) ̸= 0 ̸= ∅. Here int In denotes the set of indices of non boundary pixels. The upper bound (7) clearly indicates how to select the parameters in order to guarantee that |f [i]− u b[i]| < 0.5 for any i ∈ In . Consequently, if for f [i] ∈ {0, . . . , 255}, i ∈ In , the relation f [i] < f [j] holds true, then also u b[i] < u b[j] such that the initial ordering of pairwise different pixels is preserved. More precisely, we obtain for β = 0.1 and α1 = α2 = 0.05 that ∥b u − f ∥∞ ≤ 0.0976 if ψ = φ = θ1 and ∥b u − f ∥∞ ≤ 0.0333 if ψ = φ = θ2 . 1 An almost everywhere true property requires only that Kn is dense in Rn . But Kn may not contain open subsets. There are many examples. For instance, K := [0, 1] \ {x ∈ [0, 1] : x is rational} is dense in [0, 1] and K does not contain open subsets.
4
Concerning the lower bound (8) we emphasize that the assumption on νf is realistic for natural images with 8 bit gray values; see [11].
Theorem 3. (Convergence of fixed point algorithm) Let ψ and φ fulfill H1. Let α1 , α2 > 0 and β < 14 be chosen such that 8β ξ ′ (4β, α1 ) φ′′ (0, α2 ) < 1. (10)
III. FAST MINIMIZATION AND SORTING ALGORITHMS
Then, for any f ∈ Rn , the sequence {u(r) }r generated by Algorithm 1 converges to the minimizer u b of J(·, f ). ( ) T ′ Proof: Let T (u) := f − ξ β G φ (Gu(r−1) ) . By Ostrowski’s theorem [12] it is enough to prove that the Jacobian matrix ∇T (u) becomes smaller than 1 in some norm on Rn for all u ∈ Rn . Since ( ) ( ) ∇T (u) = β diag ξ ′ (βGT φ′ (Gu)) GT diag φ′′ (Gu) G
The vector u b is a minimizer of J(·, f ) in (2) if and only if ∇J(b u, f ) = 0 which is equivalent to ∇Ψ(b u, f ) = −β∇Φ(b u). By (3) this can be rewritten as ( ′ )n ( )r ψ (b u[i] − f [i]) i=1 = −βGT φ′ ((Gb u)[j]) j=1 . With ξ := (ψ ′ )−1 (·, α1 ) as in (4) and since ξ is odd we obtain ( ) u b = f − ξ β GT φ′ (Gb u) . (9) ( ) r Here φ′ (Gb u) := φ′ ((Gb u)[j]) j=1 and ξ is applied componentwise. This is a fixed point equation for u b which gives rise to the following fixed point algorithm to compute u b: Algorithm 1 Minimization Algorithm Initialization: u(0) = f , stopping parameter ε For r = 1, . . . compute until ∥∇J∥∞ ≤ ε ( ) u(r) = f − ξ β GT φ′ (Gu(r−1) ) As stopping criterion we propose ∥∇J∥∞ ≤ 10−6 . In all experiments with images of various content and size we realized that the required precision was reached in general within less than 35 iterations. The efficiency of the algorithm relies on two clues: - By Theorem 2 the vector u(0) = f is very close to the fixed point u b and is therefore a good starting point. - The functions φ′ and ξ appearing in the algorithm are given explicitly, see Table I. By the following corollary the sequence of iterates {u(r) }r∈N is bounded if β < 14 . Consequently, it has a convergent subsequence. Moreover, for appropriately chosen α1 all iterates fulfill again the important property |f [i] − u(r) [i]| < 0.5, i ∈ In such that the original ordering of the pixels in f is still pertinent in u(r) . Corollary 1. (Distance of u(r) from f : upper bound) Let ψ and φ fulfill H1 and let β < 14 . Then, for any f ∈ Rn , all iterates u(r) generated by Algorithm 1 satisfy ( ) ( ) ∥u(r) − f ∥∞ ≤ (ψ ′ )−1 4β, α1 = ξ 4β, α1 . Proof: By H1 we can estimate ( ) ∥u(r) − f ∥∞ ≤ (ψ ′ )−1 β∥GT φ′ (Gu(r−1) )∥∞ . Using |φ′ (t)| ≤ 1 and the sparsity of GT we obtain ∥GT φ′ (Gu(r−1) )∥∞ ≤ 4 and since (ψ ′ )−1 is increasing on [−1, 1] for β < 14 finally ( ) ∥u(r) − f ∥∞ ≤ (ψ ′ )−1 4β, α1 . The following theorem provides a convergence result for our fixed point algorithm.
we obtain
( ) ∥∇T (u)∥2 ≤ β ∥diag ξ ′ (βGT φ′ (Gu) ∥2 ( ) ∥GT ∥2 ∥diag φ′′ (Gu) ∥2 ∥G∥2 .
Since (φ′′ is )monotone decreasing on [0, +∞) we get ∥ diag φ′′ (Gu) ∥2 ≤ φ′′ (0). Further, we have by the definition of G that ∥GT ∥2 ∥G∥2 = ∥GT G∥2 < 8. Note that GT G is a discrete Laplacian with Neumann boundary conditions and that the bound is sharp in the sense that ∥GT G∥2 approaches 8 as n → ∞. It remains to estimate ξ ′ (βGT φ′ (Gu)). Regarding that ′ |φ (t)| ≤ 1 for all t ∈ R we conclude ∥GT φ′ (Gu)∥∞ ≤ ∥G∥1 ≤ 4. Since ξ ′ increases on (0, 1) by (5) and 4β < 1 we obtain finally ( ) ∥diag ξ ′ (βGT φ′ (Gu) ∥2 ≤ ξ ′ (4β). Multiplying the parts together we obtain the assertion. For ψ = φ from Table I the left-hand side of (10) becomes √
θ1 α1 α2
√
θ2 8β
(1−(4β)2 )3
8β α1 α2 (1−4β)2
.
For α1 = α2 these values are smaller than 1 if β < 0.0976 and β < 0.0670, for θ1 and θ2 , respectively. Remark 1. The upper bound in (10) is an overestimate since one has φ′′ (Gu, α2 ) = φ′′ (0, α2 ) only for constant images u. For our ordering purpose we are not really interested in the minimizer u b of J(·, f ), but want to use the sorting of its entries to get a meaningful ordering of the original image. We observed that typically the pixel ordering obtained after a small number of steps of the minimization algorithm does not change in the subsequent steps except for very few pixels. This fact led us to propose the following efficient ordering algorithm for R ≪ 35 (e.g., R = 5): Algorithm 2 Ordering Algorithm Initialization: u(0) = f , stopping parameter R 1. For r = 1, . . . , R, using ξ and φ′ in Tab. I, compute ( ) u(r) = f − ξ β GT φ′ (Gu(r−1) ) 2. Order the values in In according to the corresponding ascending entries of u(R) .
5
IV. N UMERICAL C OMPARISON OF S ORTING A LGORITHMS In this section we demonstrate that our Ordering Algorithm 2 with ψ = φ = θ2 is actually the best way (in terms of speed and quality) to order pixels in digital images. Note that extensive qualitative comparisons of the variational ordering method (VA) with the (fully iterated) Polak-Ribi´ere algorithm were done in [1]. These experiments have already shown that VA clearly outperforms other state-of-the-art algorithms as LM [8] and WA [9] concerning quality. Here we want to demonstrate that our new ordering algorithm ensures the same quality, in particular a faithful strict ordering, but is much faster than the previous implementations. We apply VA with parameters (β, α1 , α2 ) = (0.1, 0.05, 0.05) in the variants - VA-PR: with Polak-Ribi´ere algorithm, function θ1 and stop if ∥∇J∥∞ < 10−6 but at most 35 iterations as proposed in [1], - VA-θk (R): with fixed point algorithm with function θk , k ∈ {1, 2} and R iterations. We want to mention that the estimate in Theorem 3 is too restrictive (see Remark 1) and we have chosen β slightly larger which still provides a convergent iteration scheme. Further we use the notation LM(K) and WA(K) for the corresponding algorithms with K − 1 filter applications. Recall that K = 6 for LM and K = 9 for WA were recommended by the authors. Remark 2. (Filtering versus sorting) The above algorithms contain a filtering and a sorting step which behave quite differently: - LM and WA: Both algorithms apply K − 1 simple linear filters which is cheap. For example, if n = N 2 is the number of image pixels, then 24n, 44n, 64n (mainly) additions are necessary for the LM-ϕ filtering procedure in the cases K = 4, 5, 6, respectively. Note that this filtering can be also done in a cheaper way using the ψ-filters employed in [8] for the theoretical study of the LM algorithm. The resulting K images must be lexicographically ordered, see (1). This can be done in O(n log n), but the concrete factor depends on K and the image content. In our numerical experiments we have used the sortrows Matlab function which calls for K ≥ 4 a C program. In our numerical examples with K = 6 this sorting procedure was three to twelve times (increasing with increasing number of pixels) slower than the filtering procedure. Finally, we mention that larger images, e.g., of size 5616 × 3744 taken by usual commercial cameras, cannot be handled by sortrows. Here a more sophisticated sequential sorting implementation in a better adapted programming language may be used with storage requirement 2n. However, the speed relation between linear filtering and lexicographical sorting will be kept. - VA: The nonlinear filtering in the VA procedure is more demanding than the above linear one. However, for φ = ψ = θ2 we have (up to absolute values) only to compute additions and multiplications. In summary, we have to perform 13n additions or multiplications in each iteration step. Indeed our numerical experiments have confirmed that our filtering behaves as O(n). The subsequent sorting procedure sort of one image which
requires n log n operations is faster than the filtering step, in our examples with R = 5 nearly 4 times. We summarize: for LM(K) and WA(K), the lexicographical sorting of K images is more time consuming than the simple linear filtering. In our ordering algorithm, the nonlinear filtering requires more time than the sorting step. The running time for our filtering is linear in the number of pixels n and is cheaper for θ2 than for θ1 . All algorithms are implemented in Matlab2012a and executed on a computer with an Intel Core i7-870 Processor (8M Cache, 2.93 GHz) and 8 GB physical memory, 64 Bit Linux. The tests are performed for four groups of digital 8-bit images of increasing size N × N , where N = 256, 512, 1024, 2048, presented in Fig. 2. The results in all tables give the means over 100 runs for each image of all tested algorithms. We present two numerical experiments: 1. Ordering of natural images: The results for LM(6), WA(9) and the variational approaches are reported in Tab. II. Here Fail gives the percentage of image pixels which cannot be totally ordered. The fast VA algorithm with θ2 and 5 iterations VA-θ2 (5) clearly outperform the LM(6) and WA(9) algorithms both with respect to Fail and computational time. The different VA algorithms show a similar Fail. However, compared to the Polak-Ribi´ere algorithm with θ1 suggested in [1], VA-θ2 (5) reduces the running time by a factor of 50 to 30. Further, our fixed point algorithm needs 20 % less computation time for VA-θ2 than for VA-θ1 . Tab. III shows the fail rate of LM and VA-θ2 for numbers K −1 and R of filter applications. It can be seen that after R = 2 applications of our nonlinear filter, the average percentage of pixels which cannot be sorted is nearly the same as for LM(6). However, for R = 5 steps of our nonlinear filter, nearly all pixels are faithfully sorted. Fig. 3 depicts the filtering time, the sorting time and the overall running time of LM(K) and VA-θ2 (R) for R = K − 1 ∈ {1, . . . , 5}. The plots on the left (resp., on the right) give the means over 100 runs for all images in Fig. 2 of size 512 × 512 (resp., of size 1024 × 1024). The obtained curves are in agreement with Remark 2. 2. Histogram equalization inversion: In [8], histogram equalization inversion was shown to be a relevant way to evaluate up to what degree a sorting algorithm is meaningful. First the original 8-bit image f with histogram hf is mapped to an 8-bit image g with a uniform histogram (up to rounding errors). This requires the first application of an ordering algorithm. Then g is transformed to an 8-bit image f˜ with histogram hf which requires a second time an ordering algorithm. Tab. IV shows the PSNR 20 log10 (255M ·N/∥f − f˜∥2 ), the percentage of pixels Fail% which cannot be faithfully ordered averaged over the two applied ordering procedures and the computational time of the whole histogram equalization inversion process. Since VA-PR and VA-θ1 (R) give qualitatively, in terms of PSNR and FAIL, the same results as VA-θ2 (R) but VA-θ2 (R) is faster, we consider only VAθ2 (R), R ∈ {5, 35}. The VA-algorithms outperform LM(6) and WA(9) wrt PSNR and FAIL. Moreover, VA-θ2 (5) is the
6
256 × 256
chemical
clock
elaine
moon
tree
trui
airplane
boat
mandrill
raffia
stream
man
pentagon
smarties
stones
traffic
boys
plants
pont
church
violine
512 × 512
aerial 1024 × 1024
bark 2048 × 2048
eifel
Fig. 2. All 24 digital 8-bit images with their histograms used for our comparison. The size of the images ranges from 256 × 256 in the first row to 2048 × 2048 in the fourth row.
fastest algorithm.
The quality of our VA algorithms is emphasized by Fig. 4 which shows three difference images of the original image f and the images f˜ obtained after the histogram equalization inversion. The first row presents the original image trui and zooms of stones and church. The second and third rows show the results f − f˜ obtained by the LM and WA ordering, respectively. The fourth and the fifth rows depict the difference images f − f˜ corresponding to VA-θ2 (35) and VAθ2 (5), respectively. Both VA methods are able to reconstruct the original image more precisely than their competitors in particular in the vicinity of edges.
V. C ONCLUSIONS AND F UTURE W ORK In this paper we have proposed a fast algorithm to order strictly and reasonably the pixels in digital (integer valued) natural images. Our algorithm outperforms by far the stateof-the-art algorithms in speed and in quality to order the pixels. Thus it provides a background for any exact histogram specification based application. We have applied this algorithm for hue and range preserving enhancement of color images in [2] where we also handled large size images. Given an RGB image w = (wr , wg , wb ) the rough idea consists of the following two steps: (i) appropriate histogram specification of the intensity image f := 31 (wr + wg + wb ) using our proposed sorting algorithm which yields an enhanced intensity image fˆ.
7
method 256 × 256 chemical clock elaine moon tree trui means 512 × 512 aerial airplane boat mandrill raffia stream means 1024 × 1024 bark man pentagon smarties stones traffic means 2048 × 2048 eifel boys plants pont church violine means
Fail % Variational Method PR θ1 (35) θ2 (35) θ2 (5)
LM(6)
Computation Time Variational Method WA(9) PR θ1 (35) θ2 (35)
θ2 (5)
LM(6)
WA(9)
0.01 4.82 0.01 0.00 0.20 0.03 0.84
0.06 4.52 0.02 0.00 0.19 0.00 0.80
0.00 0.00 0.00 0.00 0.00 0.00 0.00
0.00 0.00 0.00 0.00 0.00 0.00 0.00
0.00 0.00 0.00 0.00 0.00 0.00 0.00
0.00 0.00 0.00 0.00 0.00 0.00 0.00
0.03 0.03 0.03 0.03 0.03 0.03 0.03
0.04 0.04 0.03 0.04 0.04 0.04 0.04
0.59 0.27 0.61 0.61 0.59 0.30 0.50
0.08 0.08 0.08 0.08 0.08 0.08 0.08
0.06 0.06 0.07 0.06 0.06 0.06 0.06
0.01 0.01 0.01 0.01 0.01 0.01 0.01
0.04 18.58 0.00 0.00 46.64 0.65 10.98
0.00 17.70 0.00 0.00 16.05 0.75 5.75
0.00 0.00 0.00 0.00 0.00 0.00 0.00
0.00 0.00 0.00 0.00 0.00 0.00 0.00
0.00 0.00 0.00 0.00 0.00 0.00 0.00
0.00 0.00 0.00 0.00 0.00 0.14 0.02
0.13 0.16 0.12 0.12 0.20 0.13 0.14
0.16 0.31 0.15 0.14 0.35 0.19 0.22
2.28 1.16 1.40 2.25 1.04 1.03 1.53
0.45 0.44 0.45 0.43 0.44 0.44 0.44
0.29 0.29 0.29 0.29 0.29 0.29 0.29
0.05 0.05 0.05 0.05 0.05 0.05 0.05
0.00 0.43 0.00 0.55 2.25 0.69 0.65
0.00 0.68 0.00 0.05 1.39 0.07 0.36
0.00 0.00 0.00 0.00 0.00 0.00 0.00
0.00 0.00 0.00 0.00 0.00 0.00 0.00
0.00 0.00 0.00 0.00 0.00 0.00 0.00
0.00 0.00 0.00 0.00 0.09 0.00 0.01
0.64 0.61 0.66 0.68 0.66 0.65 0.65
0.80 0.82 0.87 0.90 0.90 0.88 0.86
10.16 4.47 9.48 9.43 4.76 4.96 7.21
1.79 1.62 1.80 1.82 1.78 1.80 1.77
1.33 1.22 1.32 1.46 1.32 1.44 1.34
0.25 0.24 0.22 0.24 0.22 0.24 0.24
3.54 0.33 0.03 9.98 0.96 1.83 2.78
0.37 0.00 0.00 5.77 0.78 0.23 1.19
0.00 0.00 0.00 0.00 0.13 0.00 0.02
0.00 0.00 0.00 0.00 0.05 0.00 0.01
0.00 0.00 0.00 0.00 0.07 0.00 0.01
0.01 0.00 0.00 0.00 0.30 0.00 0.05
4.24 3.84 3.74 3.98 3.62 3.76 3.86
6.56 5.45 4.73 5.67 5.18 5.97 5.59
22.29 42.64 21.61 43.15 20.74 43.25 32.28
8.08 8.06 8.08 8.08 8.08 8.07 8.07
6.58 6.60 6.62 6.63 6.60 6.59 6.60
1.23 1.20 1.20 1.20 1.21 1.19 1.20
TABLE II C OMPARISON OF DIFFERENT ORDERING METHODS FOR THE IMAGES IN F IG . 2.
filtering (512 × 512)
filtering (1024 × 1024) 0.15 time in s
0.04
0.02
0 1
time in s
0.2
2
3 R
4
0 1
5
2
3 R
4
5
sorting (512 × 512)
sorting (1024 × 1024)
0.2
0.8
0.15
0.6
0.1 0.05 0 1
0.4 0.2
2
3 R
4
0 1
5
2
3 R
4
5
overall (512 × 512)
overall (1024 × 1024)
0.2
0.8
0.15
0.6 time in s
time in s
0.1
0.1 0.05 0 1
(ii) application of an affine transform to each pixel of the RGB image w such that the resulting image w ˆ = (w ˆr , w ˆg , w ˆb ) has the desired intensity fˆ and is in the range [0, 255]. The images w and w ˆ have the same hue.
0.05
time in s
time in s
0.06
0.4 0.2
2
3 R
4
5
0 1
2
3 R
4
5
Fig. 3. Comparison of filtering, sorting and overall computational time of LM(K) (solid ⋄) and VA-θ2 (R) (dashed ∗) for R = K − 1 = 1, . . . , 5 for the images in Fig. 2 of size 512 × 512 (left) and 1024 × 1024 (right).
R EFERENCES [1] M. Nikolova, Y.-W. Wen, and R. Chan, “Exact histogram specification for digital images using a variational approach”, Journal of Mathematical Imaging and Vision, vol. 46, no. 3, pp. 309–325, July 2013. [2] M. Nikolova and G. Steidl, “Hue and range preserving color image enhancement based on fast histogram specification. New algorithms, theory and applications”, IEEE Transactions on Image Processing, vol. 23, no. 9, pp. 4087–4100, Sep. 2014. [3] R. Gonzalez and R. Woods, Digital Image Processing, Addison-Wesley, 1993. [4] V. Caselles, J. L. Lisani, J. M. Morel, and G. Sapiro, “Shape preserving local histogram modification”, IEEE Transactions on Image Processing, vol. 8, no. 2, pp. 220–229, Feb. 1999. [5] D. Sen and P. Sankar, “Automatic exact histogram specification for contrast enhancement and visual system based quantitative evaluation”, IEEE Transactions on Image Processing, vol. 20, no. 5, pp. 1211–1220, May 2011. [6] N. Bassiou and C. Kotropoulos, “Color image histogram equalization by absolute discounting back-off”, Computer Vision and Image Understanding, vol. 107, 2007. [7] E. L. Hall, “Almost uniform distributions for computer image enhancement”, IEEE Transactions on Computers, vol. C-23, no. 2, pp. 207–208, Feb. 1974. [8] D. Coltuc, P. Bolon, and J.-M. Chassery, “Exact histogram specification”, IEEE Transactions on Image Processing, vol. 15, no. 6, pp. 1143–1152, 2006.
8
method 256 × 256 chemical clock Elaine moon tree trui means 512 × 512 aerial airplane boat mandrill raffia stream means 1024 × 1024 bark man Pentagon smarties stones traffic means 2048 × 2048 eifel boys plants pont church violine means
Fail % LM(6) θ2 (1)
θ2 (2)
θ2 (3)
θ2 (4)
θ2 (5)
2.97 47.51 7.78 4.60 19.51 31.72 19.02
0.07 8.69 0.06 0.00 1.12 0.07 1.67
0.00 0.47 0.00 0.00 0.00 0.00 0.08
0.00 0.02 0.00 0.00 0.00 0.00 0.00
0.00 0.00 0.00 0.00 0.00 0.00 0.00
0.04 18.58 0.00 0.00 46.64 0.65 10.98
23.05 91.07 15.67 2.59 99.51 56.38 48.04
0.02 38.06 0.00 0.00 29.02 1.53 11.44
0.00 0.19 0.00 0.00 0.15 0.32 0.11
0.00 0.00 0.00 0.00 0.01 0.21 0.04
0.00 0.00 0.00 0.00 0.00 0.14 0.02
0.01 1.29 0.03 4.09 7.24 4.41 2.85
0.00 0.43 0.00 0.55 2.25 0.69 0.65
5.62 28.85 23.90 49.21 49.18 44.93 33.61
0.00 0.91 0.00 0.16 2.32 0.48 0.64
0.00 0.09 0.00 0.02 0.54 0.00 0.11
0.00 0.00 0.00 0.01 0.21 0.00 0.04
0.00 0.00 0.00 0.00 0.09 0.00 0.01
23.36 5.02 0.56 18.09 3.71 15.52 11.04
3.54 0.33 0.03 9.98 0.96 1.83 2.78
81.26 69.22 31.92 44.87 66.01 87.59 63.48
0.32 0.00 0.01 10.54 1.07 0.12 2.01
0.05 0.00 0.00 0.02 0.48 0.00 0.09
0.02 0.00 0.00 0.00 0.36 0.00 0.06
0.01 0.00 0.00 0.00 0.30 0.00 0.05
LM(2)
LM(3)
LM(4)
LM(5)
68.93 74.55 75.02 76.65 67.89 83.46 74.42
6.40 43.56 12.00 8.57 17.65 32.82 20.16
0.19 23.61 0.56 0.20 4.74 4.14 5.57
0.03 10.76 0.03 0.00 0.91 0.31 2.01
0.01 4.82 0.01 0.00 0.20 0.03 0.84
85.69 96.38 87.59 81.17 99.91 95.35 91.02
34.97 86.27 23.76 7.36 99.22 53.66 50.87
5.10 67.71 0.92 0.12 95.08 13.28 30.37
0.37 38.24 0.02 0.00 77.35 2.06 19.67
96.19 95.82 96.42 97.51 96.09 96.41 96.41
31.40 48.63 46.89 78.66 71.57 68.06 57.54
0.60 6.92 2.21 29.81 30.10 25.57 15.87
98.89 99.22 98.27 98.86 98.62 99.41 98.88
87.50 87.48 68.04 78.36 82.32 92.91 82.77
65.23 41.00 12.72 30.59 30.77 61.18 40.25
C OMPARISON OF LM(K) WITH VA-θ2 (R) WITH
RESPECT TO
TABLE III FAIL FOR AN INCREASING NUMBER R = K − 1 OF FILTER APPLICATIONS .
[9] Y. Wan and D. Shi, “Joint exact histogram specification and image enhancement through the wavelet transform”, IEEE Transactions on Image Processing, vol. 16, no. 9, pp. 2245–2250, 2007. [10] M. Nikolova, “A fast algorithm for exact histogram specification. simple extension to colour images”, in Scale Space and Variational Methods in Computer Vision. Lecture Notes in Computer Science 7893, Springer, 2013, pp. 174–185. [11] F. Baus, M. Nikolova, and G. Steidl, “Fully smoothed ℓ1 -TV models: Bounds for the minimizers and parameter choice”, Journal of Mathematical Imaging and Vision, vol. 48 no. 2 pp. 295–307, 2014. [12] J. Ortega and W. Rheinboldt, Iterative Solution of Nonlinear Equations in Several Variables, Academic Press, New York, 1970.
9
PSNR method 256 × 256 chemical clock elaine moon tree trui means 512 × 512 aerial airplane boat mandrill raffia stream means 1024 × 1024 bark man pentagon smarties stones traffic means 2048 × 2048 eifel boys plants pont church violine means
Fail %
VA θ2 (35) θ2 (5)
LM(6)
WA(9)
49.34 51.69 49.51 47.36 51.94 52.70 50.42
48.90 51.56 49.66 46.50 51.84 52.51 50.16
49.67 51.78 49.90 47.82 52.01 52.86 50.67
48.36 46.74 49.51 48.27 41.12 44.75 46.46
48.06 46.26 49.58 49.47 41.12 45.00 46.58
51.28 49.22 50.69 51.47 51.28 50.73 50.78 48.61 51.63 48.96 51.48 50.94 51.66 50.55
LM
Computation Time VA WA θ2 (35) θ2 (5)
0.00 0.02 0.00 0.00 0.00 0.00 0.00
0.06 0.06 0.06 0.05 0.05 0.05 0.05
0.07 0.08 0.07 0.07 0.07 0.07 0.07
0.13 0.14 0.13 0.13 0.12 0.13 0.13
0.03 0.02 0.03 0.03 0.03 0.03 0.03
0.00 0.00 0.00 0.00 0.00 0.00 0.00
0.00 0.01 0.00 0.00 0.00 0.13 0.02
0.25 0.27 0.24 0.23 0.32 0.24 0.26
0.33 0.49 0.32 0.30 0.54 0.36 0.39
0.57 0.56 0.57 0.56 0.57 0.56 0.57
0.11 0.10 0.11 0.10 0.11 0.10 0.11
0.01 0.40 0.01 0.91 1.22 0.30 0.48
0.00 0.00 0.00 0.00 0.00 0.00 0.00
0.00 0.00 0.00 0.03 0.04 0.01 0.01
1.29 1.20 1.29 1.34 1.31 1.31 1.29
1.60 1.59 1.66 1.77 1.78 1.73 1.69
2.60 2.55 2.53 2.55 2.52 2.53 2.55
0.48 0.46 0.48 0.49 0.44 0.47 0.47
0.97 0.13 0.24 3.50 1.73 1.59 1.36
0.00 0.00 0.00 0.00 0.06 0.10 0.03
0.05 0.00 0.02 0.09 0.28 0.22 0.11
8.17 7.45 7.35 7.78 7.16 7.25 7.53
12.36 10.44 9.29 10.90 10.23 11.29 10.75
13.15 13.15 13.15 13.24 13.16 13.12 13.16
2.41 2.38 2.39 2.39 2.40 2.37 2.39
VA θ2 (35) θ2 (5)
LM(6)
WA(9)
49.67 51.78 49.90 47.77 52.01 52.85 50.67
0.03 0.87 0.00 0.06 0.03 0.04 0.17
0.10 2.41 0.02 0.11 0.18 0.06 0.48
0.00 0.00 0.00 0.00 0.00 0.00 0.00
50.05 47.25 49.89 49.75 41.12 45.07 47.19
50.05 47.25 49.89 49.76 41.12 45.08 47.19
0.00 2.68 0.07 0.00 6.85 0.40 1.67
0.02 8.96 0.09 0.00 8.18 0.71 2.99
51.17 49.18 50.62 51.09 50.95 50.58 50.60
51.30 49.44 51.35 51.64 51.60 51.01 51.06
51.30 49.44 51.35 51.60 51.60 51.00 51.05
0.00 0.19 0.01 0.63 0.97 0.25 0.34
48.48 51.43 48.86 51.30 50.80 51.34 50.37
48.74 51.71 49.52 51.55 51.28 51.85 50.78
48.73 51.71 49.52 51.51 51.27 51.75 50.75
0.88 0.09 0.18 1.42 1.23 1.22 0.84
TABLE IV C OMPARISON
OF HISTOGRAM EQUALIZATION INVERSION ALGORITHMS .
10
original trui
zoom of stones
zoom of church
LM: (f − f˜) for trui
LM: zoom(f − f˜) for stones
LM: zoom(f − f˜) for church
WA: (f − f˜) for trui
WA: zoom(f − f˜) for stones
WA: zoom(f − f˜) for church
VA-θ2 (35): (f − f˜) for trui
VA-θ2 (35): zoom(f−f˜) / stones
VA-θ2 (35): zoom(f−f˜) / church
VA-θ2 (5): (f − f˜) for trui
VA-θ2 (5): zoom(f−f˜) / stones
VA-θ2 (5): zoom(f−f˜) / church
Fig. 4. Comparison of ordering methods for histogram equalization inversion. First row: true images or parts of them. The following rows show the difference images between the original one and those obtained after histogram equalization inversion. Top to down: LM(6), WA(9), VA-θ2 (35), VA-θ2 (5). The variational methods (VA) contain much less errors than those achieved by LM(6) and WA(9). Moreover there is no visual difference between VA with 35 iterations and its faster variant with only 5 iterations.